Top universities and national intelligence
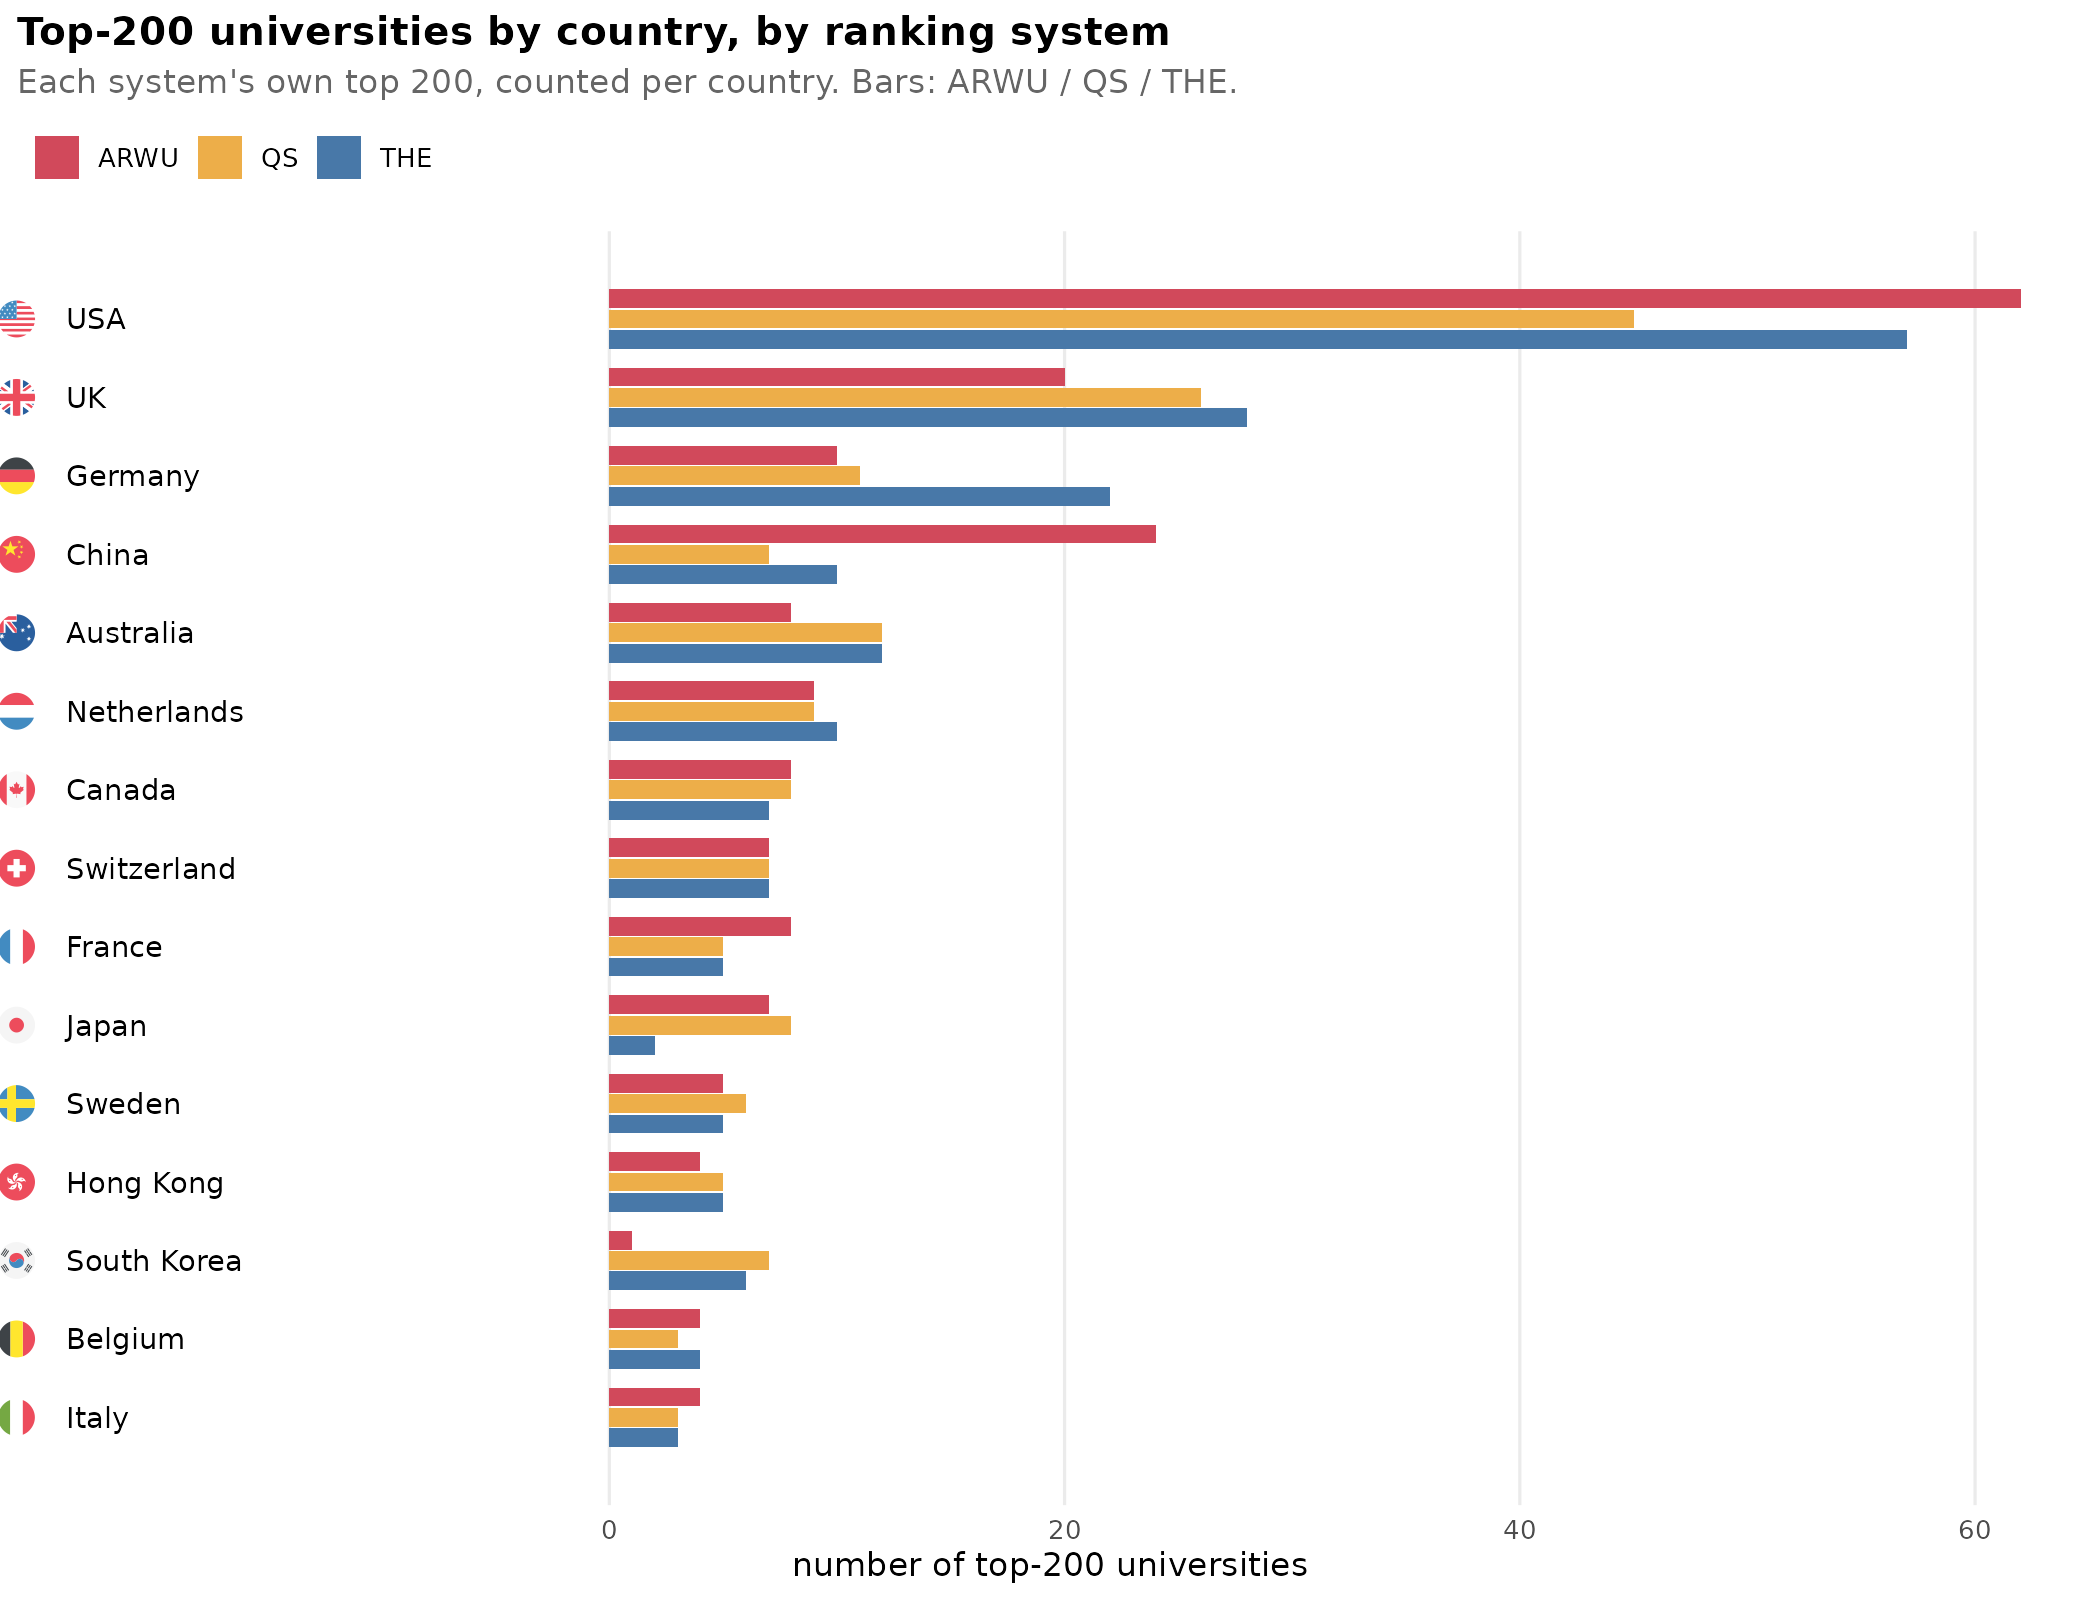
We all know that universities differ in quality. But what exactly do we mean by that? How do we determine which are the top universities? There are a number of…
We all know that universities differ in quality. But what exactly do we mean by that? How do we determine which are the top universities? There are a number of…
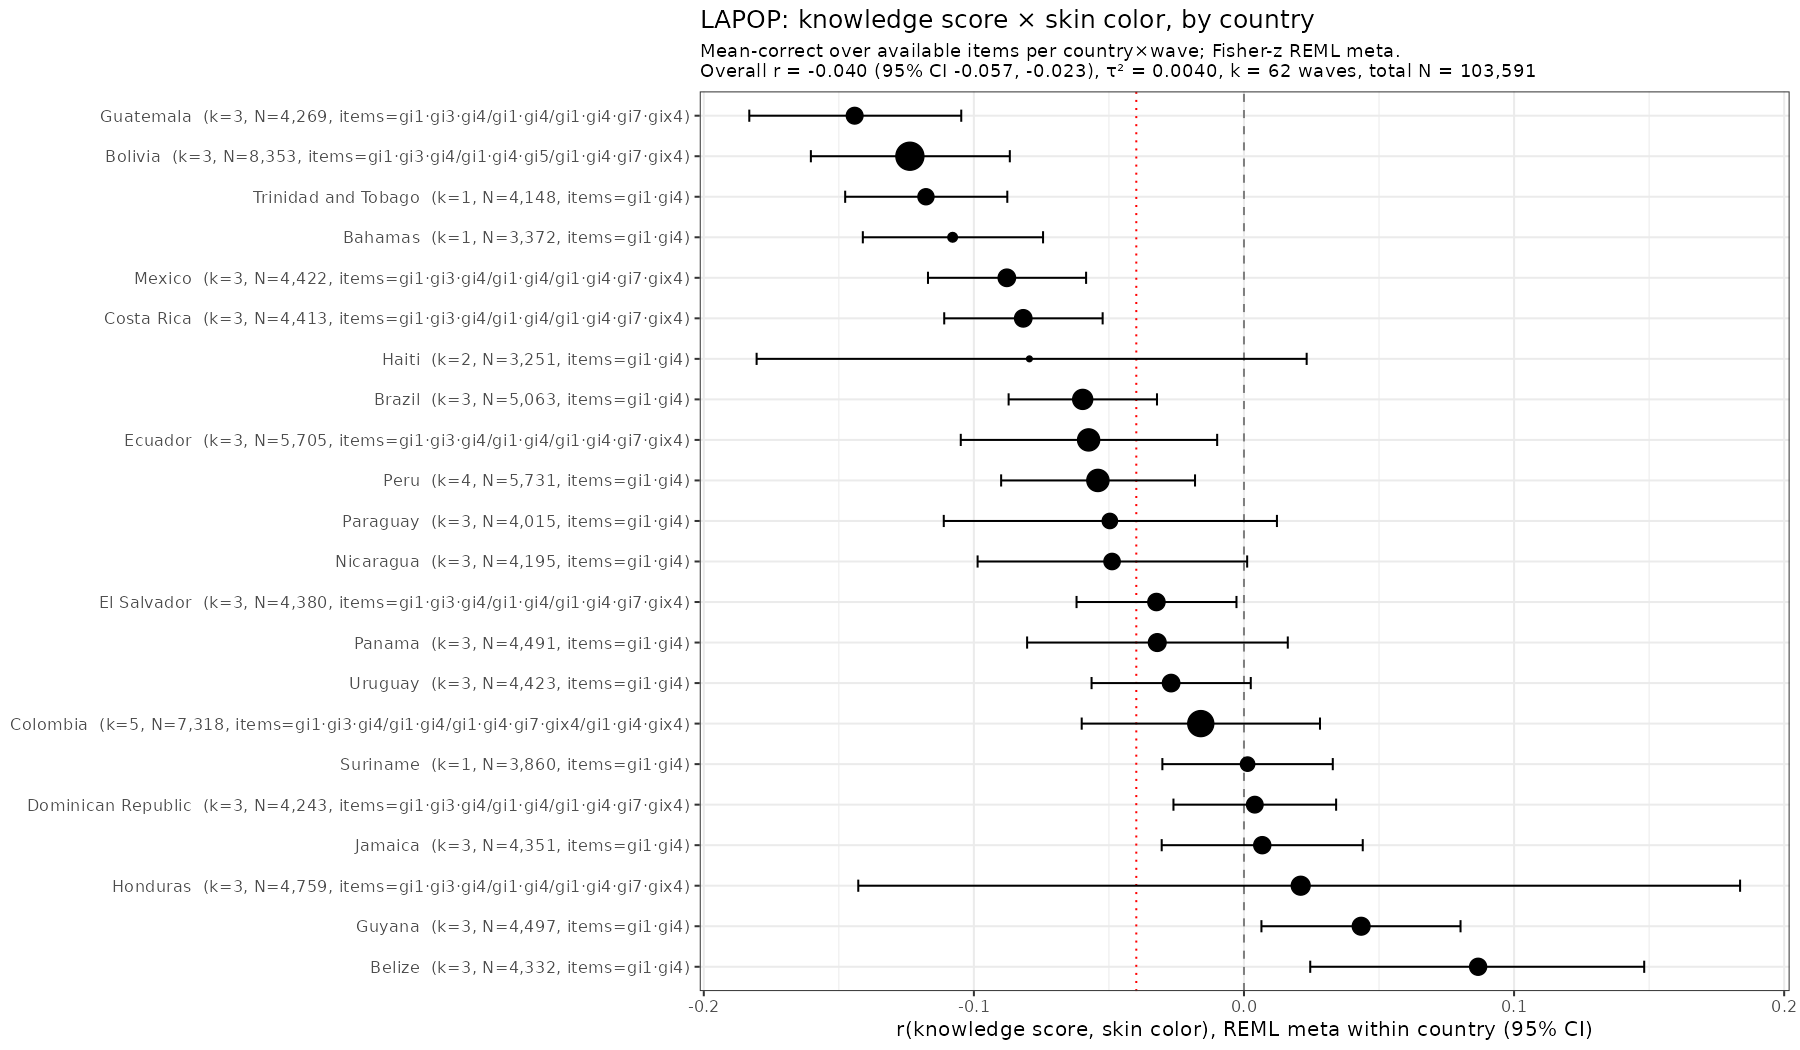
Skin color (lightness or brightness) has been used as a proxy for genetic ancestry for over 100 years. It works alright in many cases. Take this study (Parra et al…
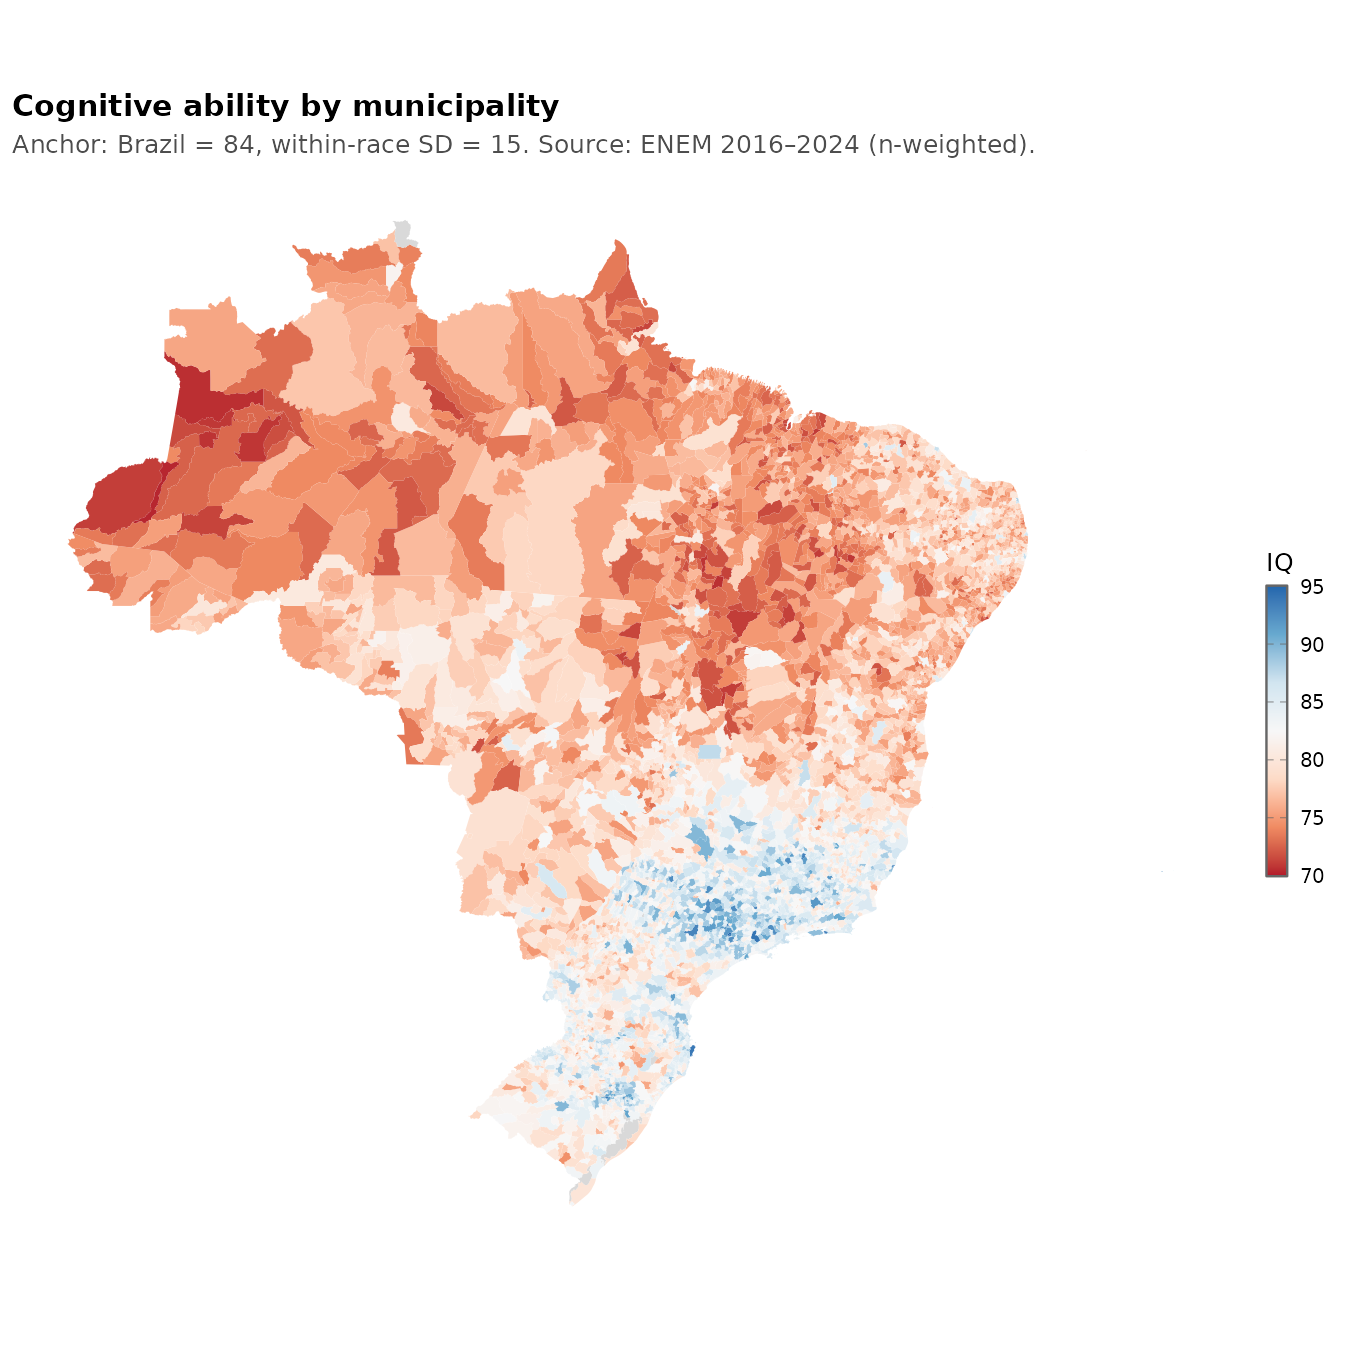
Many years ago I discovered that Brazil publishes the subject level data for many scale testing efforts. These also come with rich surveys concerning the children's homes. The main tests…
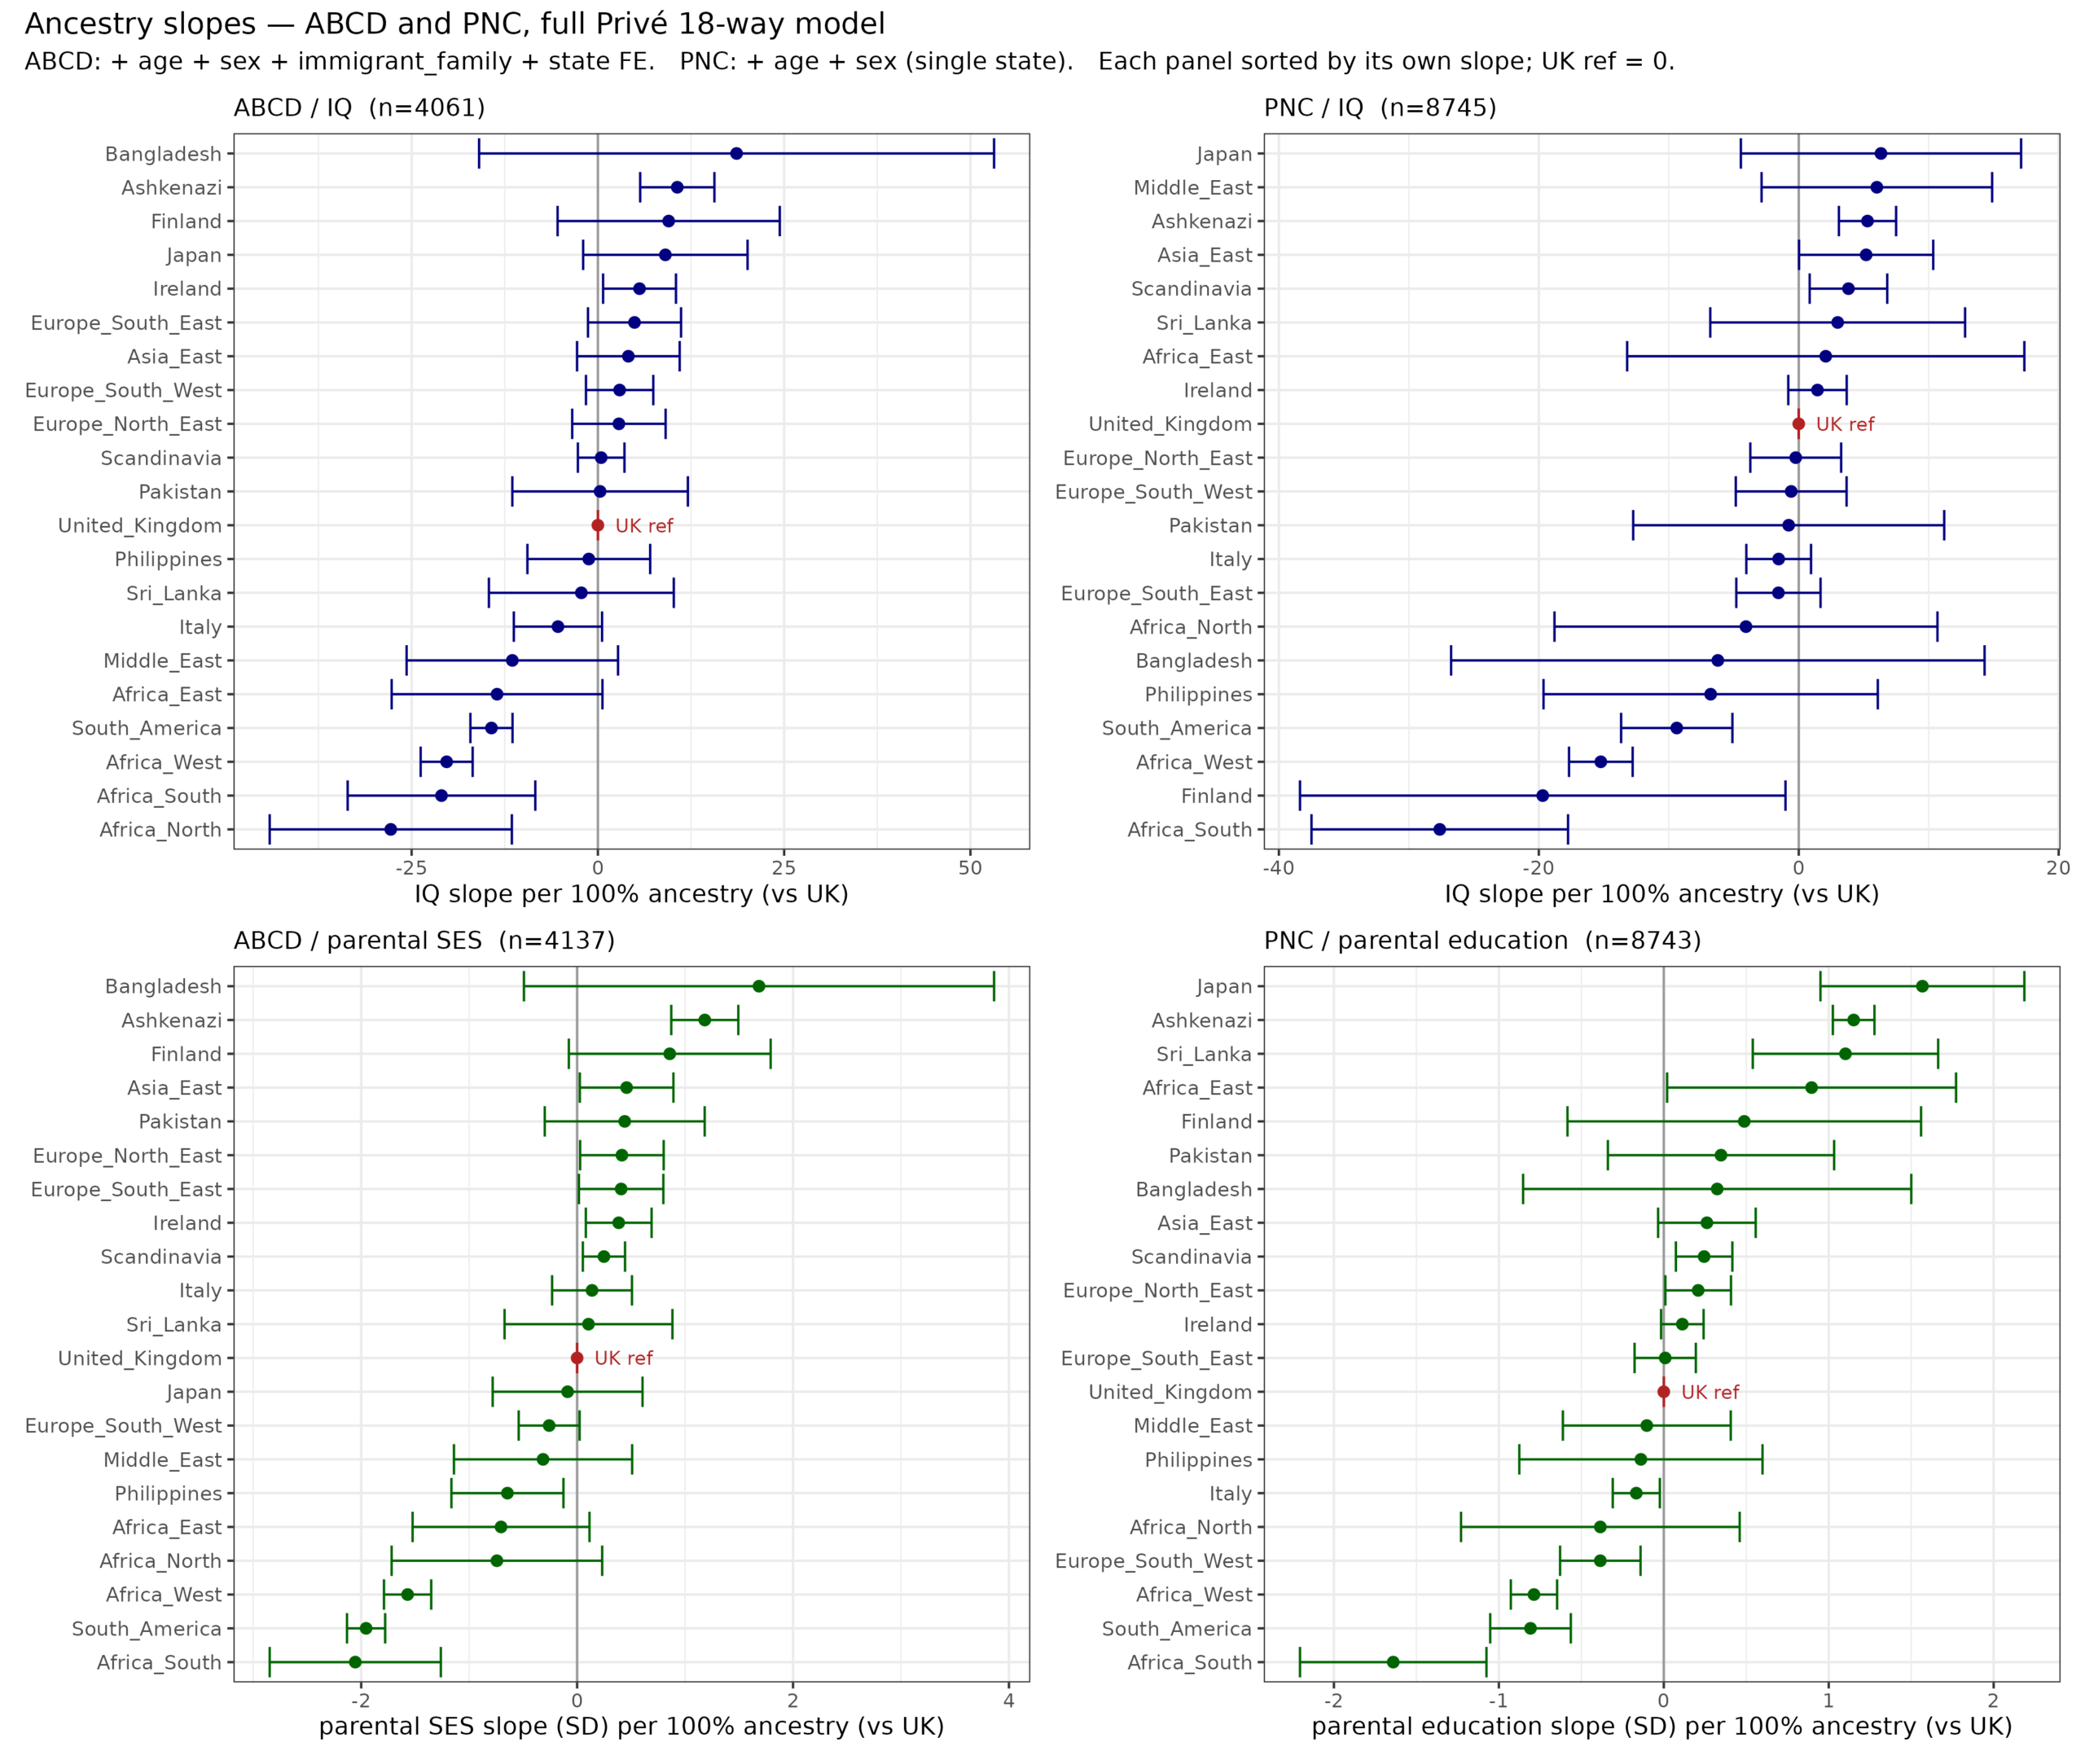
There are long standing questions about the source of Jewish achievement. Most of this achievement relates to the Ashkenazi subgroup, less so the other Jews. This tells us that the…
Some days ago I posted some cumulative growth charts for OECD countries, like this one: These results are somewhat affected by the usual GDP issues relating to tax haven (Ireland…

So we did another study of leftism, mental health and visual presentation: Hu, M.,& Kirkegaard, E. O. W.(2026). Left-wing ideology, mental health and body modifications. Journal of Open Inquiry in…

A politician from the Social Democrats called Frederik Vad (center-left government party) posted results of a survey about how safe citizens report feeling in various areas of the country. There…

Jews are an extraordinarily successful ethnic group in almost everything they choose to engage in, from physics to politics with the curious exception of US presidencies. Seb Jensen compiled a…
Yesterday, I posted a new cognitive test on taketest.xyz, the Confidence Calibration Test. If you want to take the test without biased results, take it now before reading further. You…
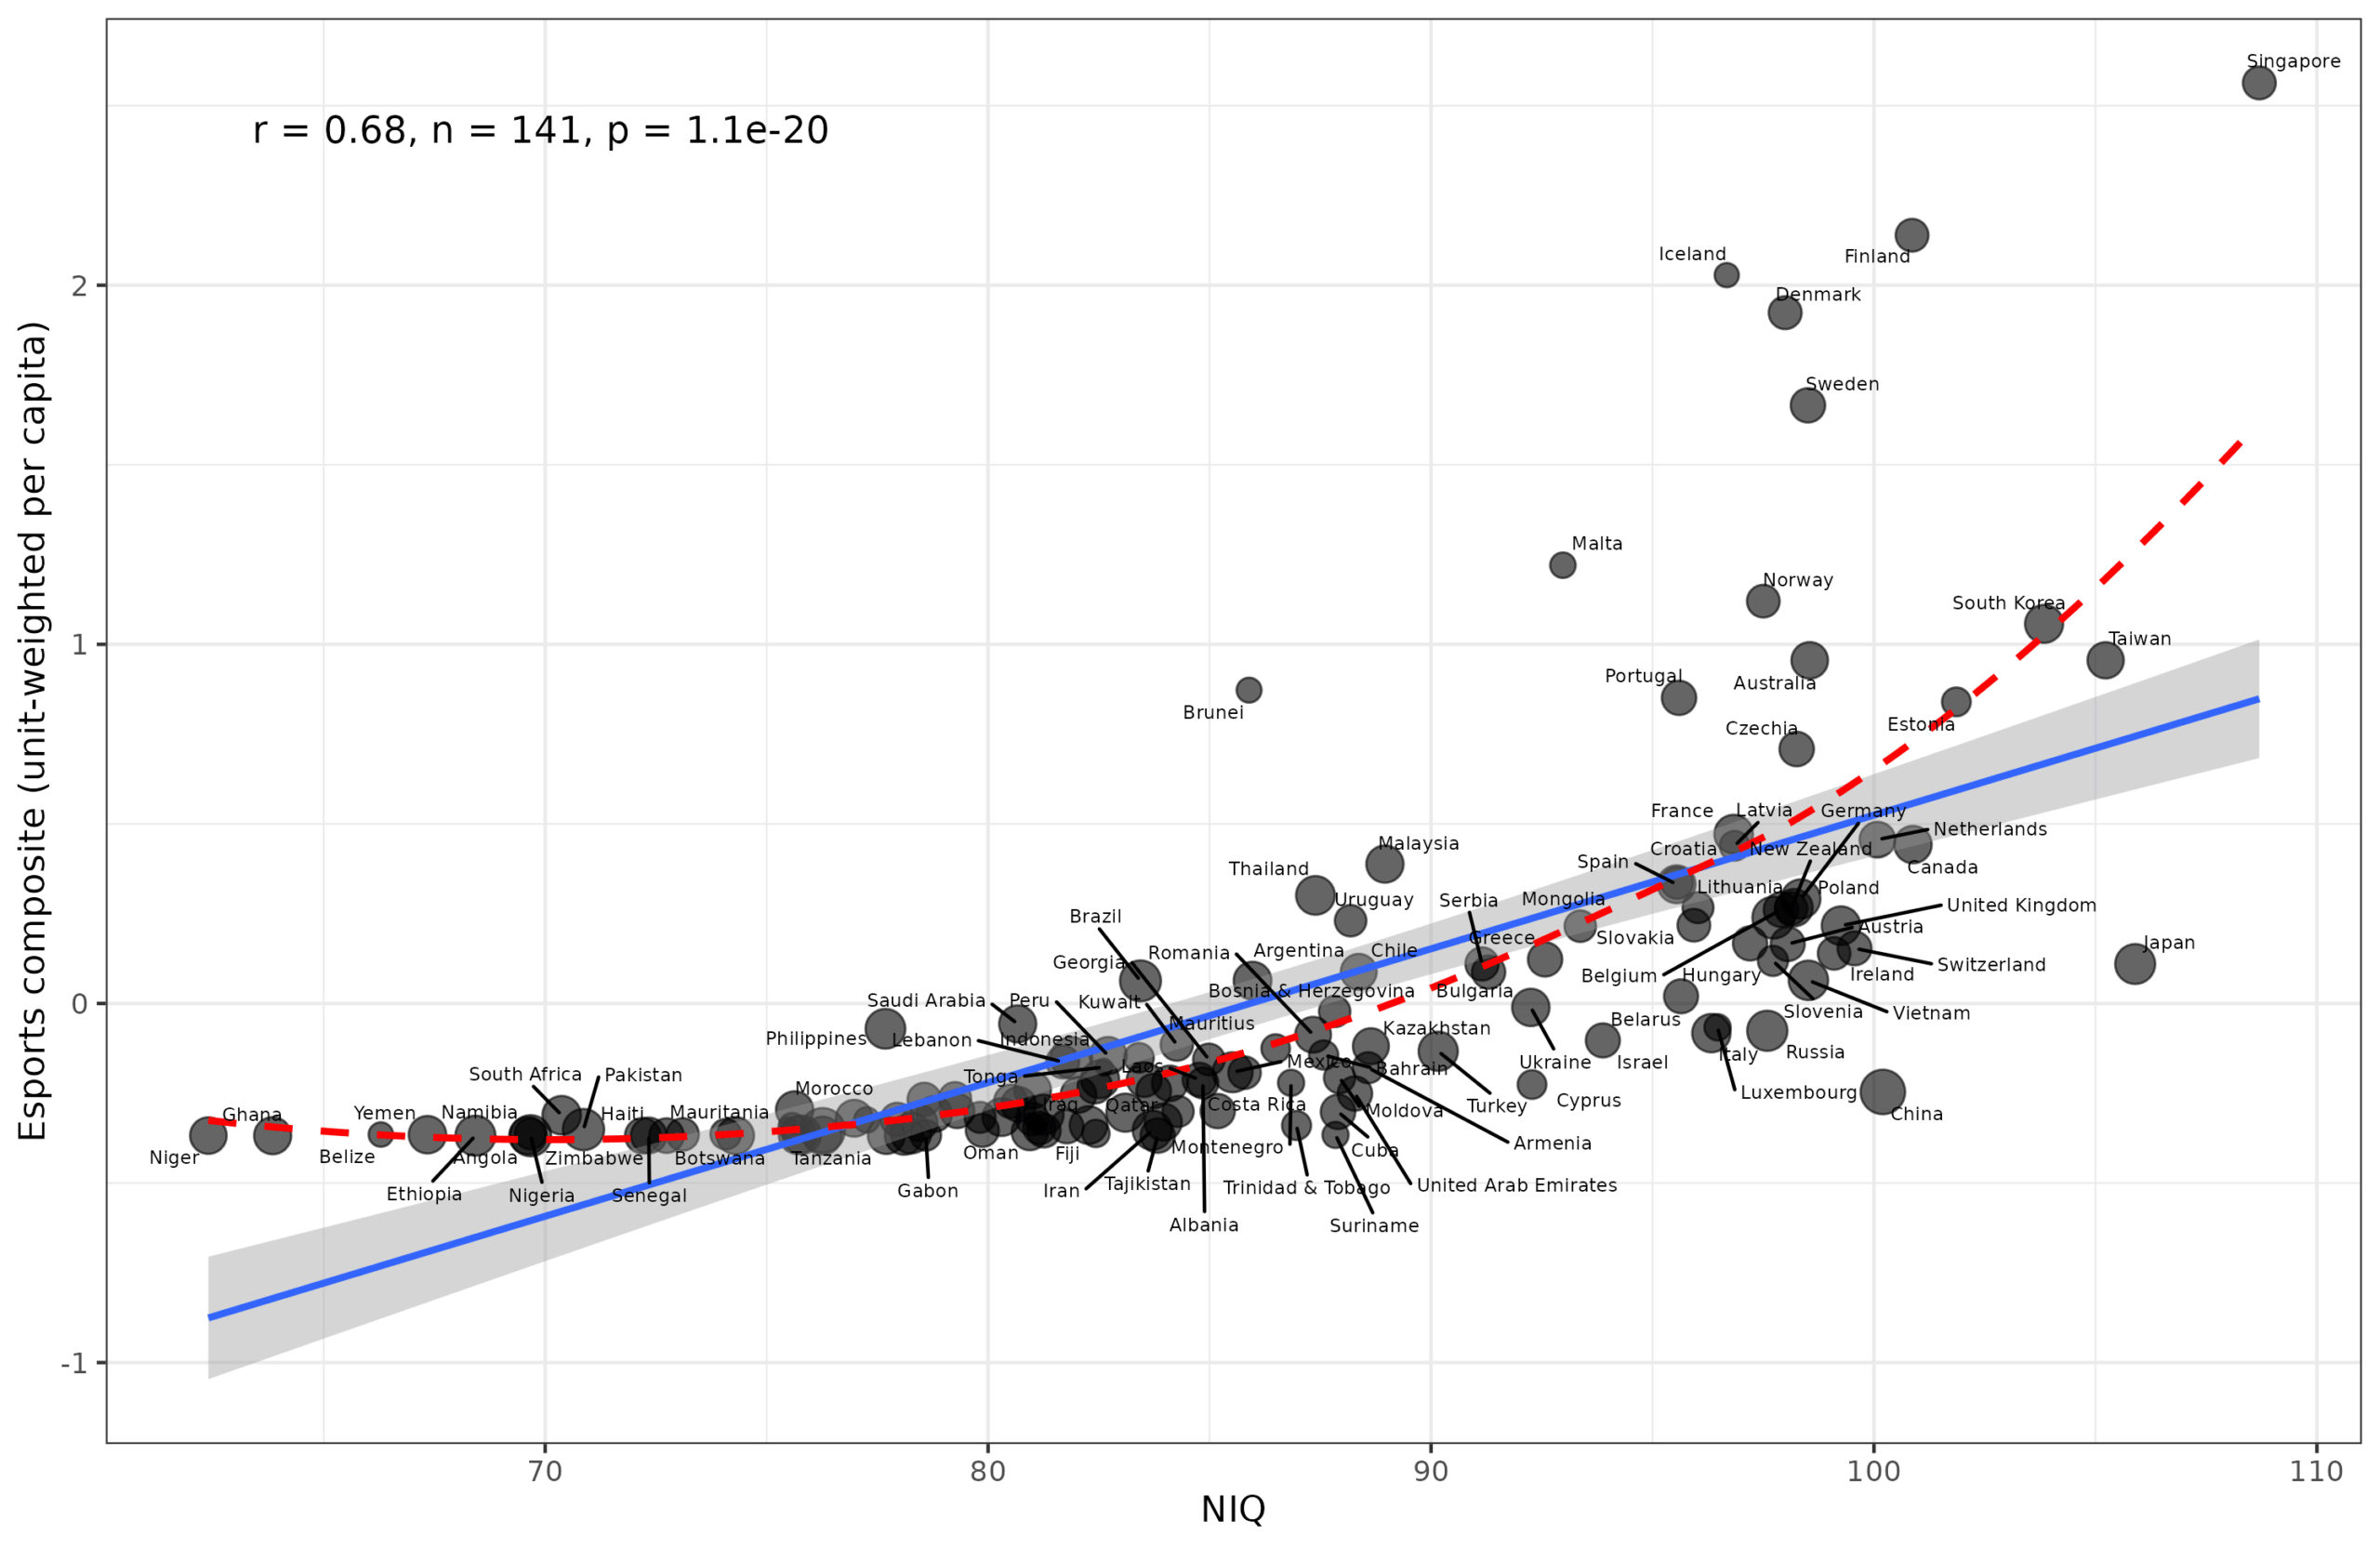
Given the ease of obtaining scraped datasets with Claude Code, I thought we could update my 2019 study of mental sports with the newest data and better methods. The primary…