Sexual maturation and intelligence, Rushton not vindicated
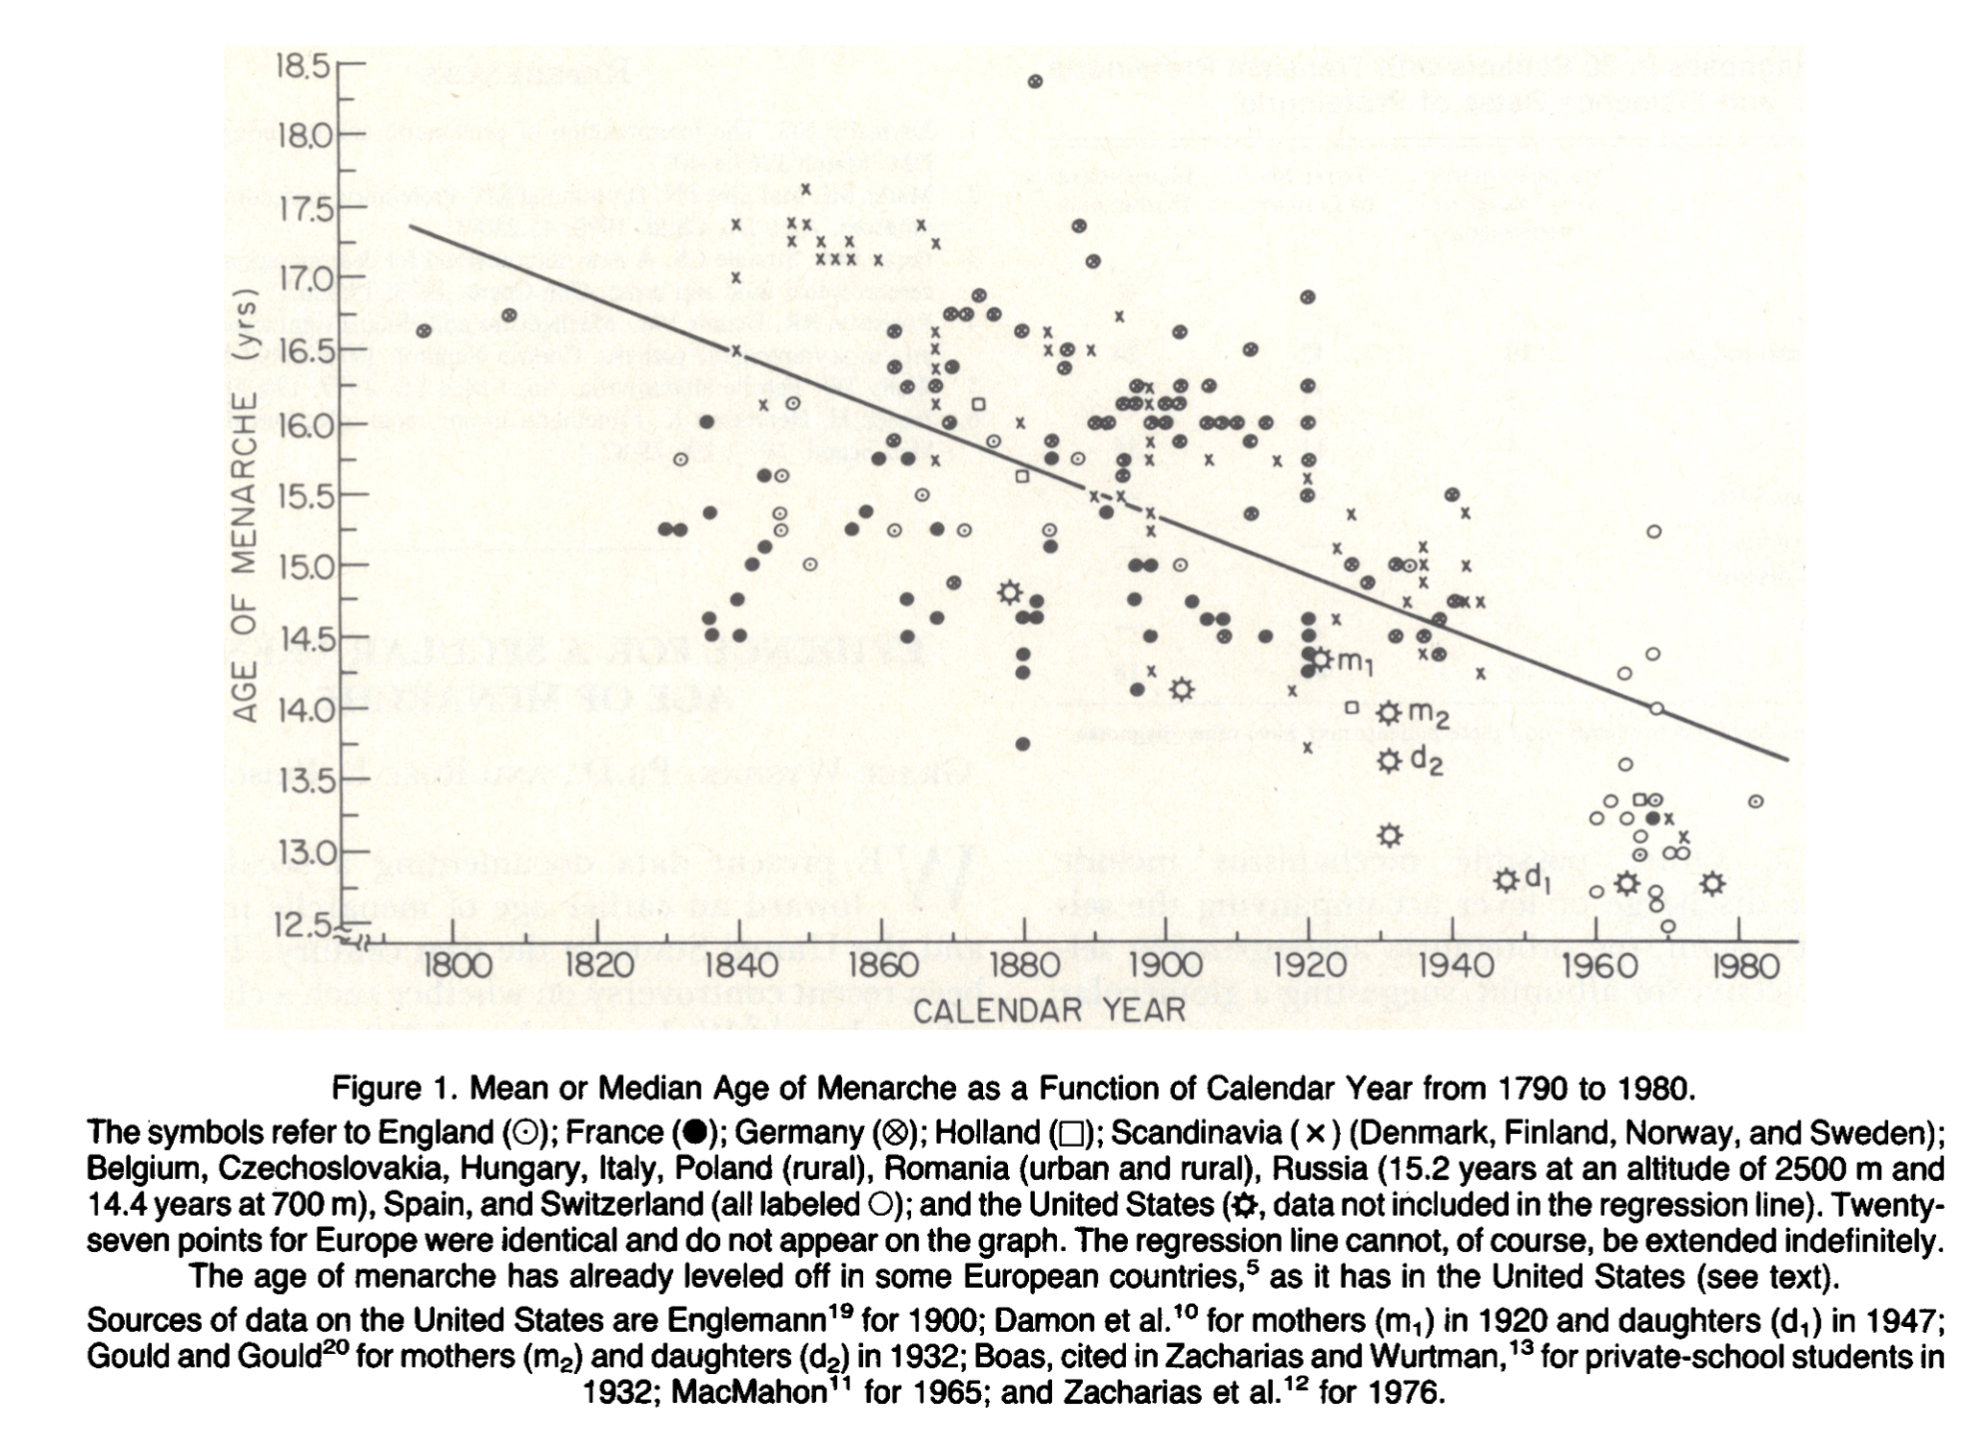
A reader sent me Seb Jensen's blogpost about nerds, which includes the following: People in the Terman’s study of the gifted were more likely to be tall, broad-shouldered, have matured…
A reader sent me Seb Jensen's blogpost about nerds, which includes the following: People in the Terman’s study of the gifted were more likely to be tall, broad-shouldered, have matured…

A few days ago, geneticist Shai Carmi posted a new study on Twitter. And then he deleted his tweet and reposted a "I disavow" version. Well, what happened is that…
Over the years, the enthusiastic fans of Jean Francois Gariepy (JFG) have been trying to goad me into reading his book. I had avoided it because people I trust say…
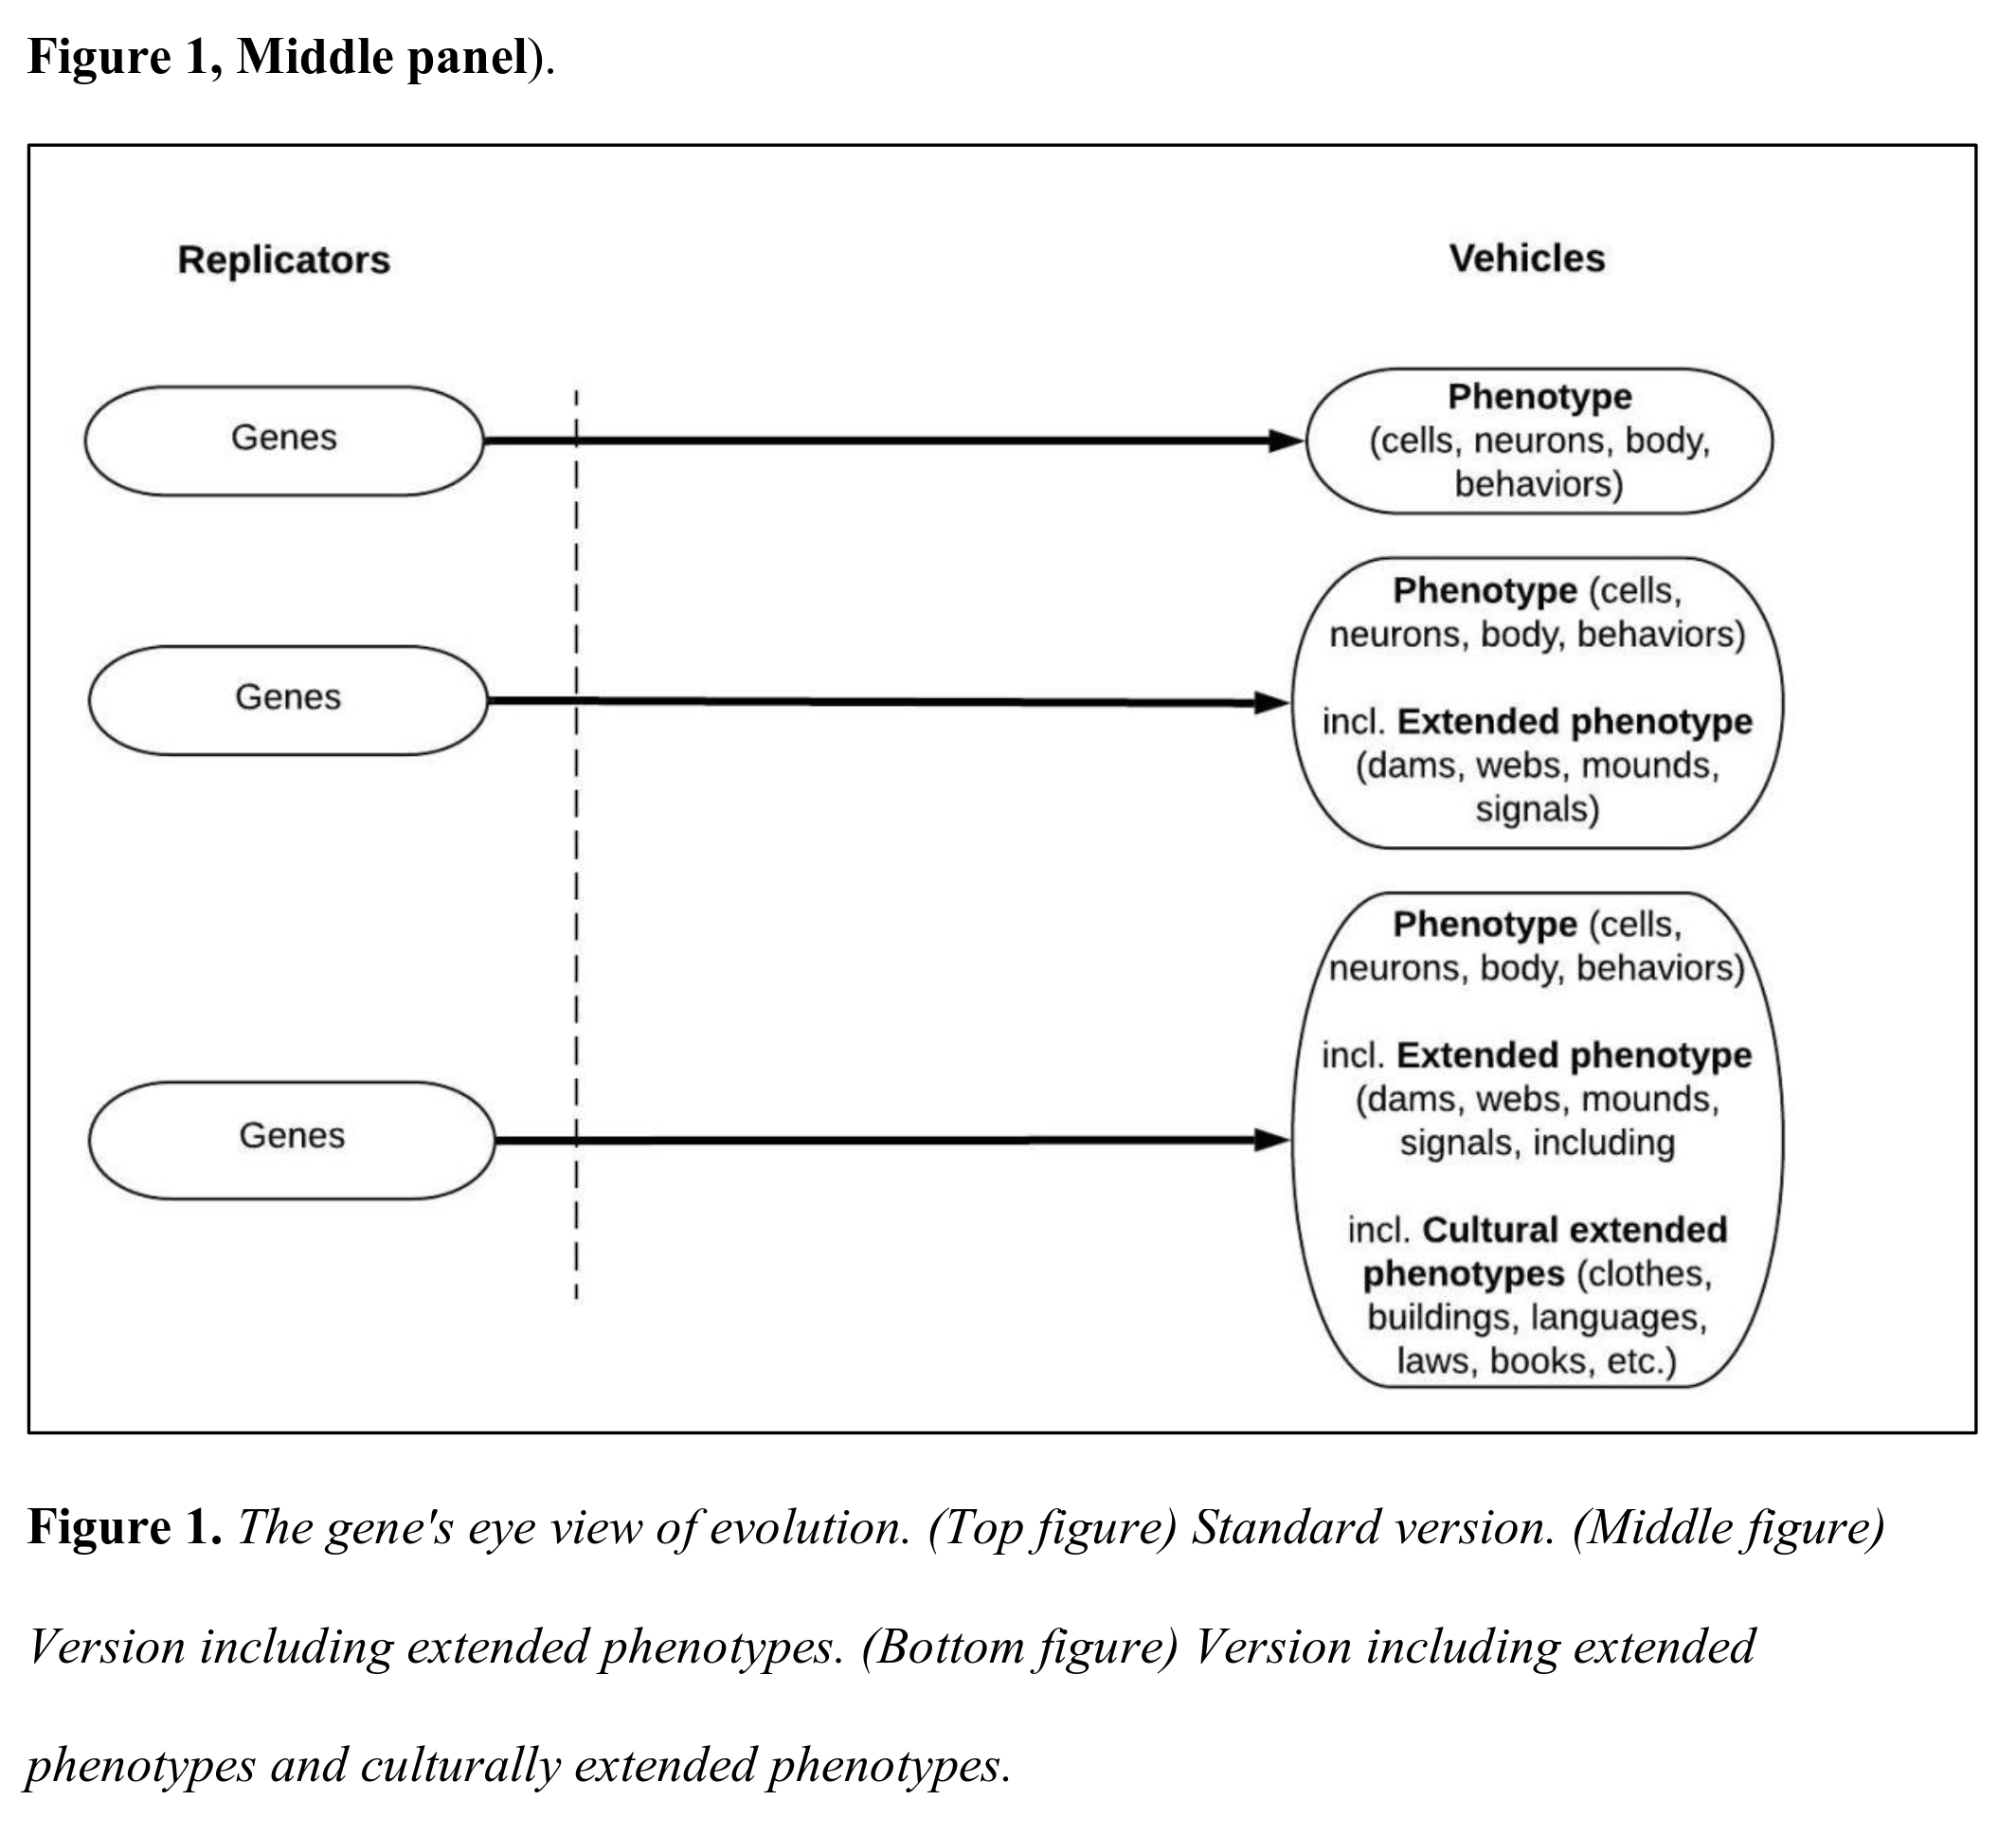
Back in 1982 Richard Dawkins wrote a book called The Extended Phenotype, which argued that the "phenotype should not be limited to biological processes such as protein biosynthesis or tissue…
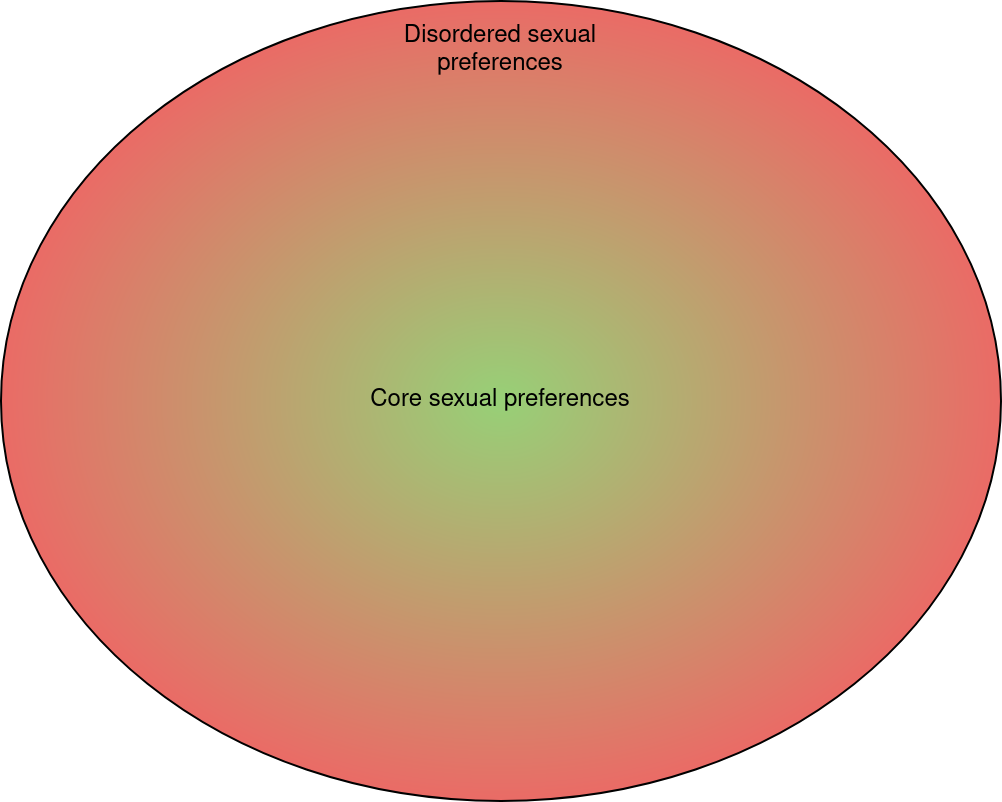
In the continuing debate about mental illness, we have roughly the following situation: Bryan Caplan representing the Thomas Szasz camp Scott Alexander representing the pragmatist "define mental illness in a…
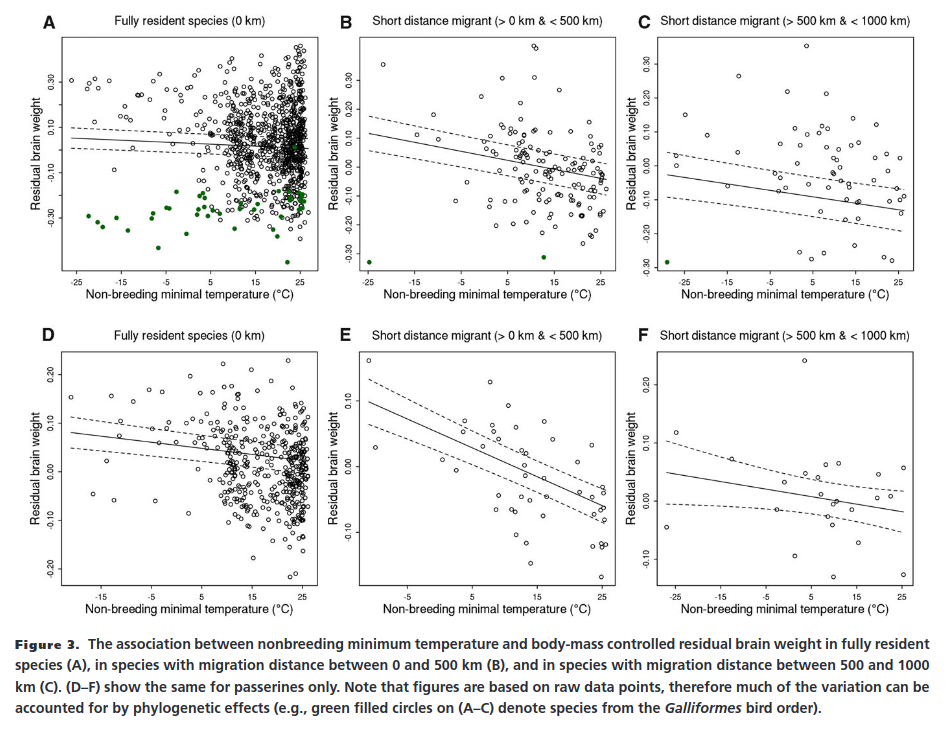
Cold winters theory gets at bad name, even from fellow hereditarians. In fact, the article about it was deleted from Wikipedia too. In my opinion that's because they are not…
Together with Ed Dutton and Helmuth Nyborg: Dutton, E., Nyborg, H., & Kirkegaard, E. O. W. (2022). Europeans Have Larger Testes than Sub-Saharan Africans but Lower Testosterone Levels. Mankind Quarterly,…
There are many studies that look at signs for selection using large genomic datasets. This post provides a selective summary of such studies from 2018 to now, so very recent…
Anon on Reddit writes me: Hey, Emil! I’ve been a fan of your work for a while now. I respect your effort to give a voice to persecuted research directions.…
Doing a lot of background reading on animal ecology, I found this review paper: Lefebvre, L. (2013). Brains, innovations, tools and cultural transmission in birds, non-human primates, and fossil hominins.…