My recent blogpost about Africans propensity to violence got some attention. In the post I noted that direct evidence was mostly missing. I’ve done some further reading, and discovered that this isn’t actually true. There are two lines of direct evidence for genetic differences in aggression between human races or ethnic groups.
MAO-A: the ‘warrior’ gene (Monoamine oxidase A)
Some people asked why I had left out this evidence. The reason why is that I thought it was a false positive from the days of candidate genetics. For those unfamiliar, in the candidate genes era of research, researchers would come up with an ostensible plausible hypothesis about why some genetic variant (usually a SNP) would be associated with some phenotype (“the candidate”). Then they would find a small convenience sample and obtain p < .05 in some analysis. This approach was far too flexible, and later research showed that almost all of these purported findings were false positives obtained from p-hacking and publication bias. Scott Alexander has a great write-up of this story: 5-HTTLPR: A Pointed Review (2019). Nowadays, geneticists have mostly learned the lesson and now apply proper multiple testing adjustments to their p values (in GWASs) and use robust out of sample tests to verify findings.
But not all findings from the candidate gene era of research were false positives. Perhaps the most famous example are the APOE gene variants (Apolipoprotein E), which have very strong association with dementia. These have been replicated well in modern, proper studies, and also show sizable associations with intelligence (typically -5 IQ for the bad variants). This connection with intelligence is not surprising because as shown in my prior post on the Norwegian sociogenomics/cognitive sociology study, intelligence is a protective factor of dementia. It appears that the more intelligent the brain is, the better or longer it is able to withstand the negative effects of aging, a kind of cognitive buffer or reserve.
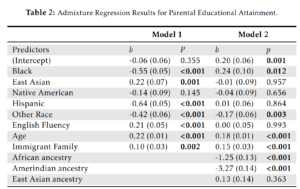
What then are the findings for aggression and MAOA? There are several variants of interest in this gene. Most studies focus on the number of repeats of a sequence of 30 letters that controls the amount of protein produced. People have either 2, 3, 4, or 5 copies of this sequence on their X chromosomes (men only one copy, so larger genetic variance). There are ethnic differences in the frequencies of these variants. In a 2013 study, it was shown that the quite rare 2-repeat (2-R) variant “was carried by 0.1 % of Caucasian males and by 5.2 % of African-American males.”. Its association with aggression was confirmed in the same study, the American Add Health dataset:
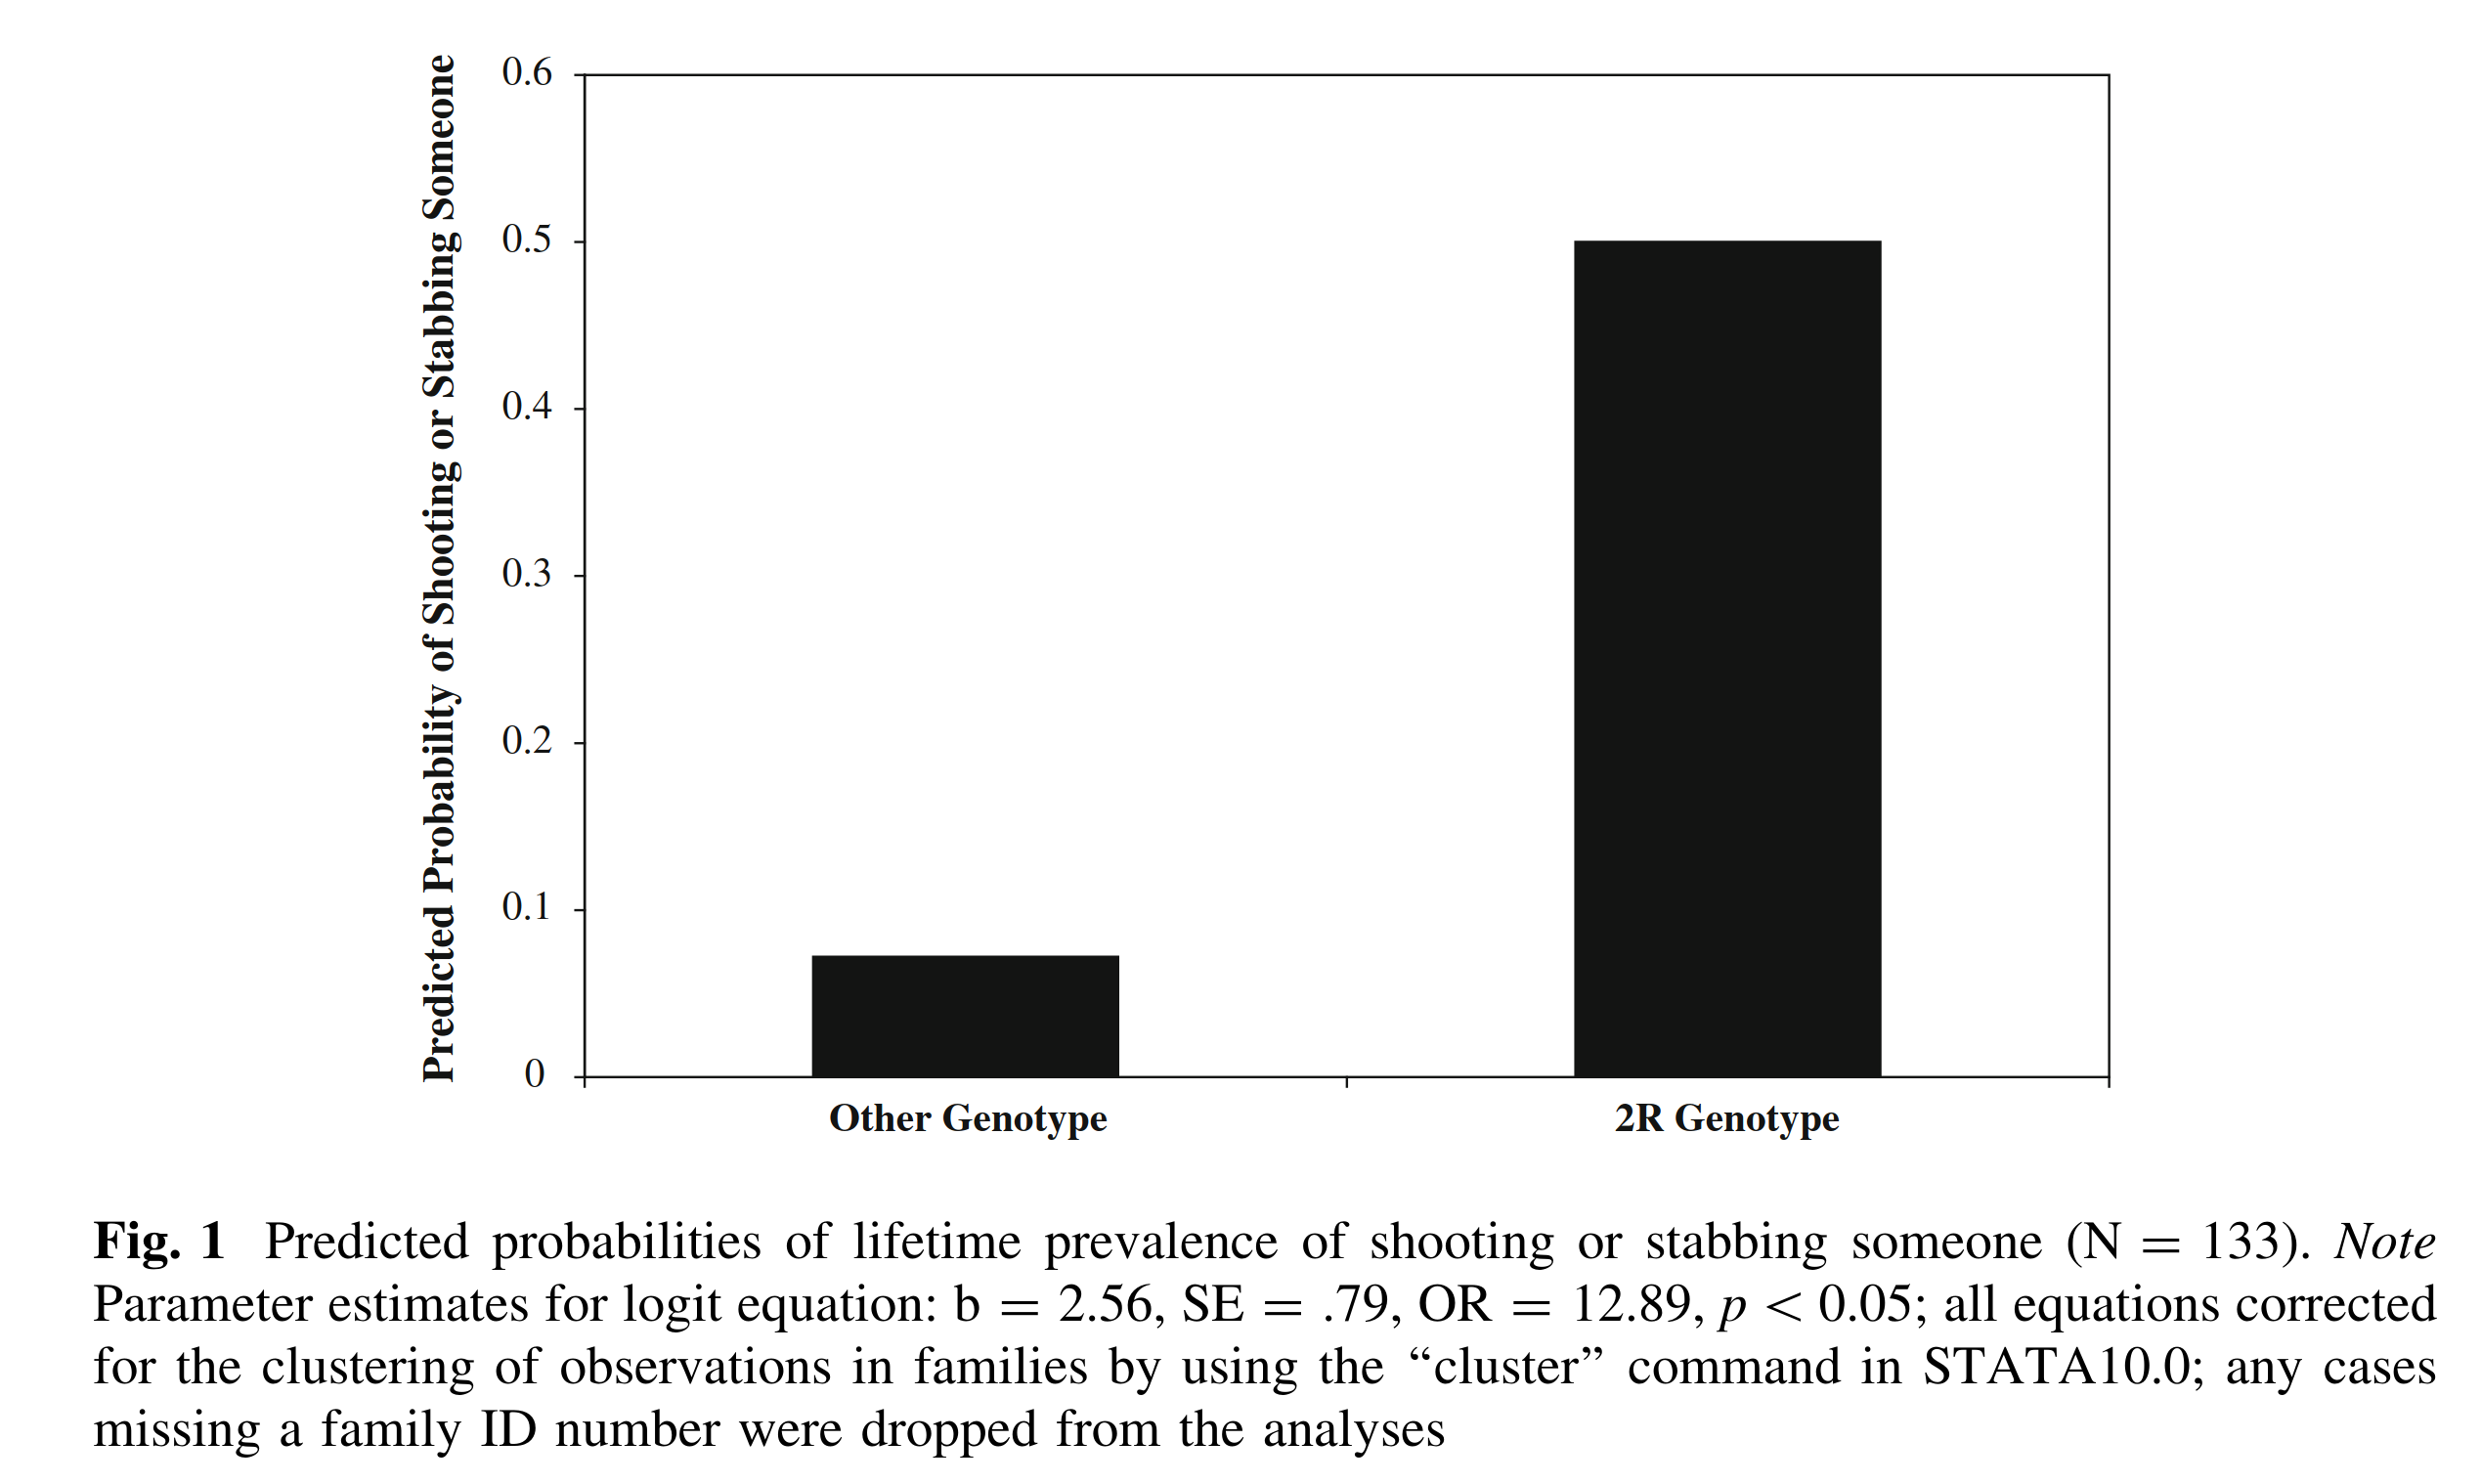
It says p value, but since the standard error is given, we can compute the p value to be quite small (test statistic 3.24). This finding was confirmed by a 2020 dissertation which also analyzed the Add Health dataset:
MAOA is the polymorphism row with p < .001. It is curious that there is no effect of African American membership here (p = .25), but I think that’s because their outcome variable is based on self-reported behavior, which is very unreliable and biased for African Americans.
Still, I wasn’t convinced this wasn’t a false positive until I discovered this Finnish dissertation from 2023 which found:
We conducted separate association analyses for 704 Crime participants and 96 homicide offenders, compared with 1946 controls. The analysis of Crime participants and controls revealed a strong association between the MAOA low- activity genotype and violent offending (OR 1.71, p = 2.9 × 10⁻⁵), particularly extremely violent offending with an OR of 2.66 (p = 1.6 × 10⁻⁴). We also tested the effect of maltreatment on the risk; however, no strengthening of the signal was observed. In the classic study of Caspi et al. (Caspi et al., 2002), the low-activity genotype was associated with offending, but only in the interaction with childhood maltreatment, whereas our results displayed a clear main effect. In the cohort of homicide offenders (N=96), the OR was slightly diluted (1.50, 95% CI 0.82–2.72). Again, the phenotype differs from the corresponding phenotype in the Crime sample and is perhaps closer to the one of Caspi et al. (2002), although their sample did not include homicide offenders (Caspi et al., 2002).
The use of a large Finnish sample rules out worries that this could result from improperly controlled population stratification (“representative cohort of Finnish offenders exclusively of Finnish origin”), and the small p values rule out a chance finding. It appears then that the MAOA variant is for real.
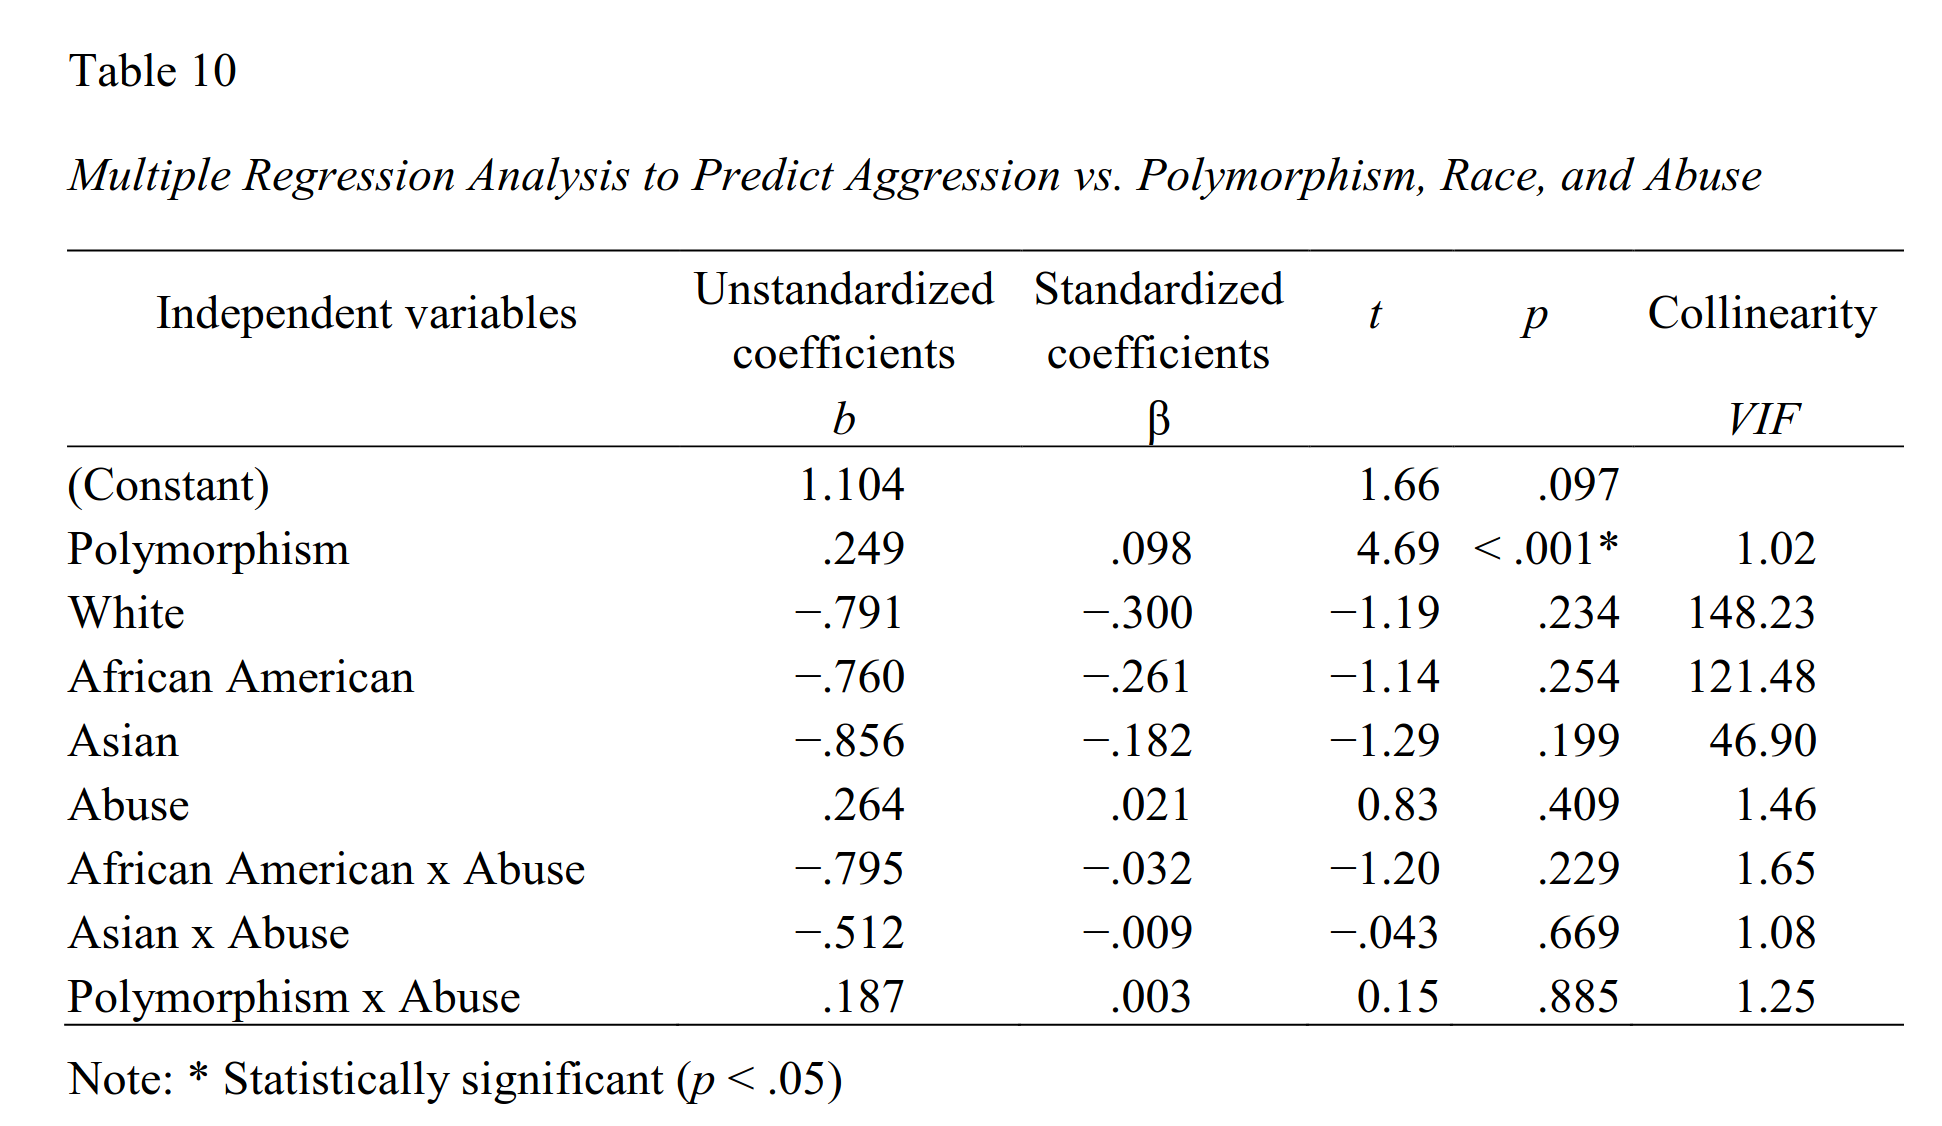
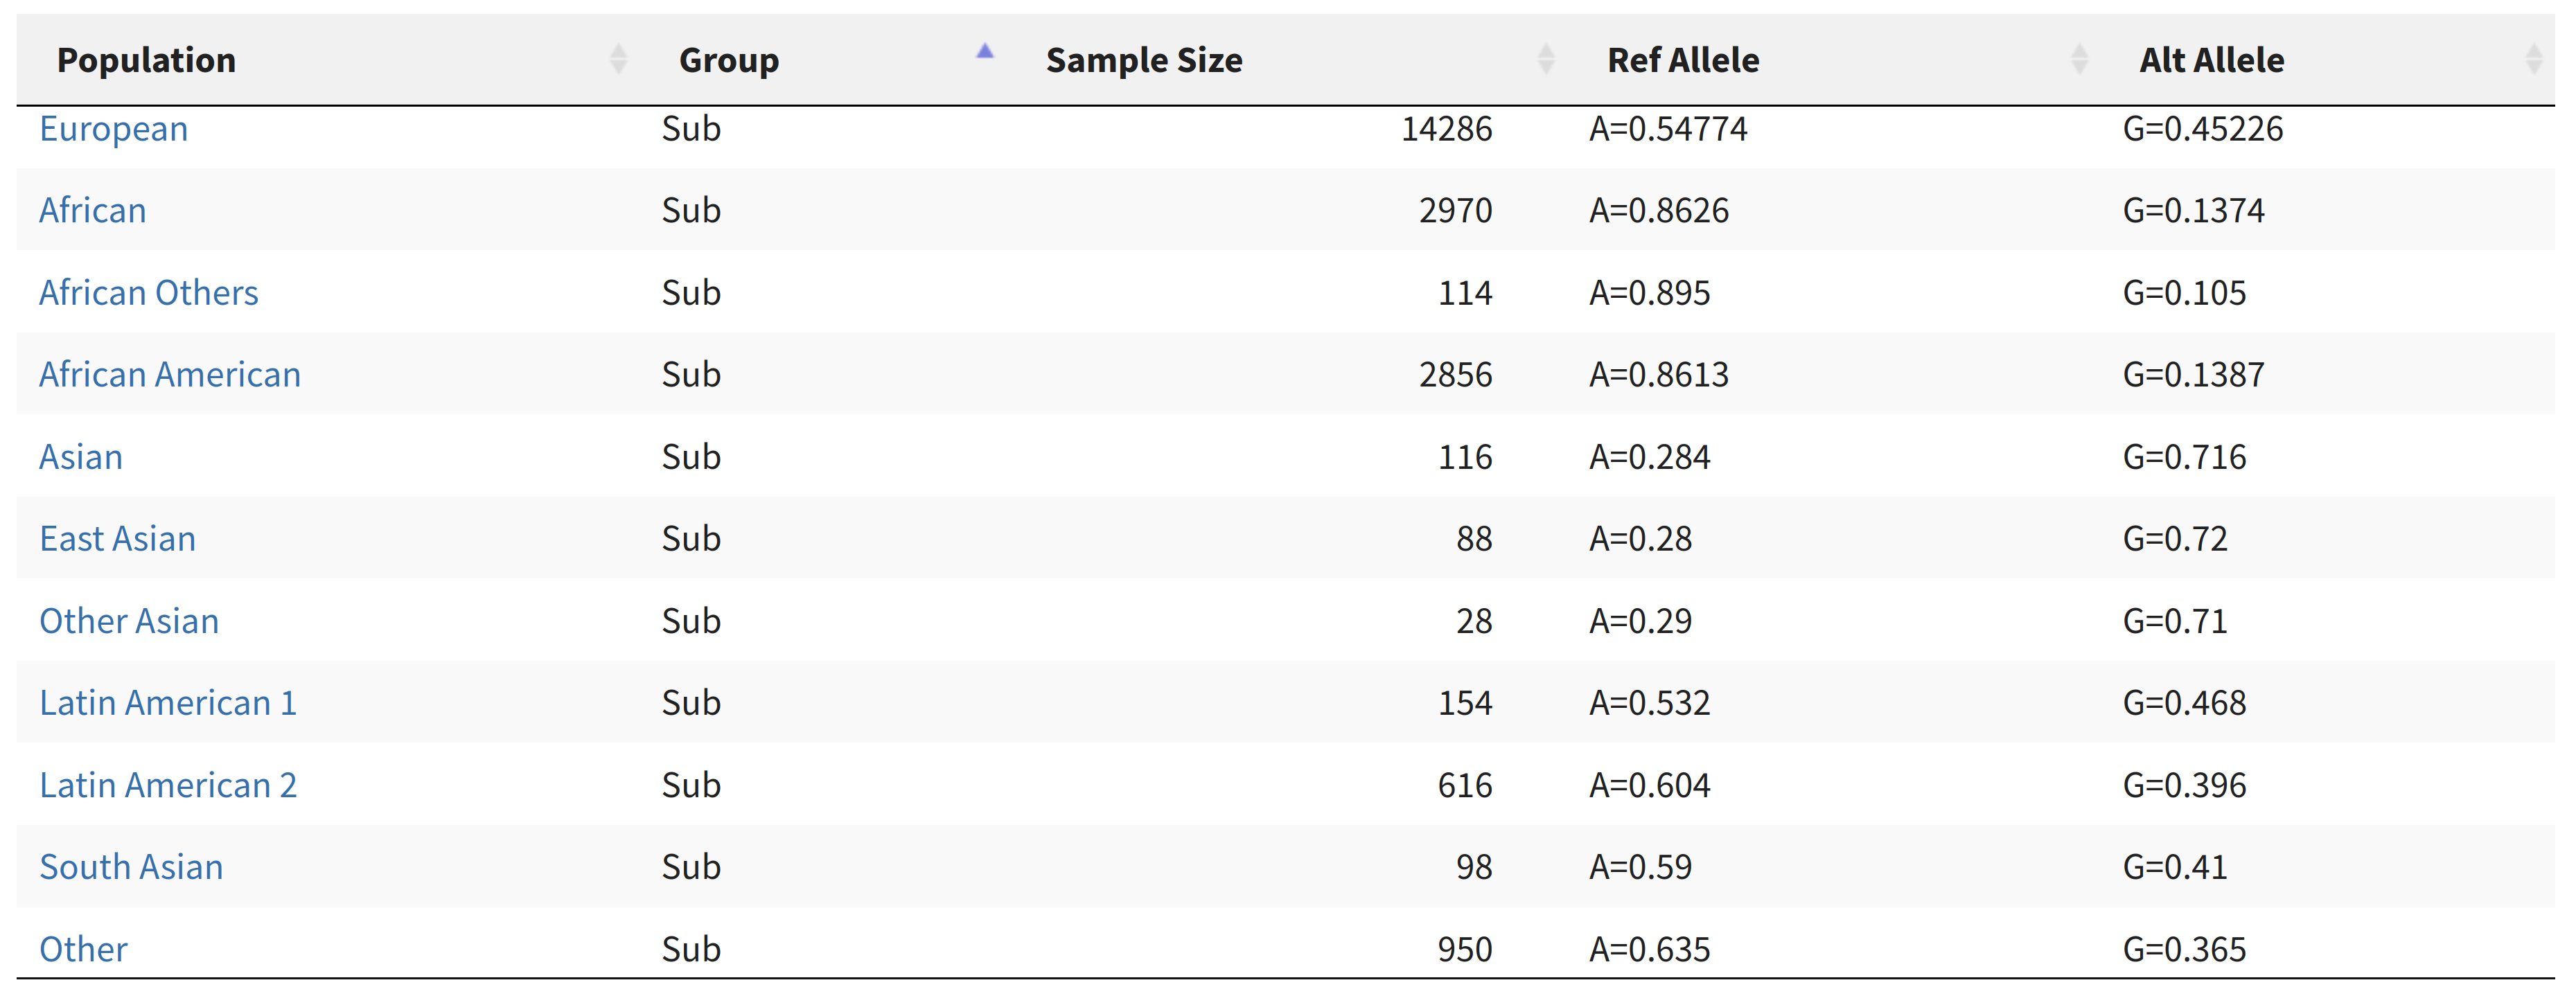
The trouble with studying MAOA is that most genetic data is from microarrays and microarrays cannot measure repeated sequences directly. For this reason, one has to rely on SNPs close by that are statistically linked to these (linkage disequilibrium). One such SNP is rs909525. Based on my reading, it seems the A (or T on the reverse strand) allele is the one associated with aggression. We can look up the frequencies of this variant on dbsnp, and we see:
One population stands out as having a particularly low frequency of the aggression linked variant: Asians. This is reassuring because Asians, no matter their intelligence, are particularly low in violent crime rates in western countries, usually having rates below those of the natives, even when these are Danes:
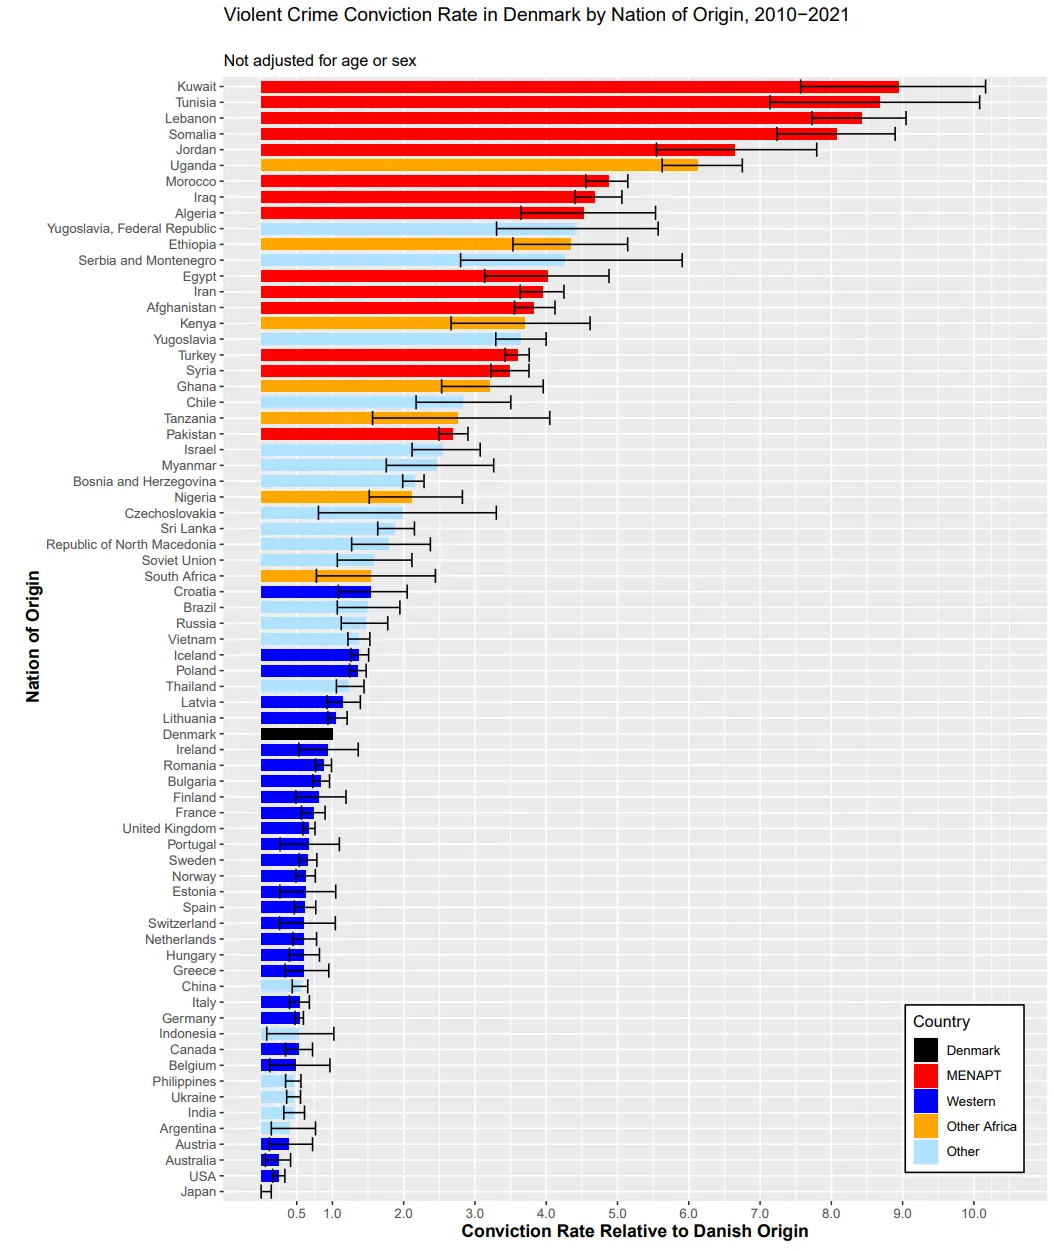
Notice the position of the Asian immigrants: Japanese (not a single recorded violent crime in 11 years of data!), India, Philippines, Indonesia, China are all below the Danish violent crime rate. A few groups are above (Thailand, Vietnam both marginally, Sri Lanka and Myanmar substantially. I offer no particularly explanation for these.)
There seems to be a kind of genetic Asian protective factor, and these frequencies are exactly in line with that finding. Africans do also appear to have a somewhat higher frequency of the aggression variant compared to Europeans, but not much. Using this proxy variant alone is probably not precise enough to understand ethnic differences.
In a study 2020 study of 320 people of different ethnic groups in Russia it was found that:
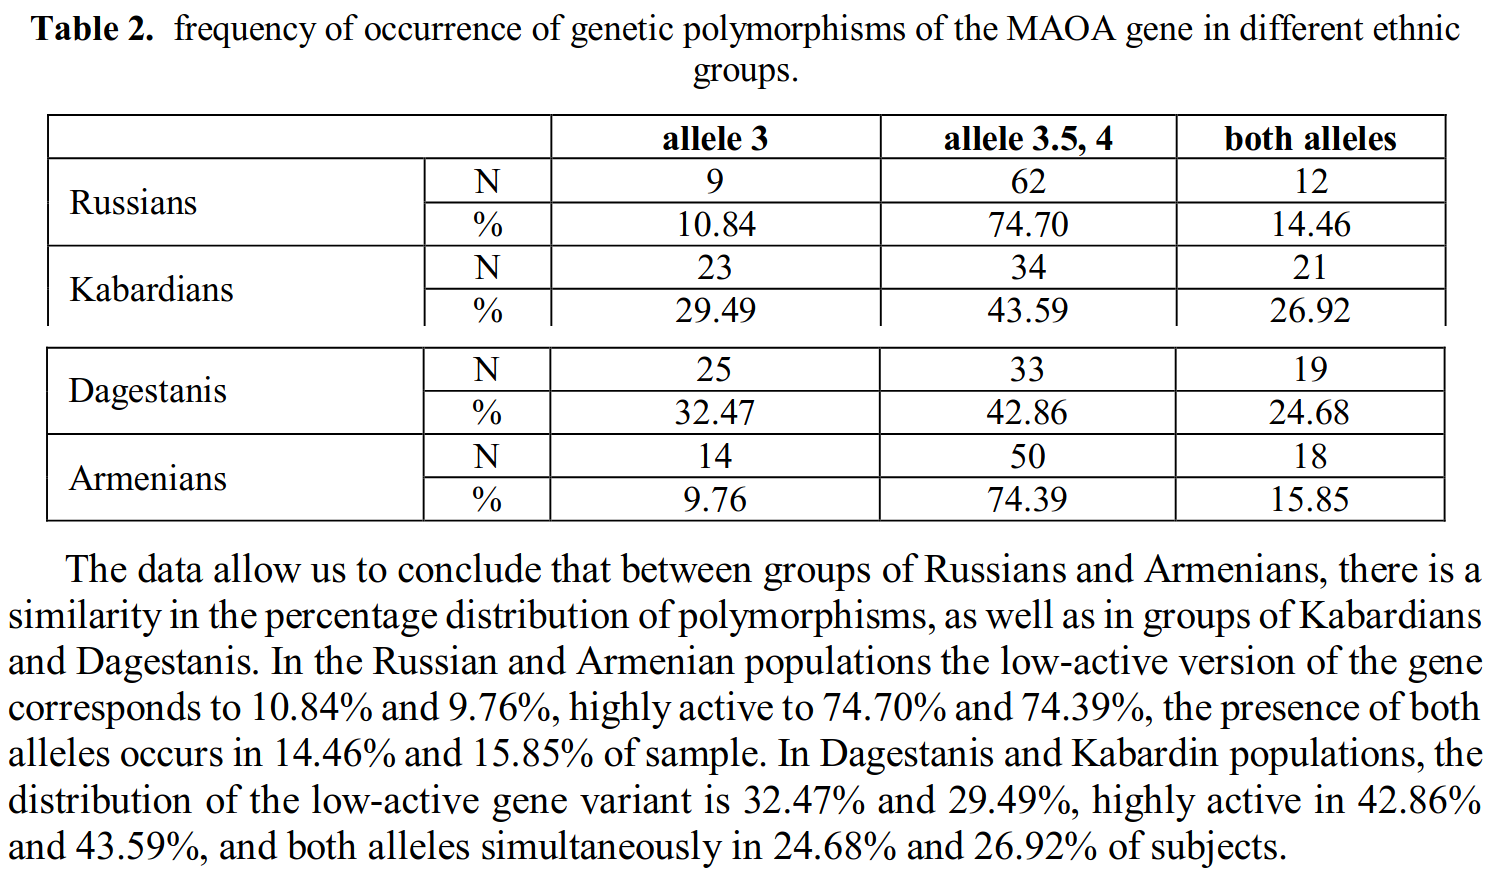
Dagestanis are the aggressive Muslims from the Caucus mountains that Putin uses as meat shields in the Ukraine war. I am not familiar with the Kabardians, but they are another ethnic group from nearby. The 3-R allele here is the one linked to aggression and it is more common in Dagestanis and Kabardians (about 30%) than in Russians and Armenians (about 10%).
Blogger Unsilenced Science has an old collection (2013) of studies showing the frequencies in different ethnic groups in the USA:
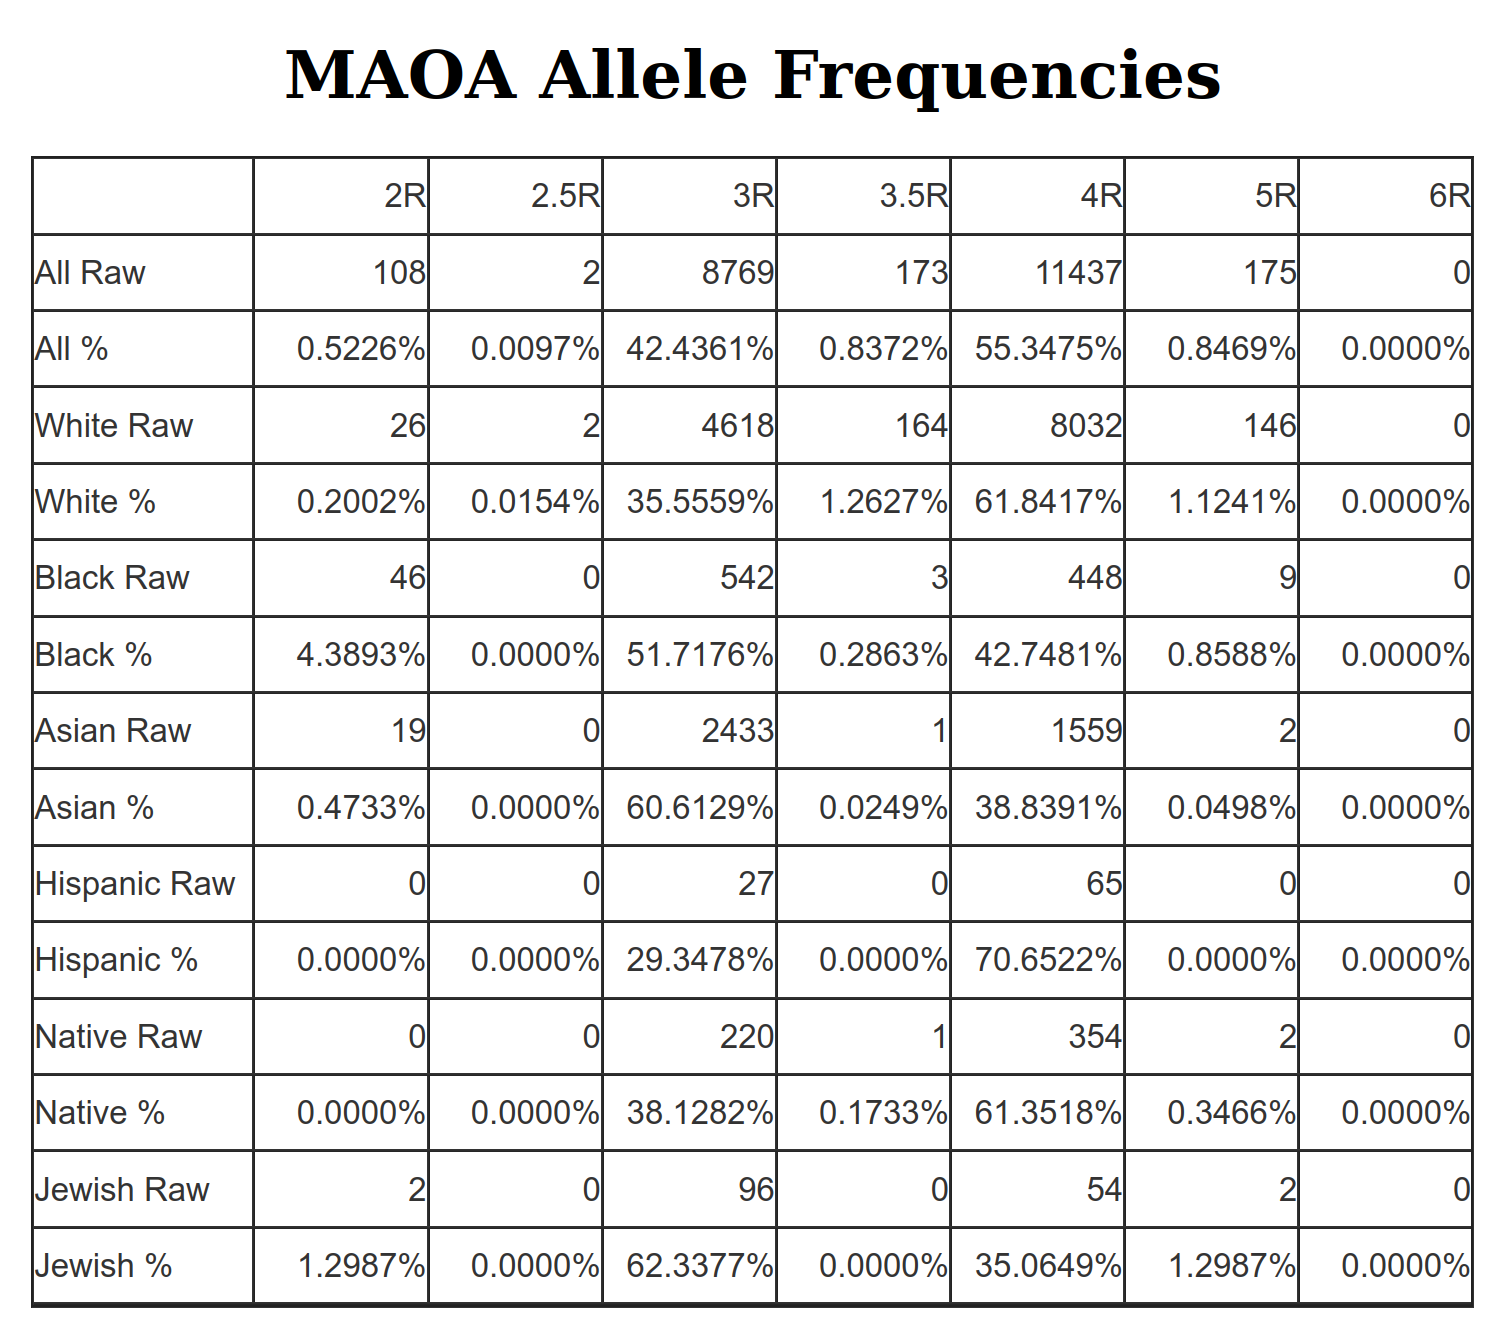
The sample sizes are not amazing, but we can focus on the most extreme variant, 2R (and 2.5, I think that means one copy of 2R and one of 3R). It has a frequency of about 4.4% in African Americans, and <1% in the other groups. Because it is so rare, it cannot really explain much of the ethnic gaps, but it does point in the same direction as the other evidence. I found a study of 300 Pakistanis finding a frequency of 1.4% for 2R, which is higher than the European rate of about 0.20%, but given this was only 4 people in their study, it’s inconclusive.
I note that the 3R allele is more common in Asians than the 4R compared to Europeans. This is contrary to expectations. The samples are too large for this to be a fluke.
2022 antisocial behavior GWAS
GWASs on violent crime and aggression are rare because this is a rarely measured phenotype in the typically medically oriented genetics datasets. However, in 2022 there was a GWAS of antisocial behavior:
Despite the substantial heritability of antisocial behavior (ASB), specific genetic variants robustly associated with the trait have not been identified. The present study by the Broad Antisocial Behavior Consortium (BroadABC) meta-analyzed data from 28 discovery samples (N = 85,359) and five independent replication samples (N = 8058) with genotypic data and broad measures of ASB. We identified the first significant genetic associations with broad ASB, involving common intronic variants in the forkhead box protein P2 (FOXP2) gene (lead SNP rs12536335, p = 6.32 × 10⁻¹⁰). Furthermore, we observed intronic variation in Foxp2 and one of its targets (Cntnap2) distinguishing a mouse model of pathological aggression (BALB/cJ strain) from controls (BALB/cByJ strain). Polygenic risk score (PRS) analyses in independent samples revealed that the genetic risk for ASB was associated with several antisocial outcomes across the lifespan, including diagnosis of conduct disorder, official criminal convictions, and trajectories of antisocial development. We found substantial genetic correlations of ASB with mental health (depression rg = 0.63, insomnia rg = 0.47), physical health (overweight rg = 0.19, waist-to-hip ratio rg = 0.32), smoking (rg = 0.54), cognitive ability (intelligence rg = −0.40), educational attainment (years of schooling rg = −0.46) and reproductive traits (age at first birth rg = −0.58, father’s age at death rg = −0.54). Our findings provide a starting point toward identifying critical biosocial risk mechanisms for the development of ASB.
The study only found a single variant that was above chance levels, so let’s look at that one on dbsnp:
If we read the supplement of the GWAS, we find that the aggression-linked allele is unclear:
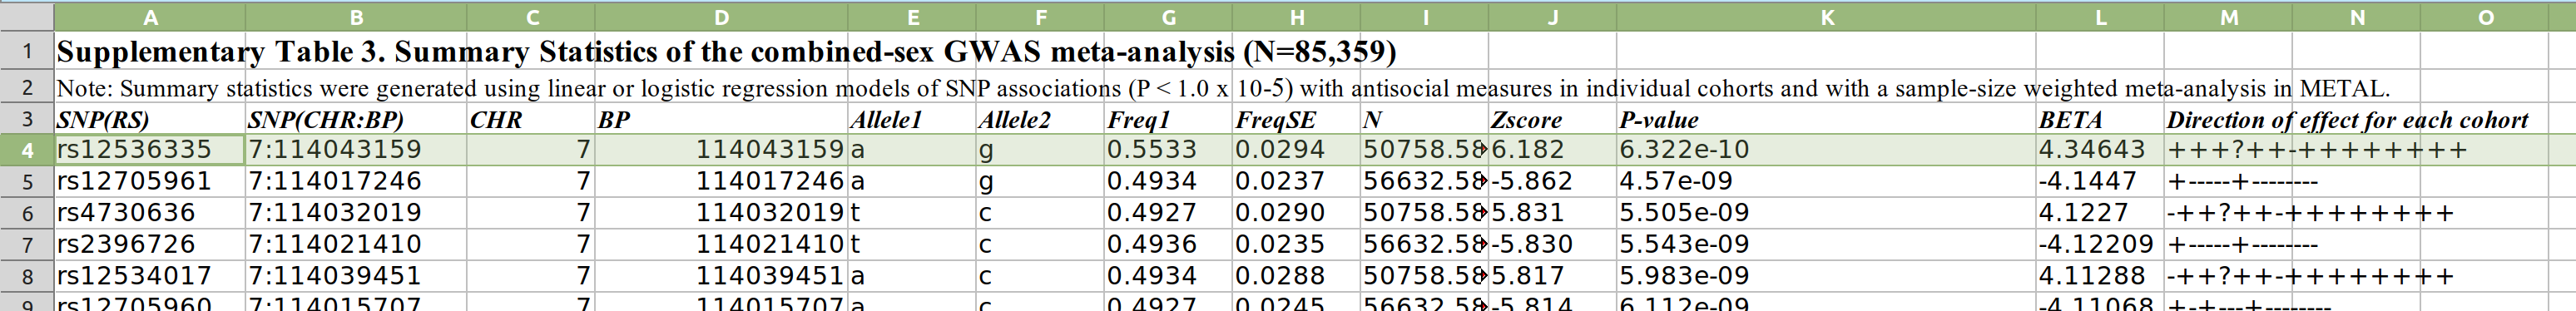
There’s 2 alleles, A and G, and the effect size is 4.35 (positive), but for A or G? Twitter poster Neil Hubert figured it out by looking up the variant a GWAS summary tool I was unfamiliar with. It shows:
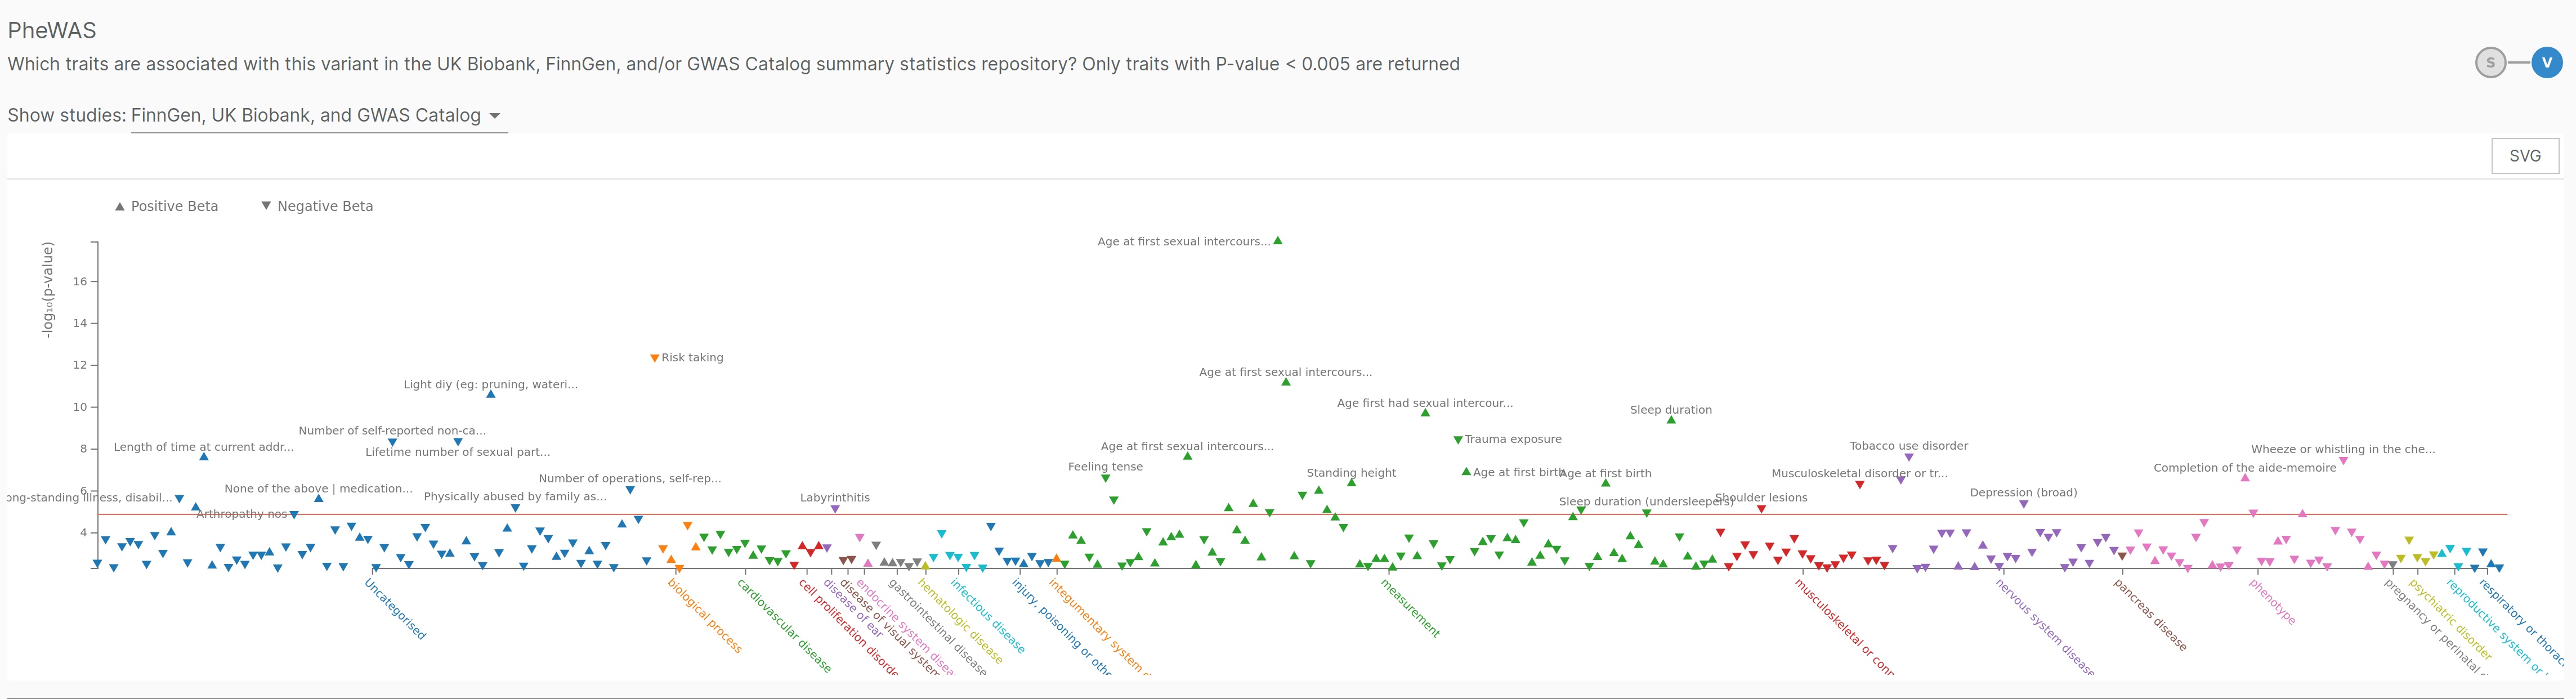
The effect allele here is G. Looking across the phenotypes, we see that G is negatively associated with risk taking, tobacco use, trauma, positively with age at first sexual intercourse, height etc., so G is the one with positive associations. Going back to the frequencies of the alleles in the table from dbsnp above, we see that the G variant is most common in East Asians, the least risk taking population, and it has the lowest frequency in Africans, the most risk-taking population. Things are yet again congruent.
Conclusions
- The ‘warrior gene’ MAOA variants do replicate in modern studies, and the violence-related 2R variant is more common in Africans (about 5%) than in Europeans (0.2%). However, the 3R variant is more common in Asians than Europeans, contrary to expectations.
- One SNP proxy (rs909525) for the MAOA shows the expected ethnic gaps, with the highest rate of the protective variant in the lowest aggression group (Asians), and lowest frequency in Africans.
- A 2022 GWAS of antisocial behavior found one reliable hit (rs12536335), which also shows the expected ethnic differentiation: protective variant highest in Asians and lowest in Africans.
- There is some direct genetic evidence for ethnic difference in aggression (crime, violence, antisocial behavior). It’s not conclusive, but it is not nothing either.