If you haven’t seen my new article about the new David Reich lab ancient genomes results in Aporia magazine yet, head over there now: Overwhelming evidence of recent evolution in West Eurasians.
There is a continuing debate in population genetics about the extent to which genetic prediction models (GWASs) trained on one population can make predictions that transfer to another population. Everybody agrees that there is some decline in predictive validity at the individual-level, which is to say that correlations between the genetic predictions (polygenic scores, PGS) and the phenotypes are weaker in out-of-population samples. This has mainly to do with differences in how the genetic variants across the genome correlate with each other (linkage disequilibrium differences, which affects the proxying of non-causal variants for causal ones across populations), rather than differences effect sizes of the causal variants or sneaky interactions (GxG or GxE). This effect is thus termed LD decay. It’s not really a new thing either because animal breeders have known about this for decades.
If the reason for the lower predictive validity in out-of-population samples is only random LD decay, then it follows that means of genetic scores for phenotypes are still unbiased provided the samples are large enough to estimate a mean from a weak signal (the weaker the signal in the noise, the larger the sample size needed). We wanted to test whether this prediction held up, so we looked around for a suitable dataset, and we found one:
- Piffer, D., & Kirkegaard, E. O. W. (2024). Predictive Accuracy of Polygenic Scores from European GWAS among Chinese Provinces. Mankind Quarterly, 65(1), 58–71. https://doi.org/10.46469/mq.2024.65.1.6
This study assesses the predictive accuracy of polygenic scores (PGS) from a variety of genome-wide association studies (GWAS) in a dataset of 28 Chinese provinces, with a focus on educational attainment (EA) and height. European-derived EA PGSs showed stronger correlations with average IQs of Chinese provinces (r = .52) than did East Asian-derived PGSs (r = .21), likely reflecting larger sample sizes. Both height PGSs derived from mixed ancestry and from European samples were positively correlated with average height (r = .71 and .68). Additionally, both genetic and phenotypic height showed positive correlations with latitude (r = .72 and .77, respectively), corroborating Bergmann’s rule and supporting the observation that northern Chinese tend to be taller. The PGS derived from within-family GWAS of height showed stronger correlation (r = .82) with phenotypic height and latitude than the between-family derived PGS. Whereas IQ PGS was positively correlated to latitude (r = .42), this was not the case for EA PGS. Negative correlations were also observed between schizophrenia PGS and both EA and IQ PGS (r = −.44 and −.50). Results from multiple regression analyses indicated that both genetic factors and environmental conditions (measured by HDI and infant mortality) influenced stature, with genetic factors having a stronger effect (∼ 0.8) compared to environmental conditions (∼ 0.22 to 0.45). Mediation analysis showed that the genetic effects of EA and IQ PGS on IQ are partially mediated through their effects on HDI and infant mortality. Applying Jensen’s method, we found that polygenic scores with a stronger genetic signal of selection exhibited slightly higher predictive accuracy (r = .25−0.27, p < .01). Keywords: Polygenic score, Education, Height, Intelligence, China
Let’s talk China. China is a massive country with a complex legal structure. However, at a first approximation there are 33 province-level divisions, which look like this:
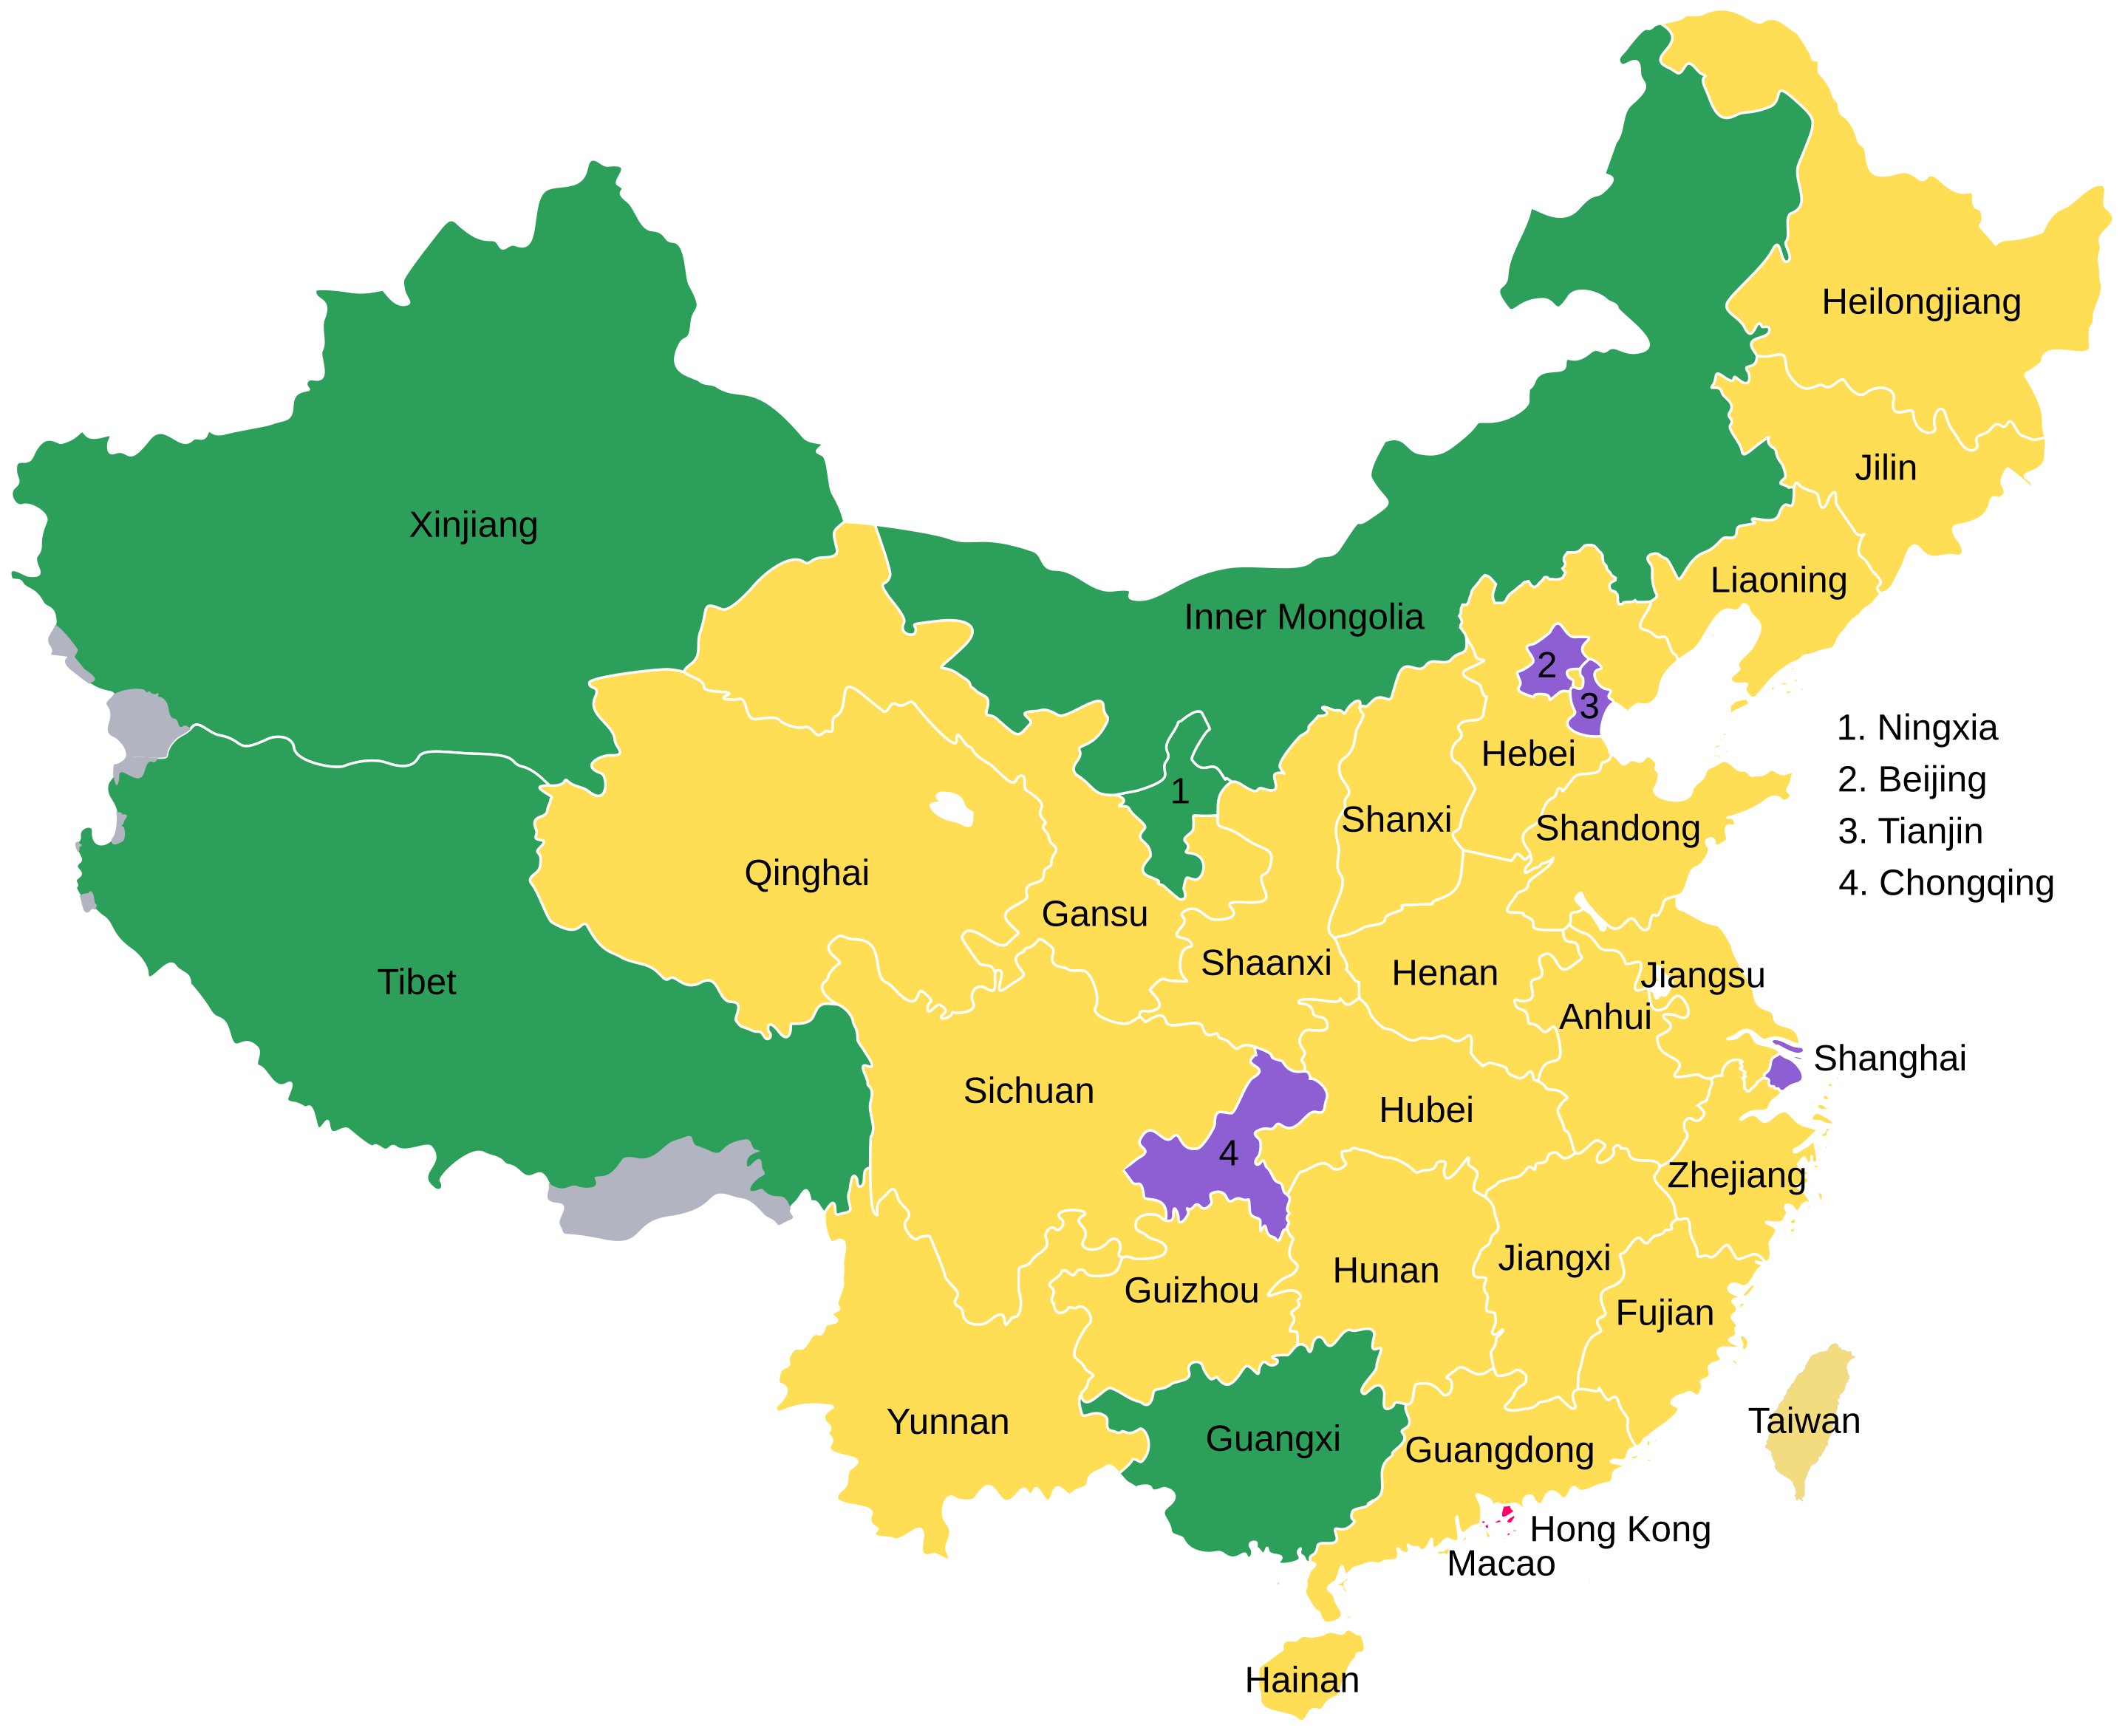
The ones in yellow are the ‘real’ provinces according to the Chinese communist party, hence why it includes Taiwan. The green ones are autonomous regions, and the purple ones are ‘city-states’, and the two tiny red ones are the former colonies turned special administrative zones (Hong Kong and Macao).
We weren’t able to find data for all of them, but we found data for 28 of them by scraping various websites concerning Chinese genomics. These do not provide any case-level data, but they do provide the frequencies of genetic variants for the 28 province-like units. By scraping the frequencies for all the variants in all the GWASs of interest, one can compute the average polygenic score for the phenotype for each unit.
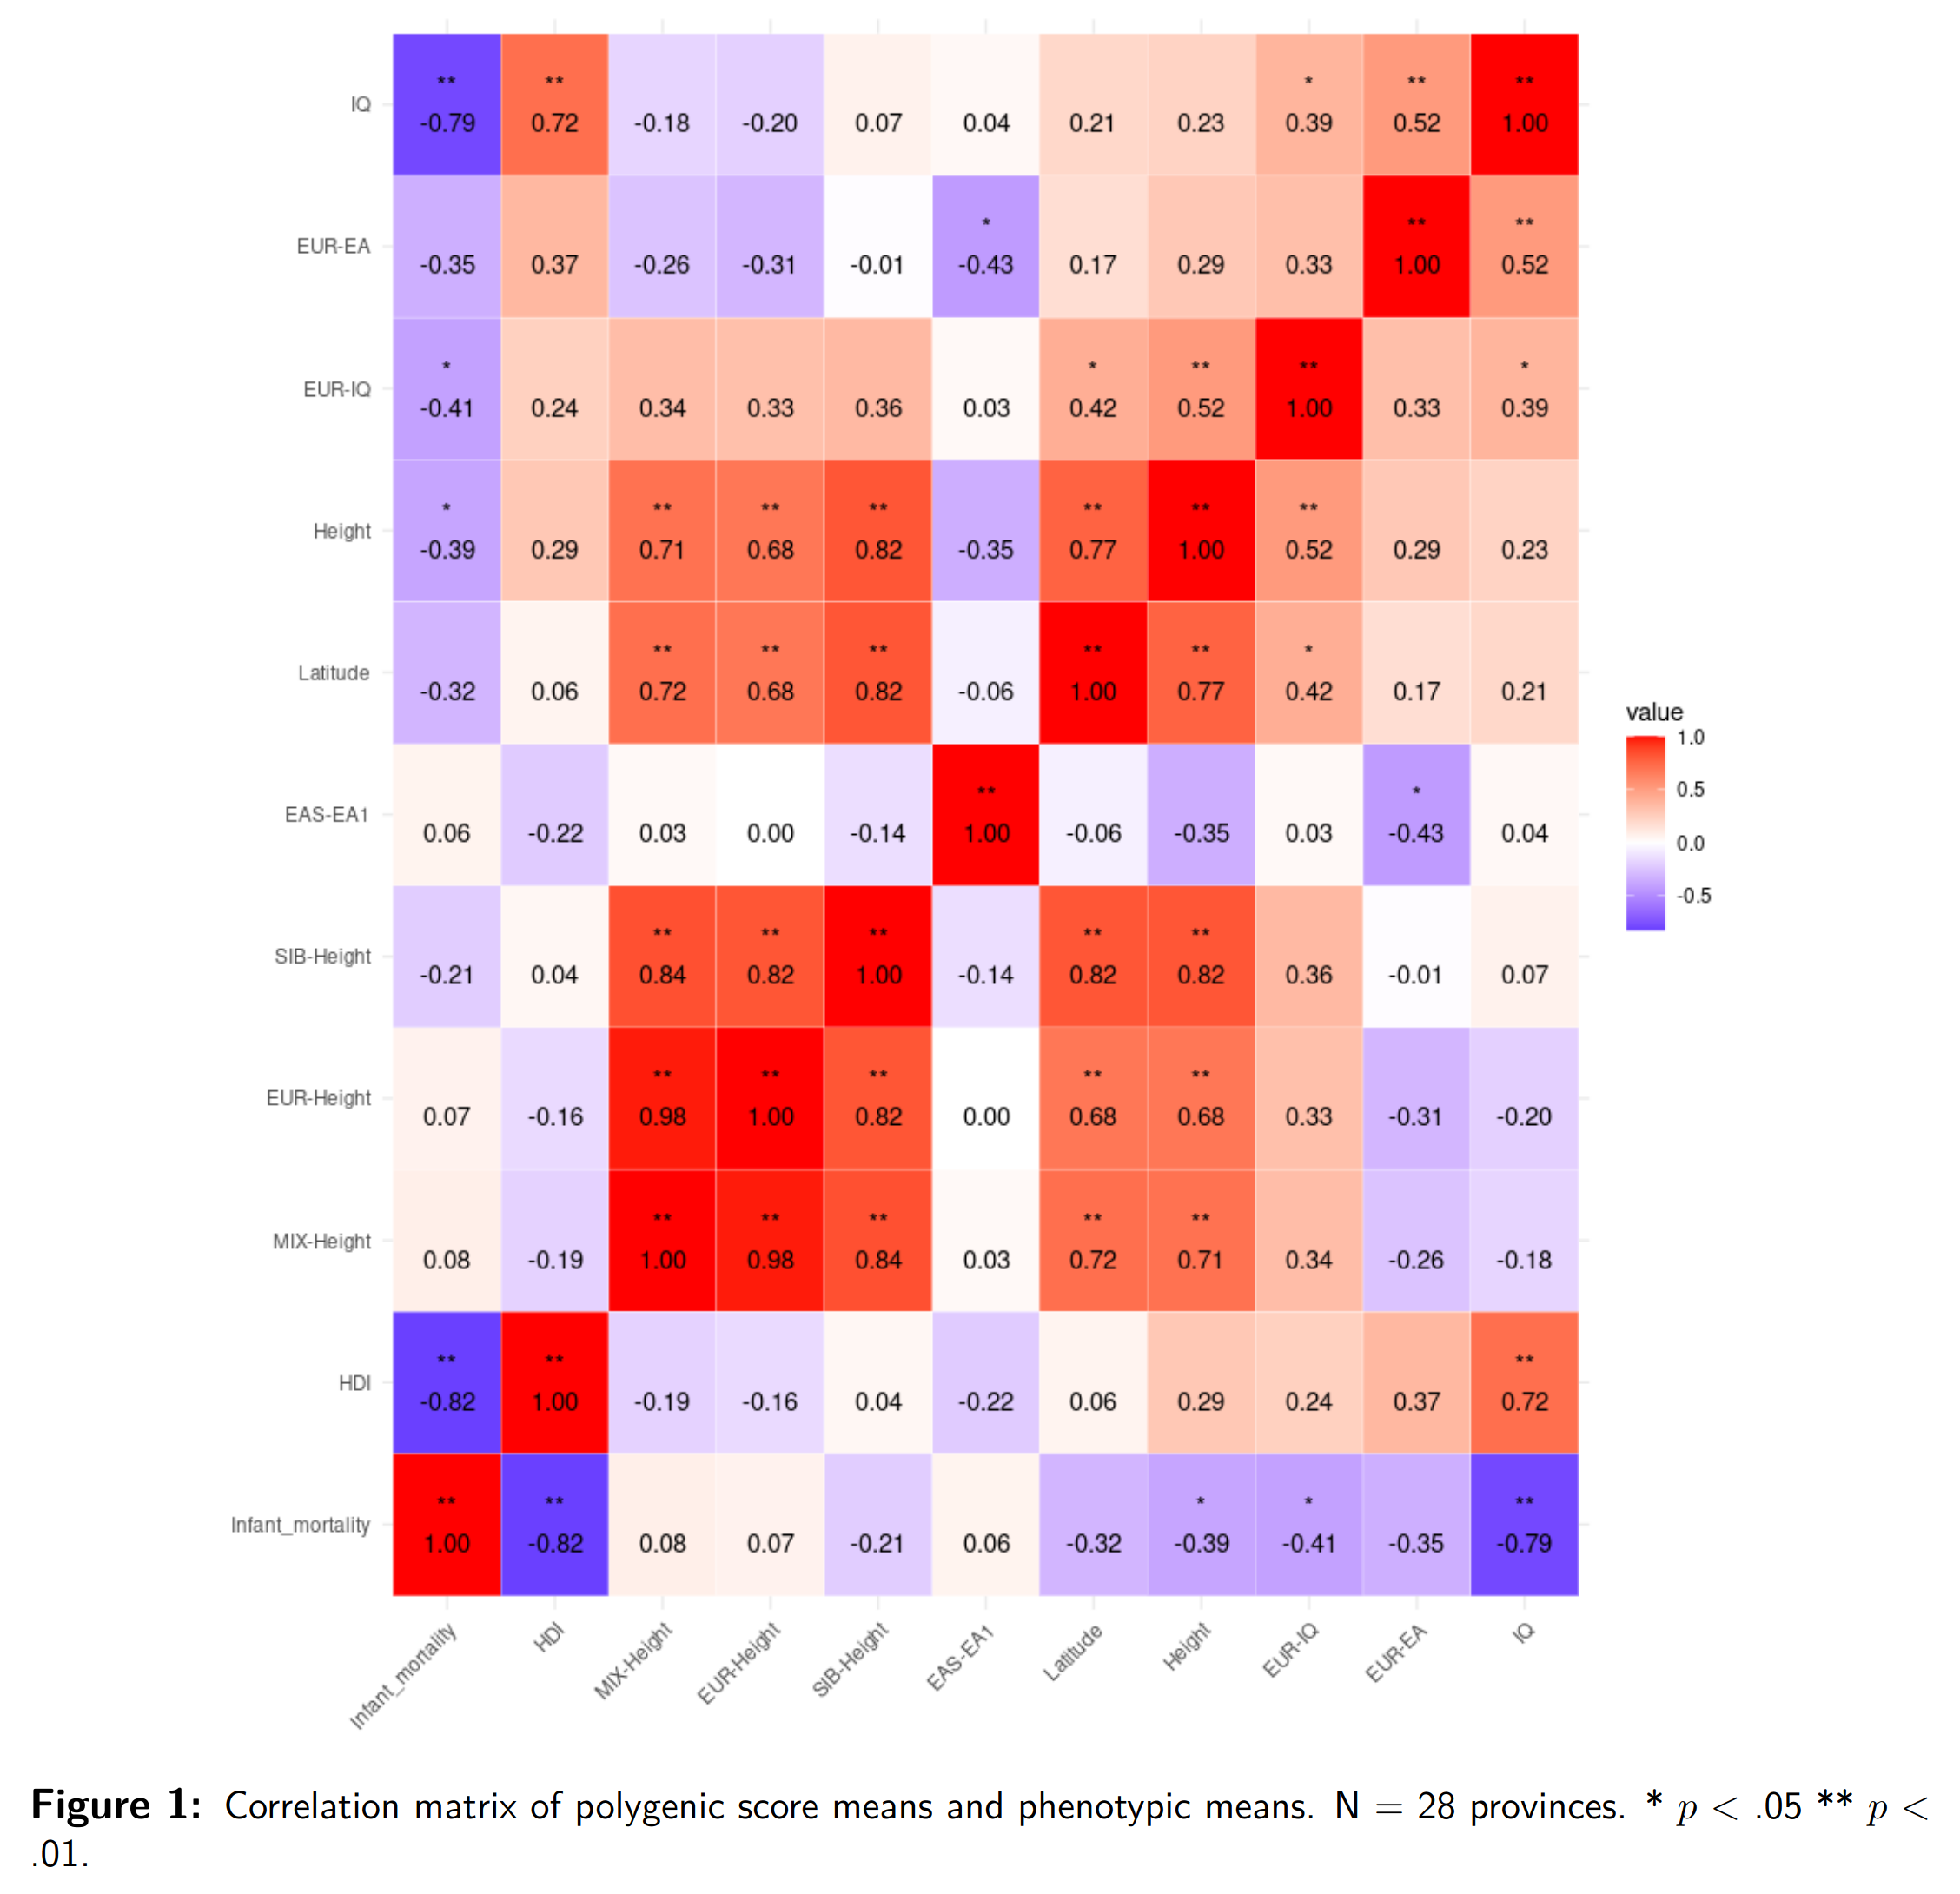
We focused on two phenotypes with the best data: intelligence/education and height. Height is a great phenotype because there are massive GWASs for it, and the data are easy to find, so it serves as the natural test case. For intelligence, we don’t have that good GWASs, but we have some OK ones for education. We have Chinese province-level data for height and intelligence from prior research to use here. Putting all of these together, we get this correlation matrix:
The variables are:
- EUR-EA: We computed PGS from the two largest GWAS of European ancestry (EA): (1) The European-based multi-trait analysis of genome-wide association summary statistics (years of education, cognitive performance, self-reported math ability, highest math class taken) using about 1.1 million individuals (Lee et al. 2018); (2) Another European-based GWAS which relied on the largest sample to date, about 3 million individuals (Okbay et al. 2022).
- EUR-IQ: Hill et al. (2019) conducted a genome-wide association study (GWAS) on intelligence with a sample of approximately 250,000 individuals of European descent. They expanded the initial sample to 250,000 by integrating education-related metrics (MTAG), identifying 564 SNPs after clumping and applying a significance threshold (p < 5 · 10-8, LD r2 < .1). Savage et al. (2018) studied a cohort of 270,000 individuals of European ancestry and found 286 SNPs that remained significant following similar clumping and thresholding procedures (p < 5 · 10-8, LD r2 < .1).
- EAS-EA1: The GWAS of educational attainment trained on East Asians relied on 180k samples from the Taiwan Biobank (TWB) (Feng et al. 2022) and Korean Genome and Epidemiology Study (KoGES) (Kim et al. 2017).
- MIX-Height: For height, we used the significant SNPs from the largest GWAS to date (Yengo et al. 2022), which comprised a multi-ancestry sample (after LD pruning with a threshold of r2 < .1). In addition, we computed the PGS based solely on the European-ancestry GWAS (EUR-Height).
- SIB-Height: Summary statistics for sibship (within-family) GWAS of height were retrieved from a recent meta-analysis of sibship GWAS (Howe et al. 2022). There were 290 SNPs that remained significant after clumping and applying a significance threshold (p < 5 · 10-8, LD r2 < .1).
- HDI: human development index
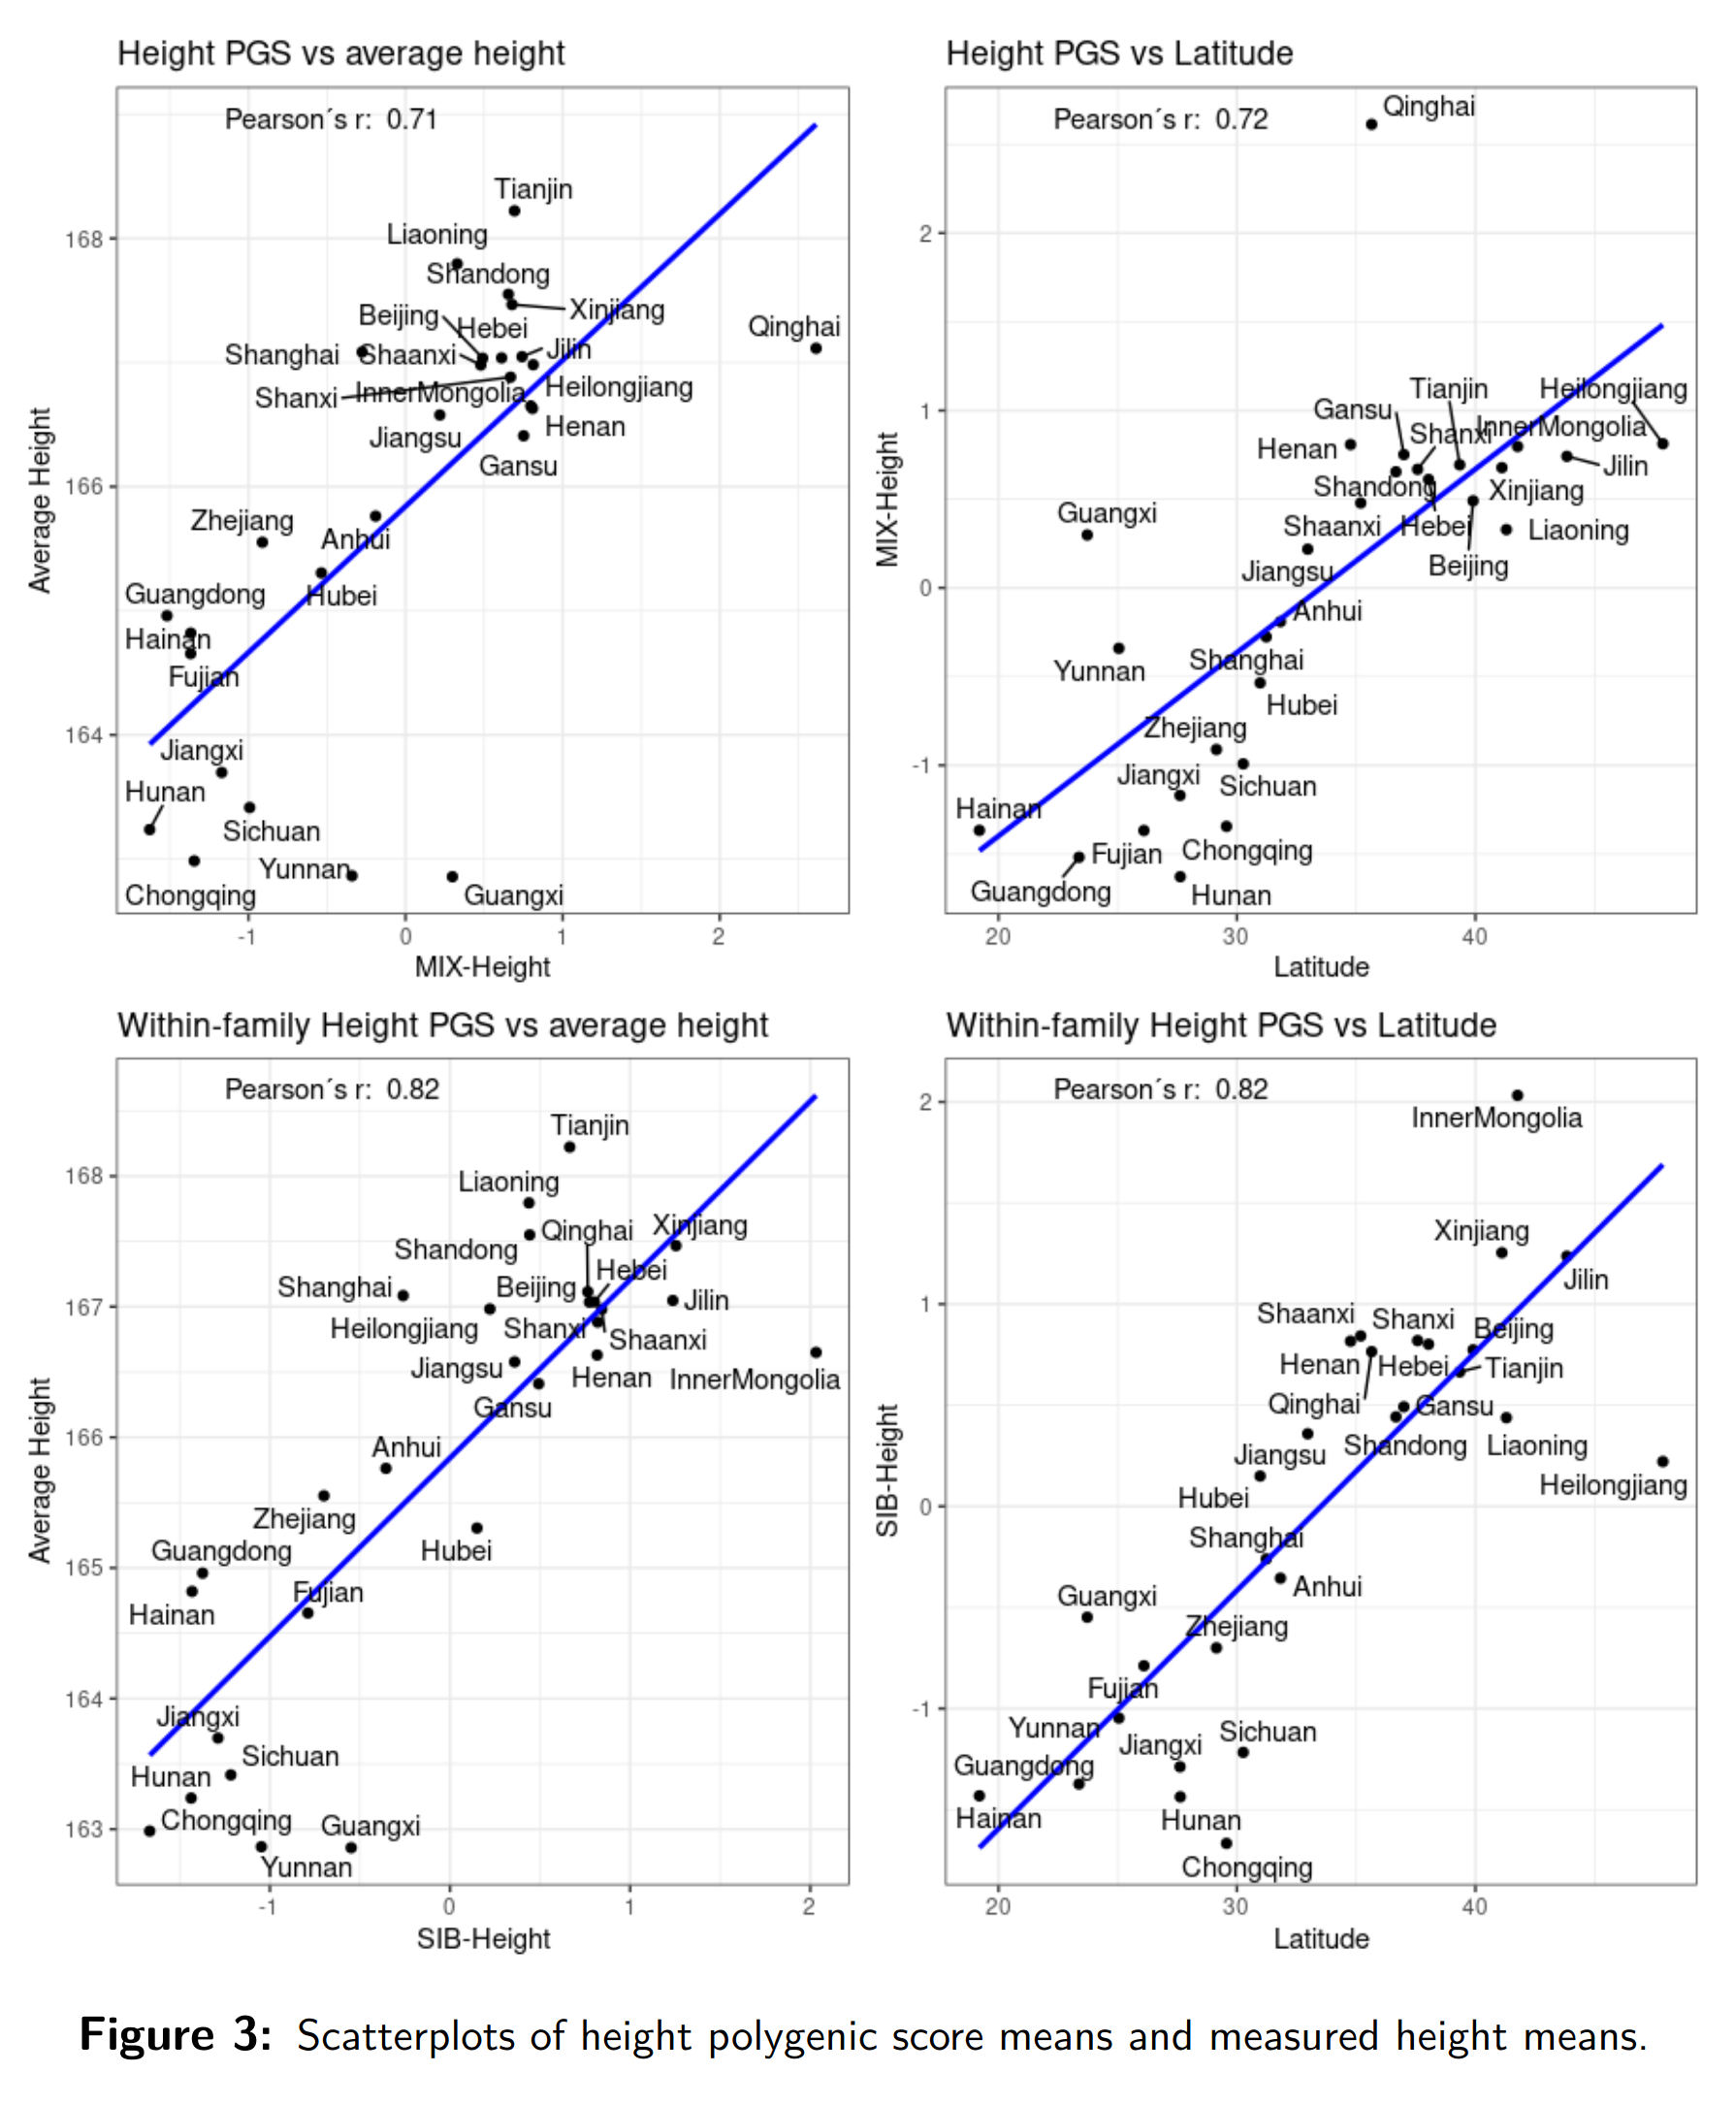
So we look to match up the relevant clusters of variables in the figure. Beginning with height, we see that no matter which genetic prediction model is used, the scores correlate well with actual height differences across China: r = 0.71 with the largest GWAS of height that used data from mixed ancestry groups, r = 0.68 from the same study but only using the Europeans, r = 0.82 from a much smaller European GWAS using only data from siblings. Despite the small sample (28 units), these are all p < .01. There is also a sizable correlation with latitude, per Bergmann’s rule.
For intelligence, we have a sizable correlation with the level of development 0.72, in line with results from other countries. We have a decent correlation with the European-trained (EA3/4) education polygenic scores r = 0.52 (p < .01), a slightly weaker one with the IQ equivalent r = 0.39 (p < .05), and no signal for the East Asian-trained education GWAS r = 0.04. Recall, the latter is a moderately weak GWAS with only 180k Koreans.
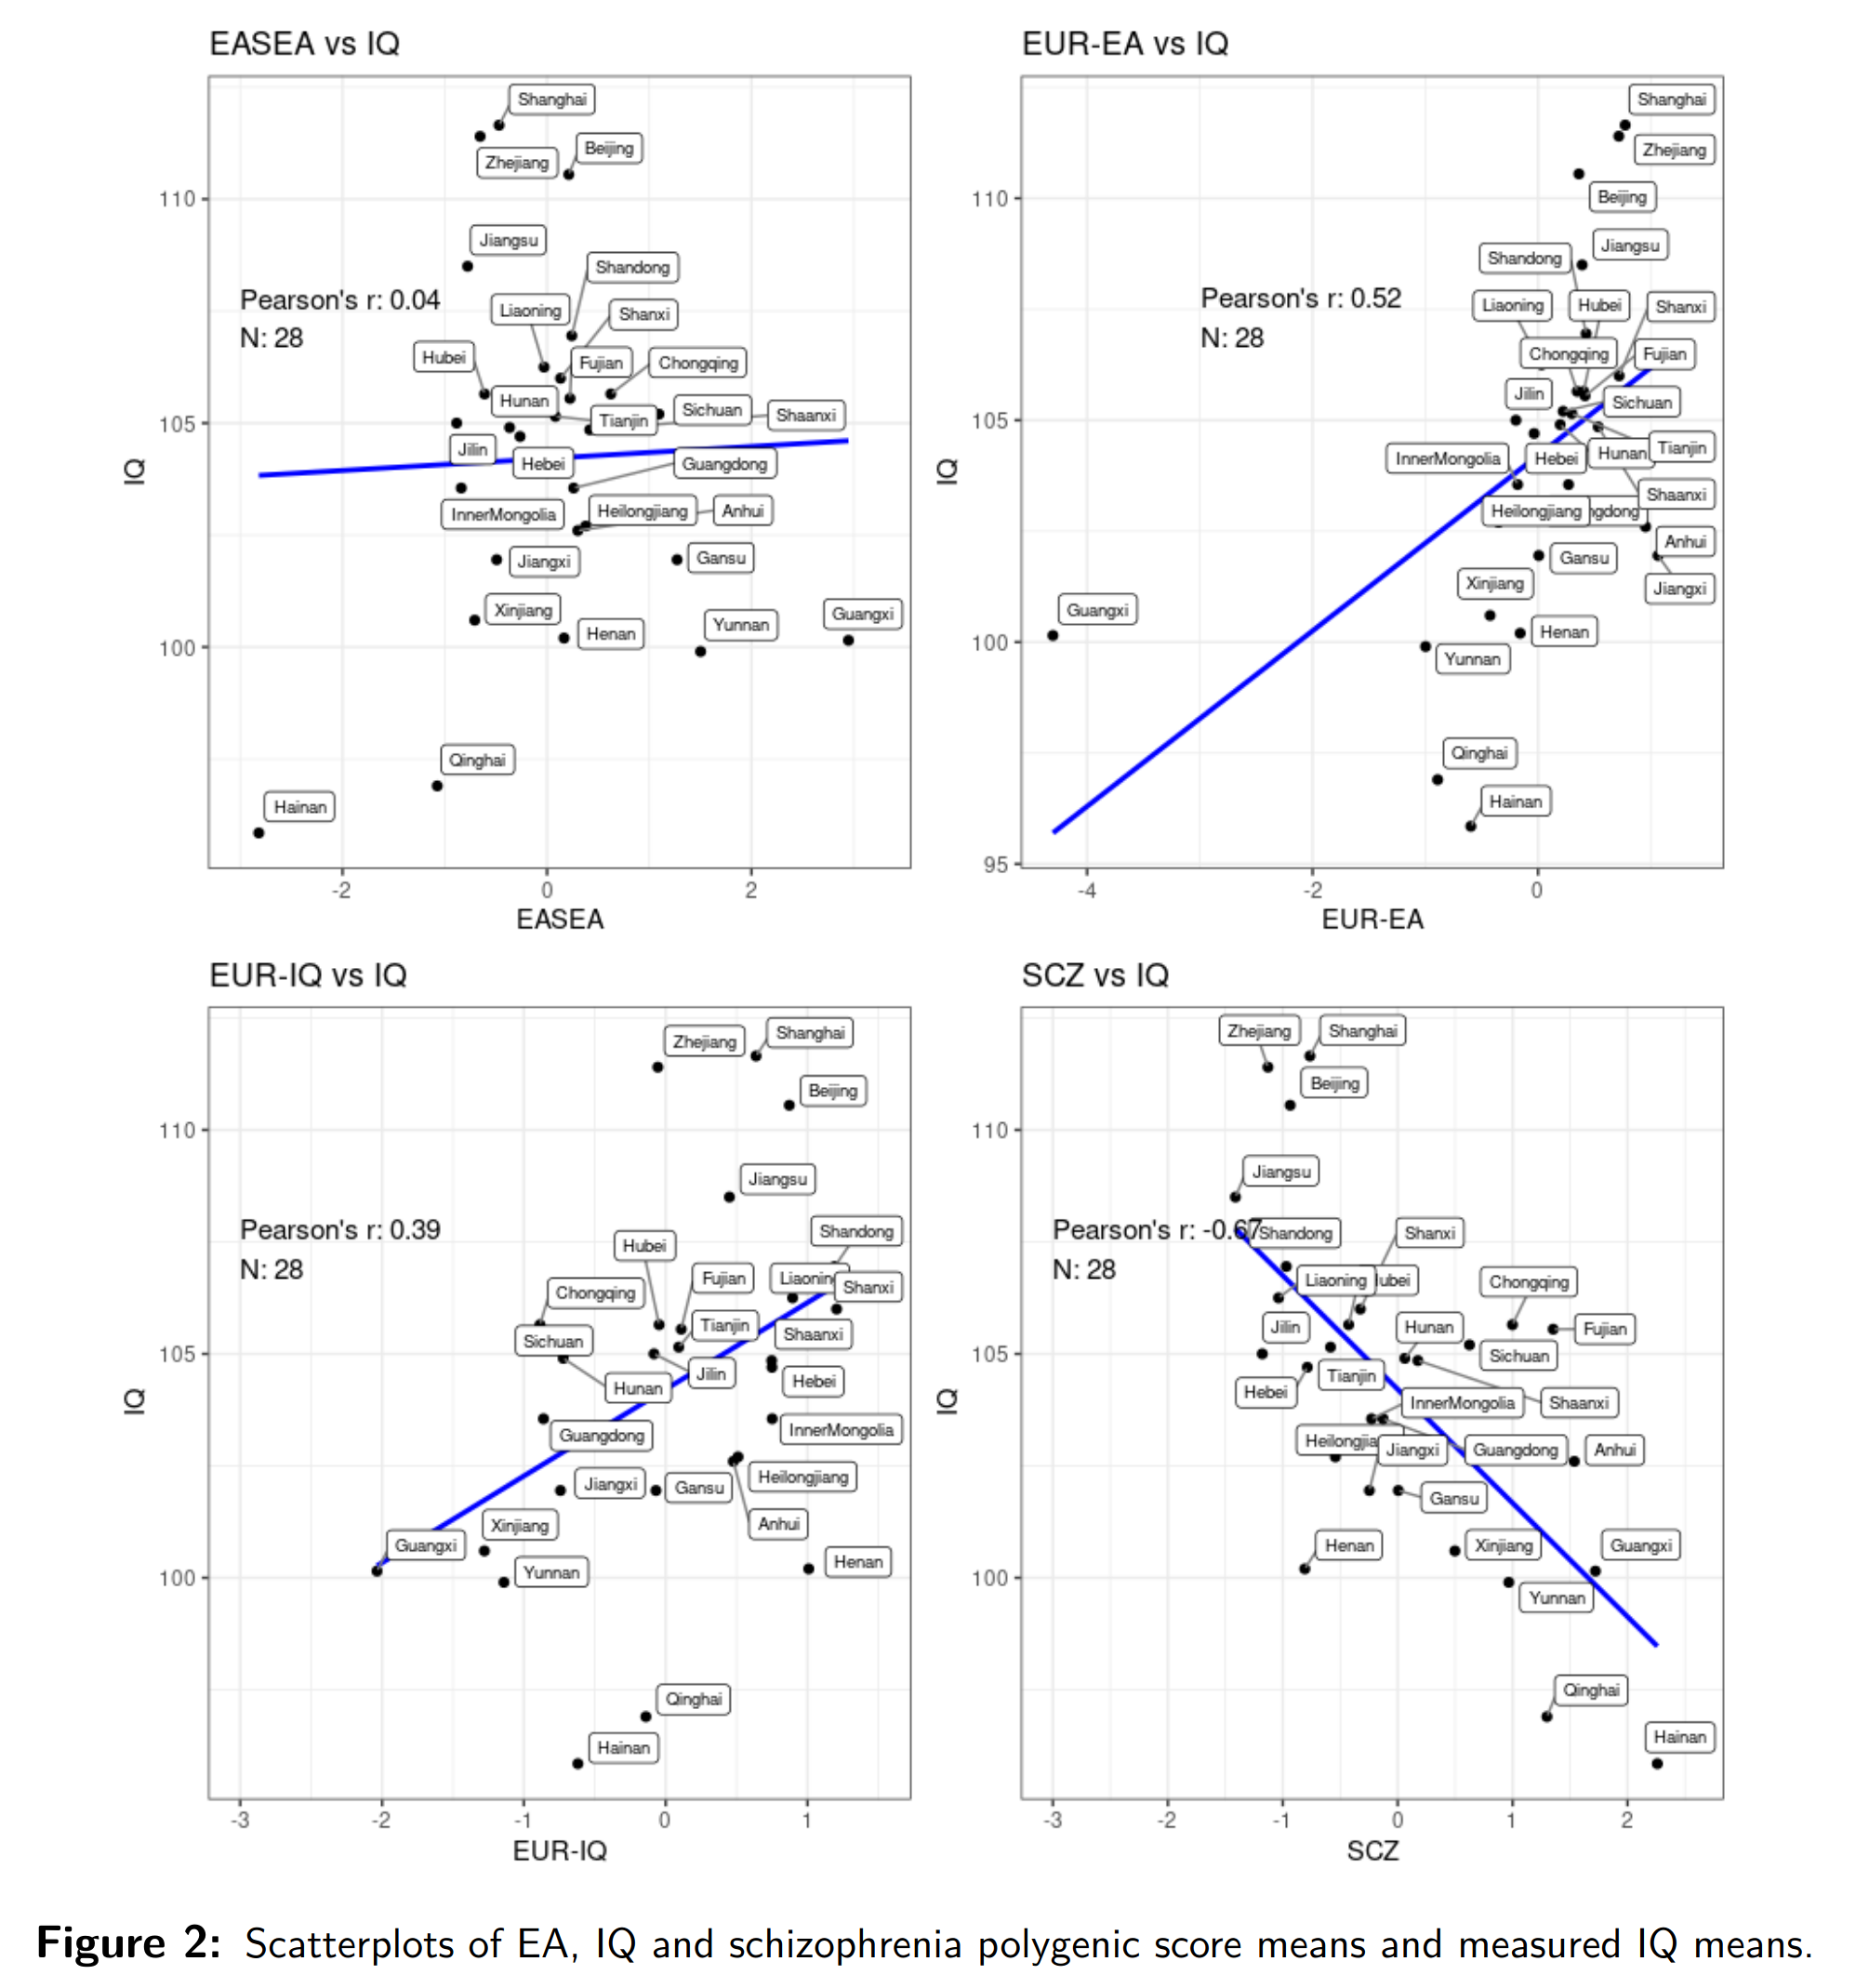
Schizophrenia was included because we found in prior research that across time and between groups, genetic scores for schizophrenia and intelligence/education correlate very strongly negatively, and we found the same thing here, even for measured intelligence. Schizophrenia does correlate negatively with intelligence within populations, but not that strongly, and there is no guarantee this correlation would work between time and place, but somehow it does. Interesting for further research.
Height is extremely heritable within a narrowly defined population, but shows large historical increases, presumably due to environmental improvements (less nutritional deficiency, fewer childhood diseases). For this reason, it may make sense to use both genetic height prediction and an environmental variable to predict height in a developing country like China, and we showed that this works well:
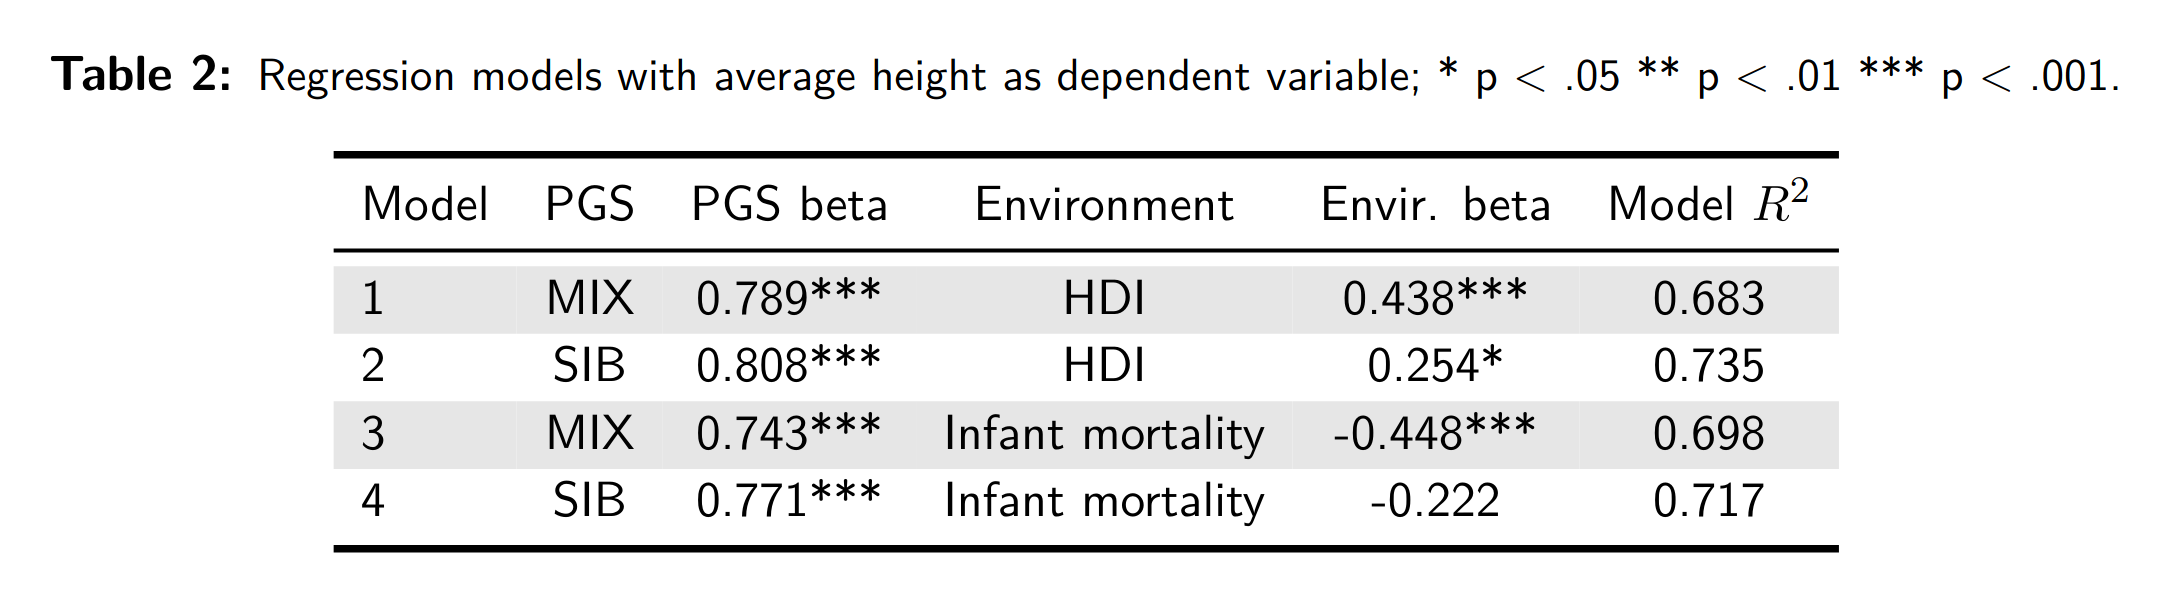
If anything, the genetic scores work even better when combined with an environmental variable (the standardized betas are slightly larger than the correlations).
Putting things in perspective
From the perspective of someone like Sasha Gusev who seems to think everything is a coincidence and nothing works, the findings are mysterious. Polygenic scores from models trained on mixed ancestry groups living in the West, or on Europeans living the West, or even on European sibling pairs, all show substantial correlations with actual height differences across provinces of China where there are no Europeans. Likewise, the real intelligence differences across Chinese provinces correlate with European-trained polygenic scores. Why do the scores keep working? Why are the means usually in the right order? He won’t say, can’t say.
To note, findings like these support hereditarianism from a Bayesian perspective because hereditarianism predicts these correlations we found, the more positive the better the models etc. Egalitarian models don’t predict anything in particular, having no core theory of human differences across time and place. One can dream up a non-genetic ad hoc model that is consistent with any set of facts and so doesn’t predict anything in particular. Sean Last provides a verbal, intuitive version of this reasoning, but I should write up a post with a numerical example. There is no real attempt by egalitarians to even to come up with a general framework. It is an environment of the gaps type reasoning, cope instead of science. Hereditarianism is a progressive research program in the Lakatosian sense, and egalitarianism is a degenerate one. This was even true 50 years ago:
- Urbach, P. (1974). Progress and degeneration in the ‘IQ Debate’(I). The British Journal for the Philosophy of Science, 25(2), 99-135.
- Urbach, P. (1974). Progress and degeneration in the ‘IQ debate’(II). The British Journal for the Philosophy of Science, 25(3), 235-259.