There’s a new kickass study based on Norwegian register data:
- Bratsberg, B., Fjell, A. M. M., Rogeberg, O. J., Skirbekk, V. F., & Walhovd, K. B. (2024). Differences in early life cognitive function explain the association between low education and early dementia risk. medRxiv, 2024-06.
Major initiatives are currently attempting to prevent dementia by targeting modifiable risk factors. Low education is frequently pointed to as a potential key factor, due to its robust relationship with dementia risk. Impact of education is notoriously difficult to assess, however, because of associations with multiple other risk and protective factors, and large population-representative samples are required to tease the relationships apart. Here, we studied 207,814 Norwegian men born between 1950 and 1959 who underwent compulsory cognitive testing during military conscription as young adults, to systematically test associations of education, cognition, and other potentially important factors. While low education was associated with increased risk for dementia diagnosis (Hazard ratio [HR] = 1.37, CI: 1.17-1.60), this association was fully explained by earlier cognitive test scores (HR = 1.08, CI: .91-1.28). In contrast, low cognitive score was associated with double risk of later dementia diagnosis, even when taking education into account (HR = 2.00, CI: 1.65-2.42). This relationship survived controlling for early-life socioeconomic status and was replicated within pairs of brothers. The latter finding suggests that genetic and environmental factors shared within families, such as common genetics, parental education, childhood socioeconomic status, or other shared experiences, cannot account for the association. Rather, independent, non-familial factors are more important. In contrast, within-family factors accounted for the relationship between low education and diagnosis risk. In conclusion, implementing measures to increase cognitive function in childhood and adolescence appears to be a more promising strategy for reducing dementia burden.
They used the Norwegian army qualifications test (ASVAB equivalent) which they describe as “The stanine test score aggregate results across three speeded tests of arithmetic (30 items), word similarities (54 items), and “Raven-like” figures (36 items).”. The scores were approximately normal:
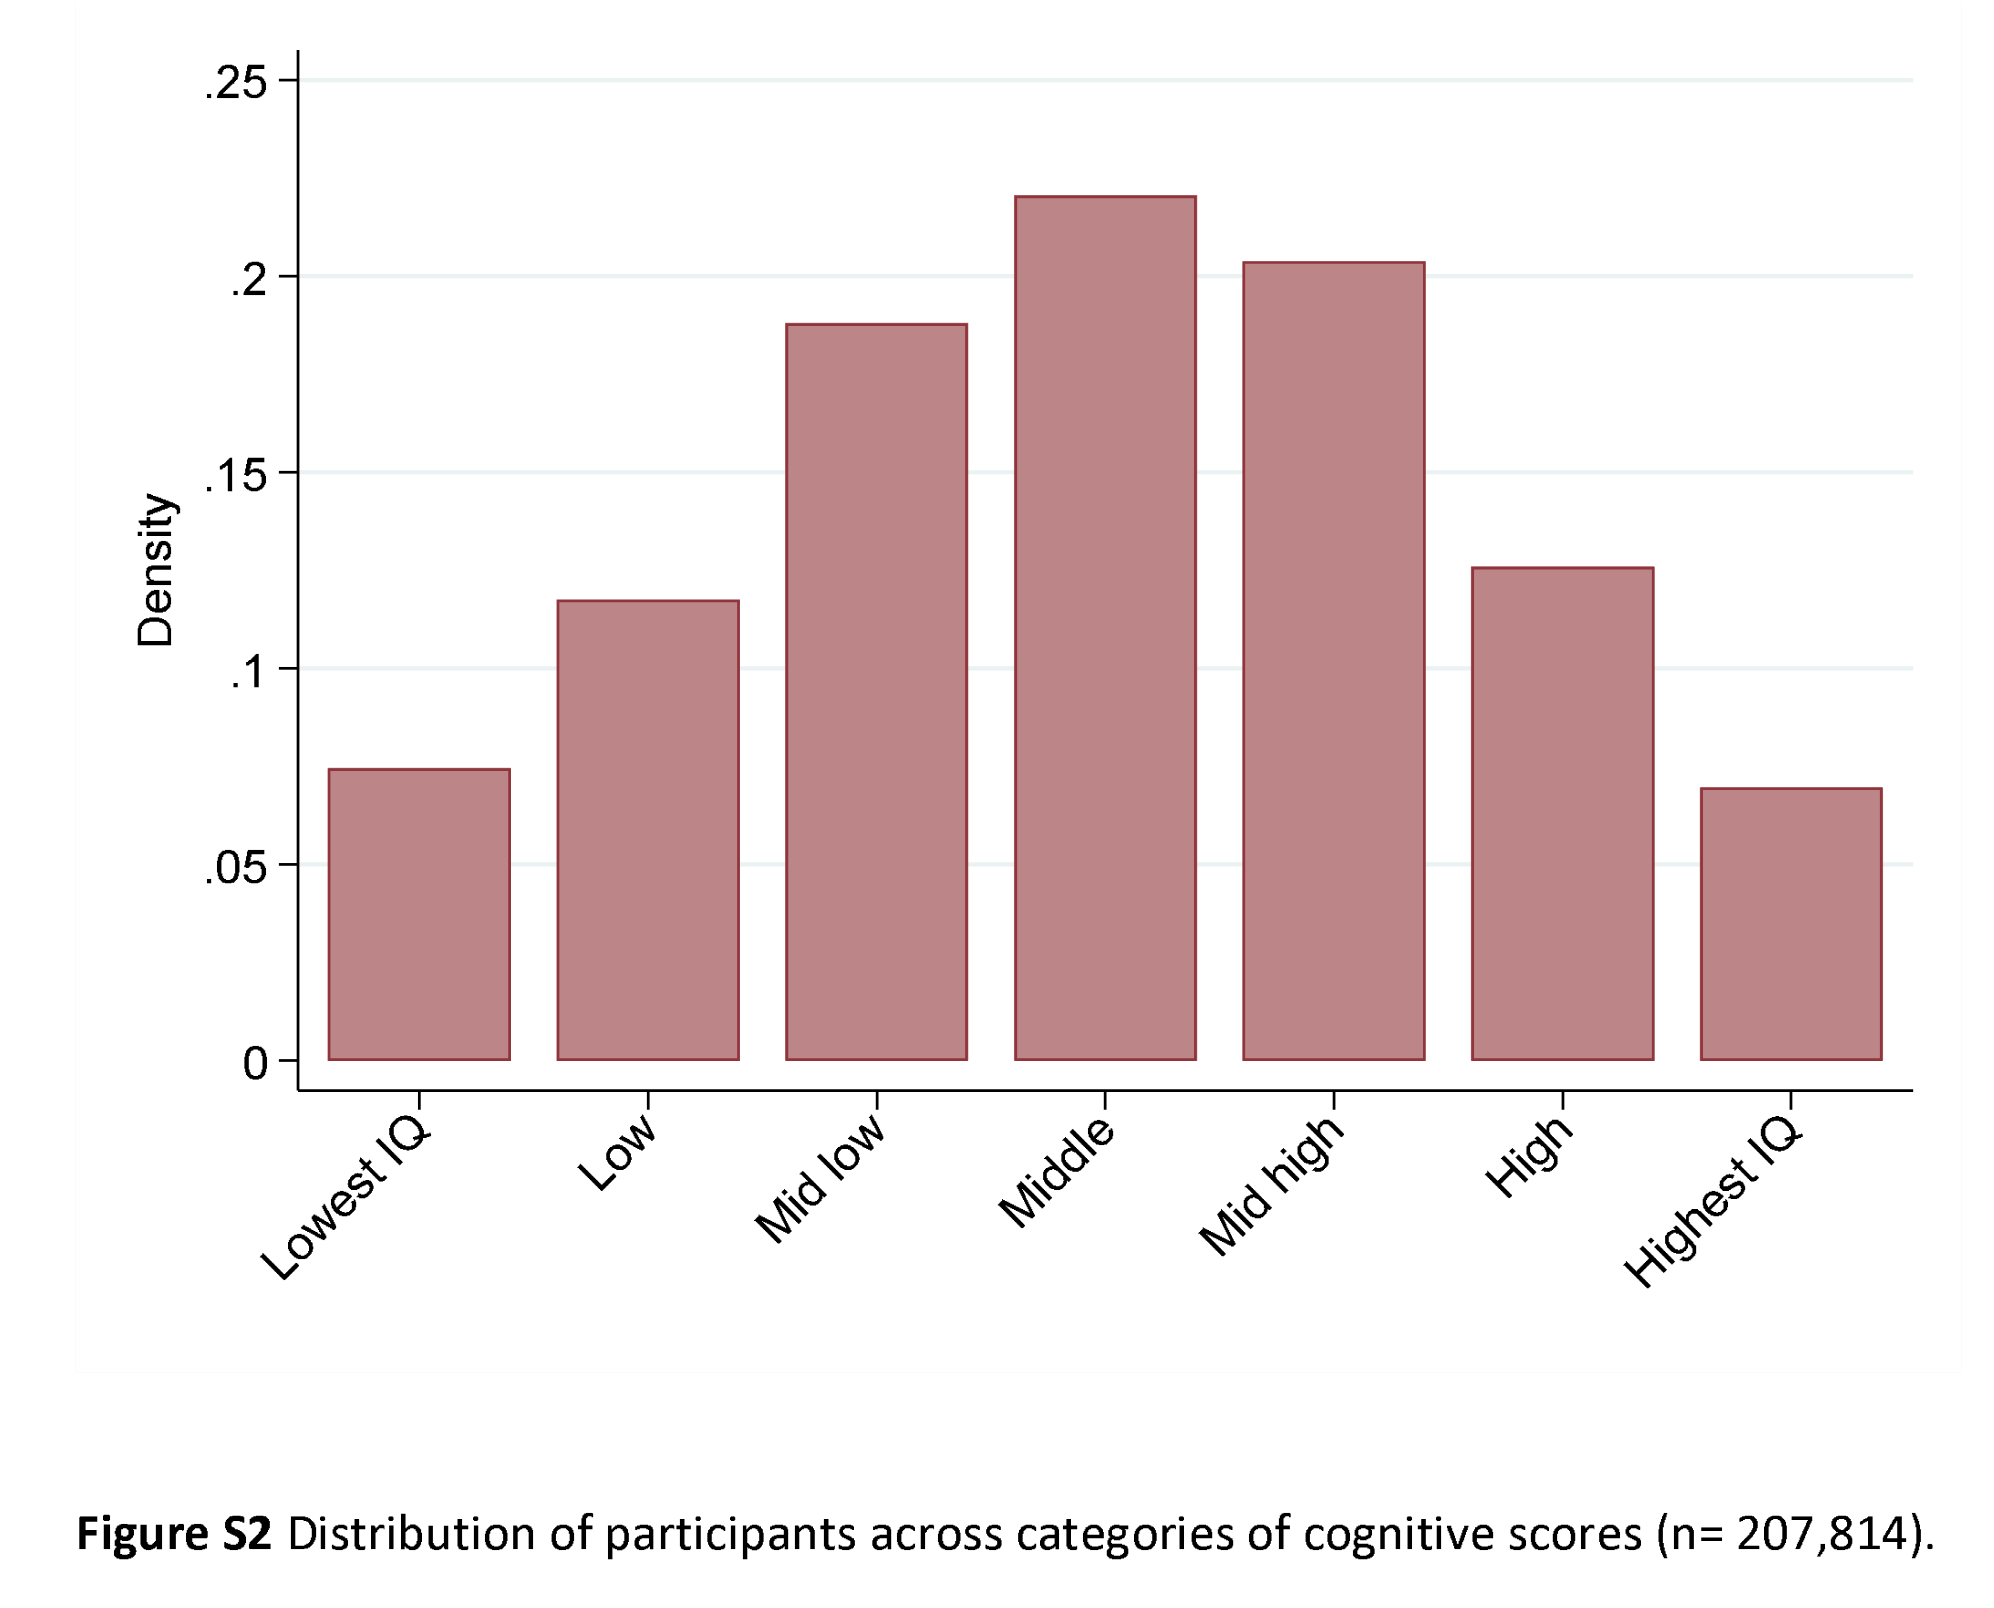
They call it a “stanine”, but there are 7 categories, and hey unhelpfully do not provide IQ equivalents. Since we know their proportions, we can roughly work out the ranges and means inside each group so we can use that to aid our understanding. I did this by simulating a large normally distributed IQ dataset (mean 100, standard deviation 15) and then made thresholds for the groups so as to match the proportions from their table. With these results, their groups correspond approximately to:
- Lowest: mean IQ 72, range < 78
- Low: mean IQ 83, range 78-87
- Mid low: mean IQ 91, range 87-95
- Middle: mean IQ 100, range 95-104
- Mid high: mean IQ 108, range 104-113
- High: mean IQ, range 113-122
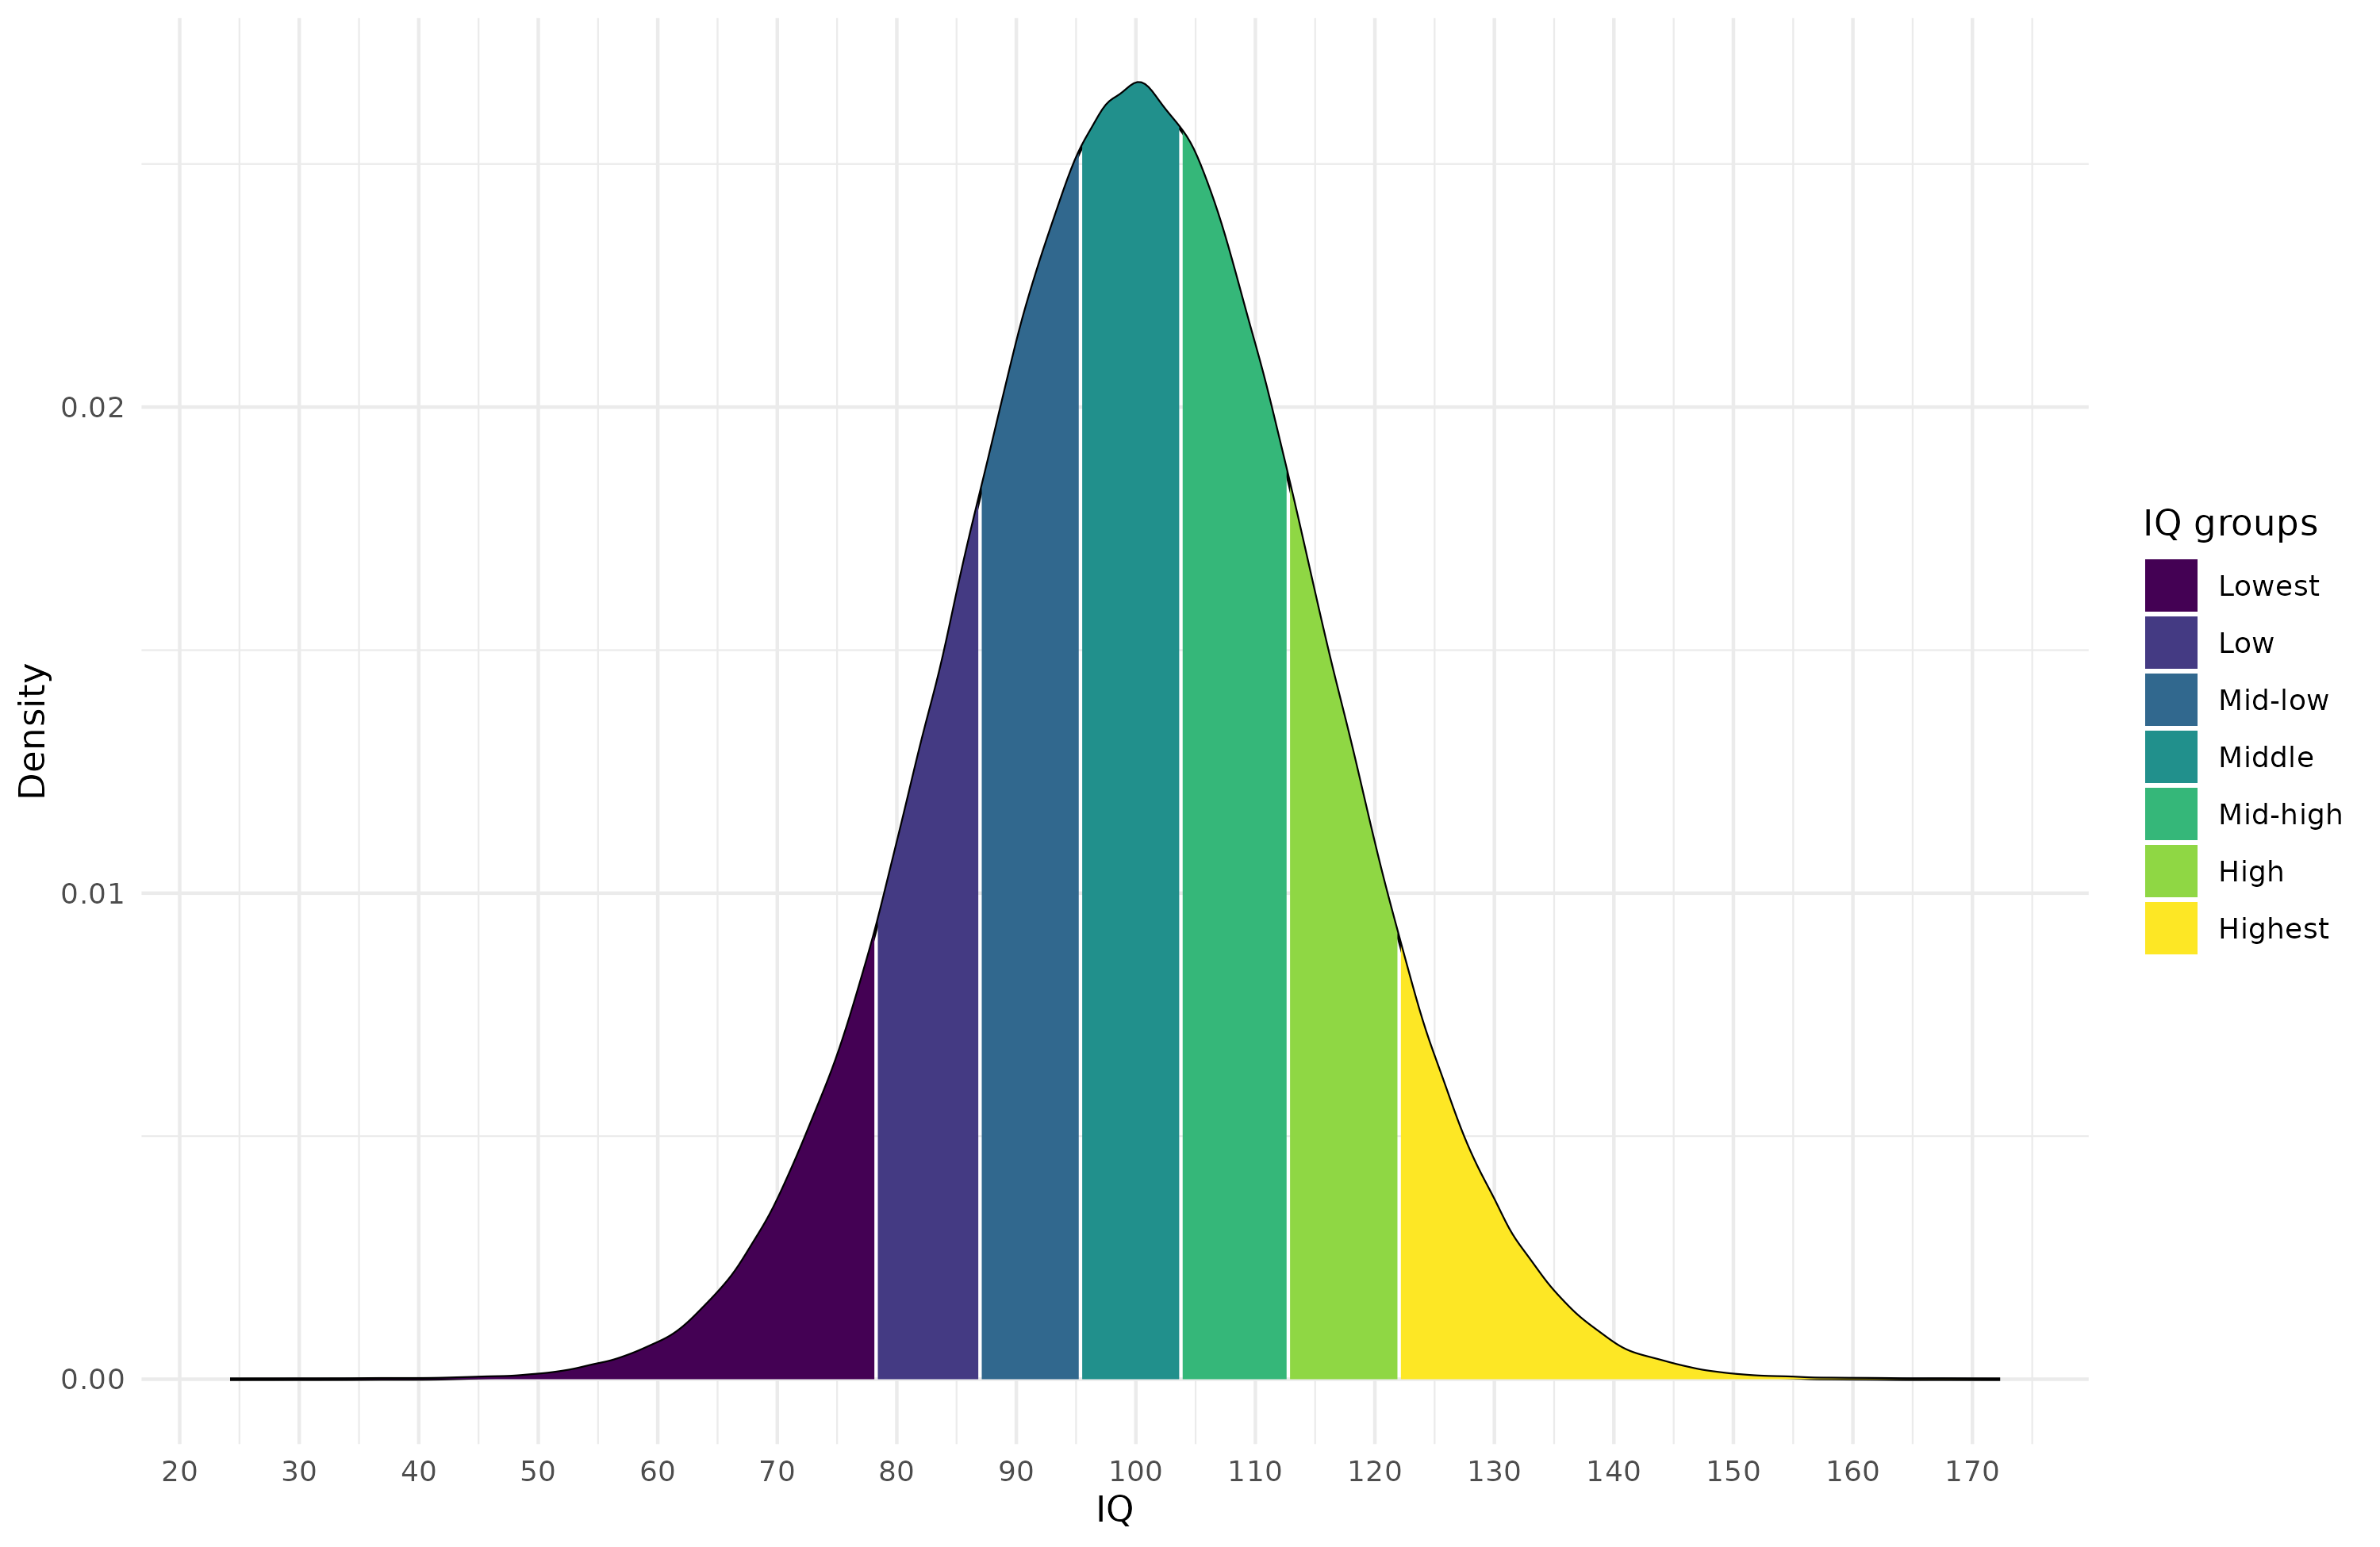
- Highest, mean IQ 129, range > 122
It looks like this:
They nicely provide us with a general set of social metrics for these groups, very similar to The Bell Curve:
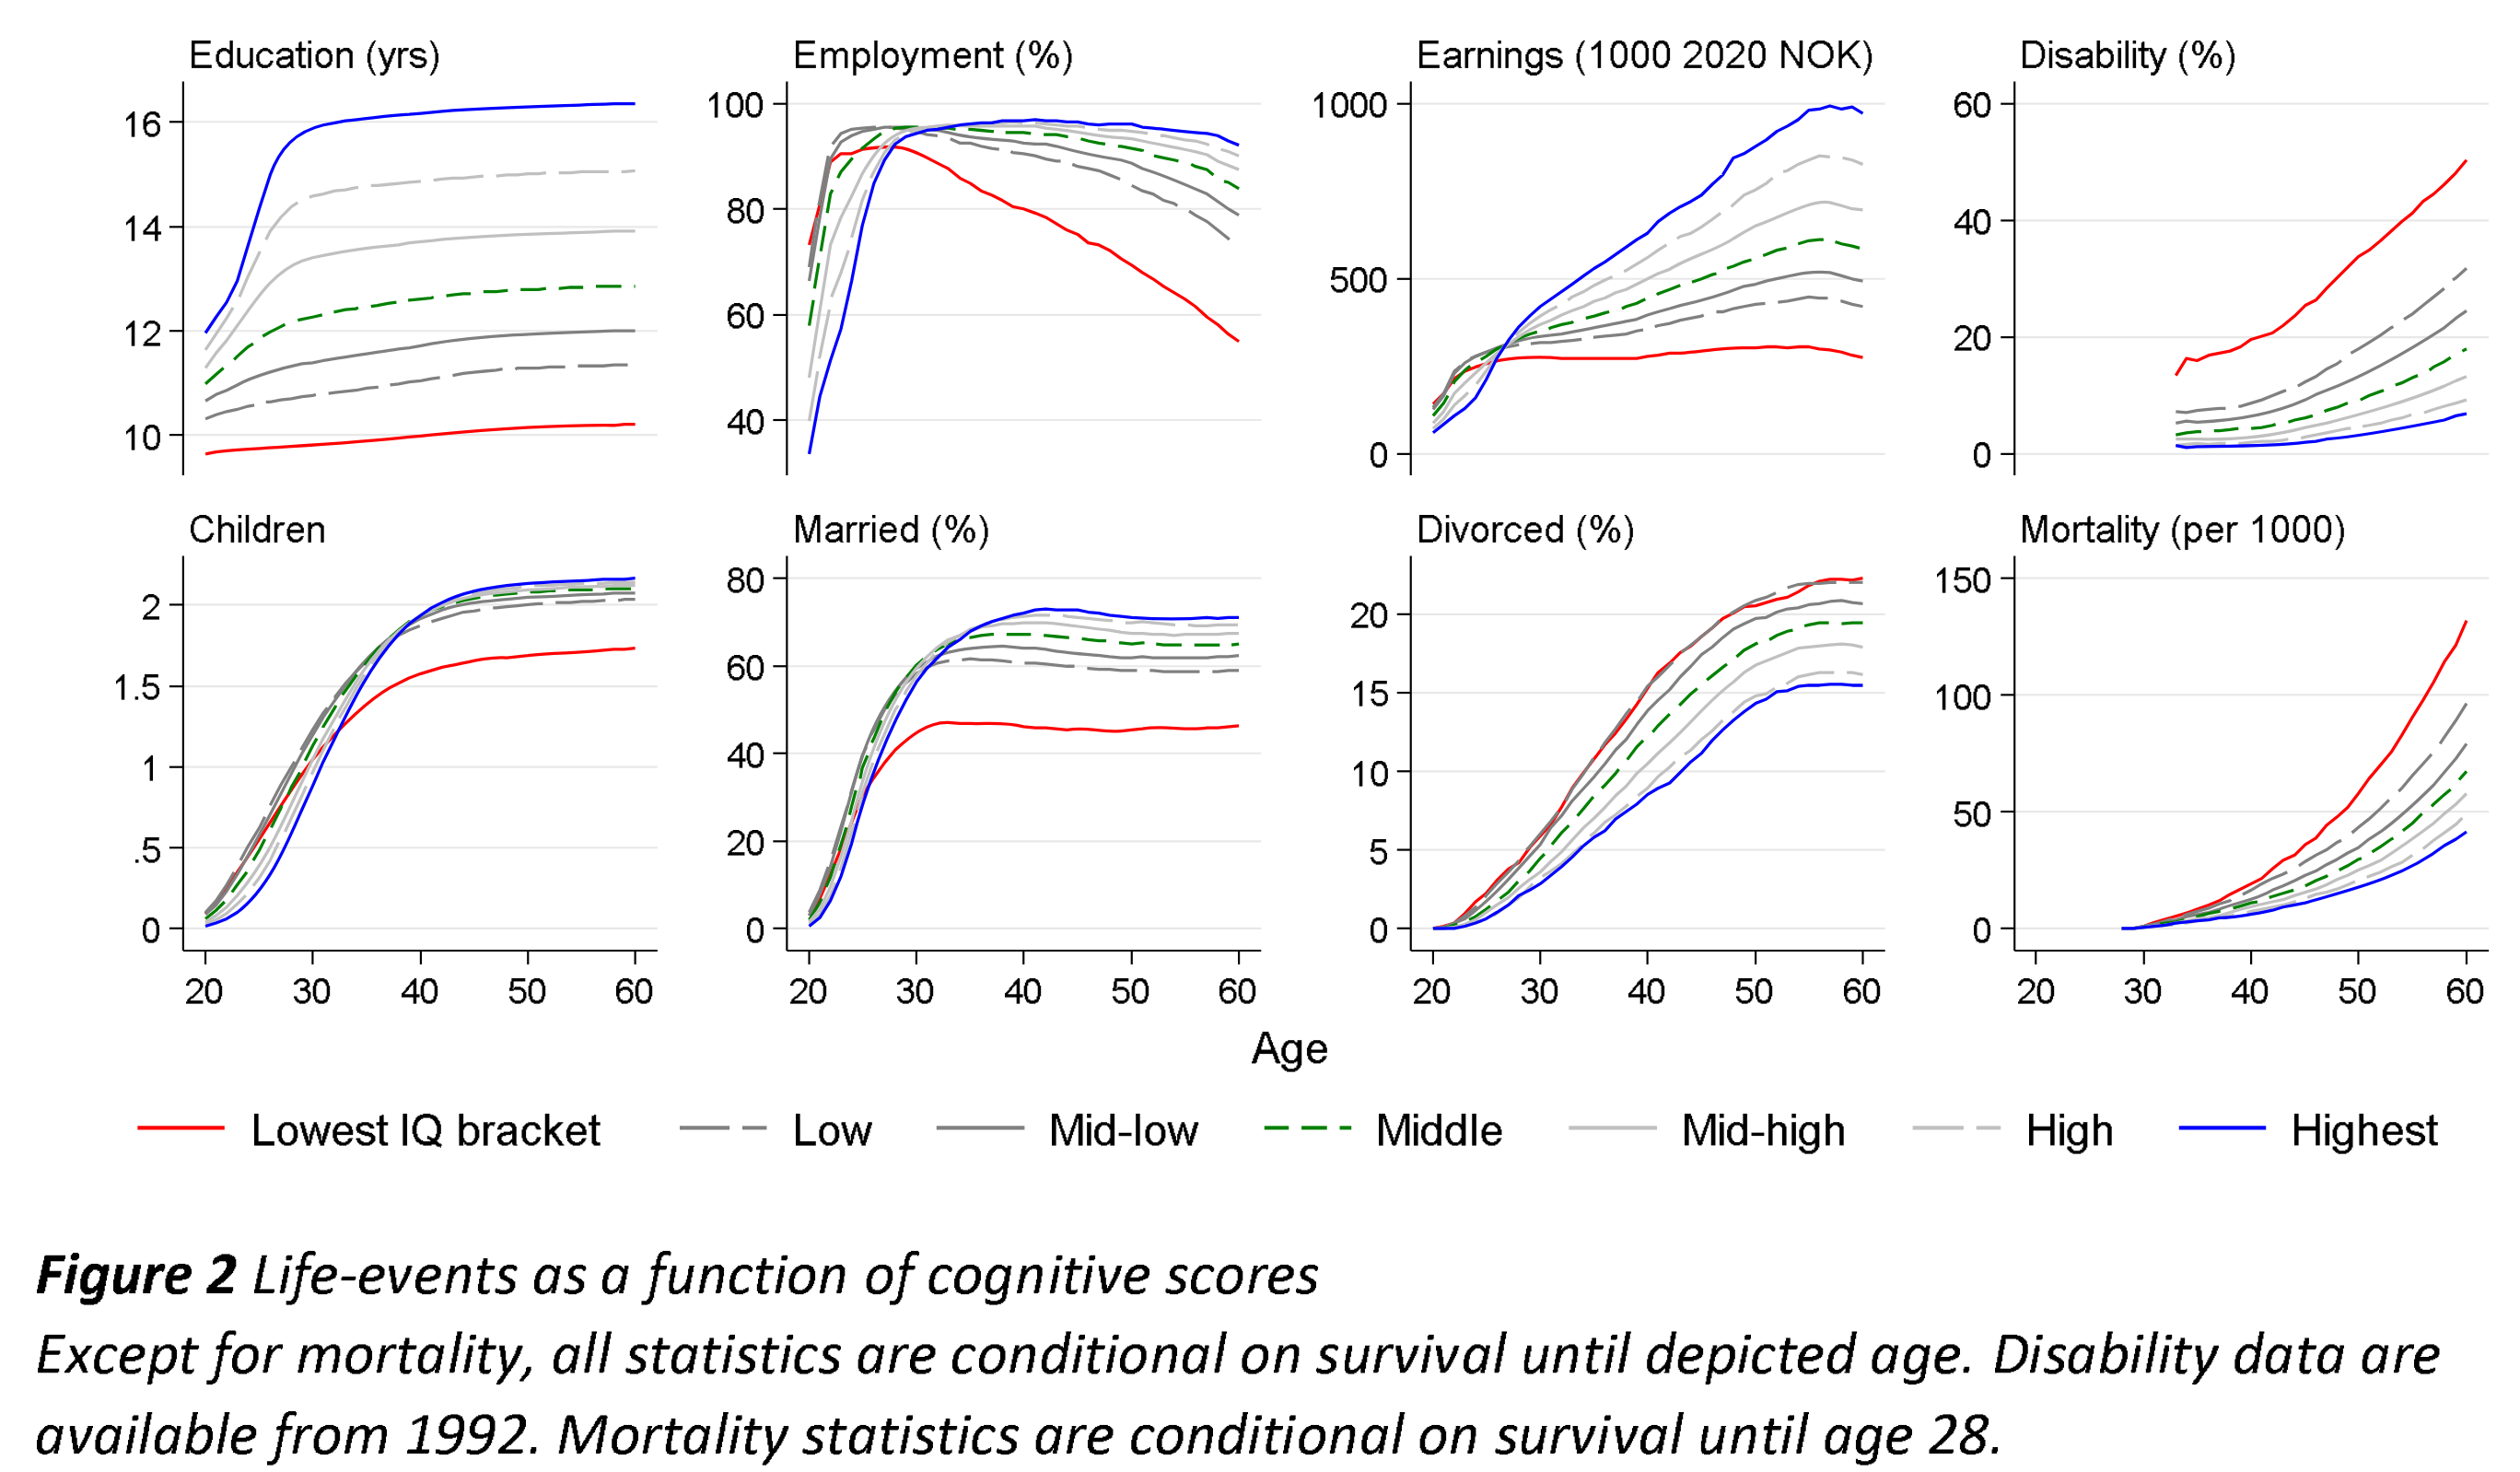
There are several things of note. First, the married % is very low for the lowest group, at about 45% at age 60. But despite their low marriage rate, they still end up with the highest divorce rate, about 25%. From this we can infer that about 55% of their marriages end in divorce by age 60.
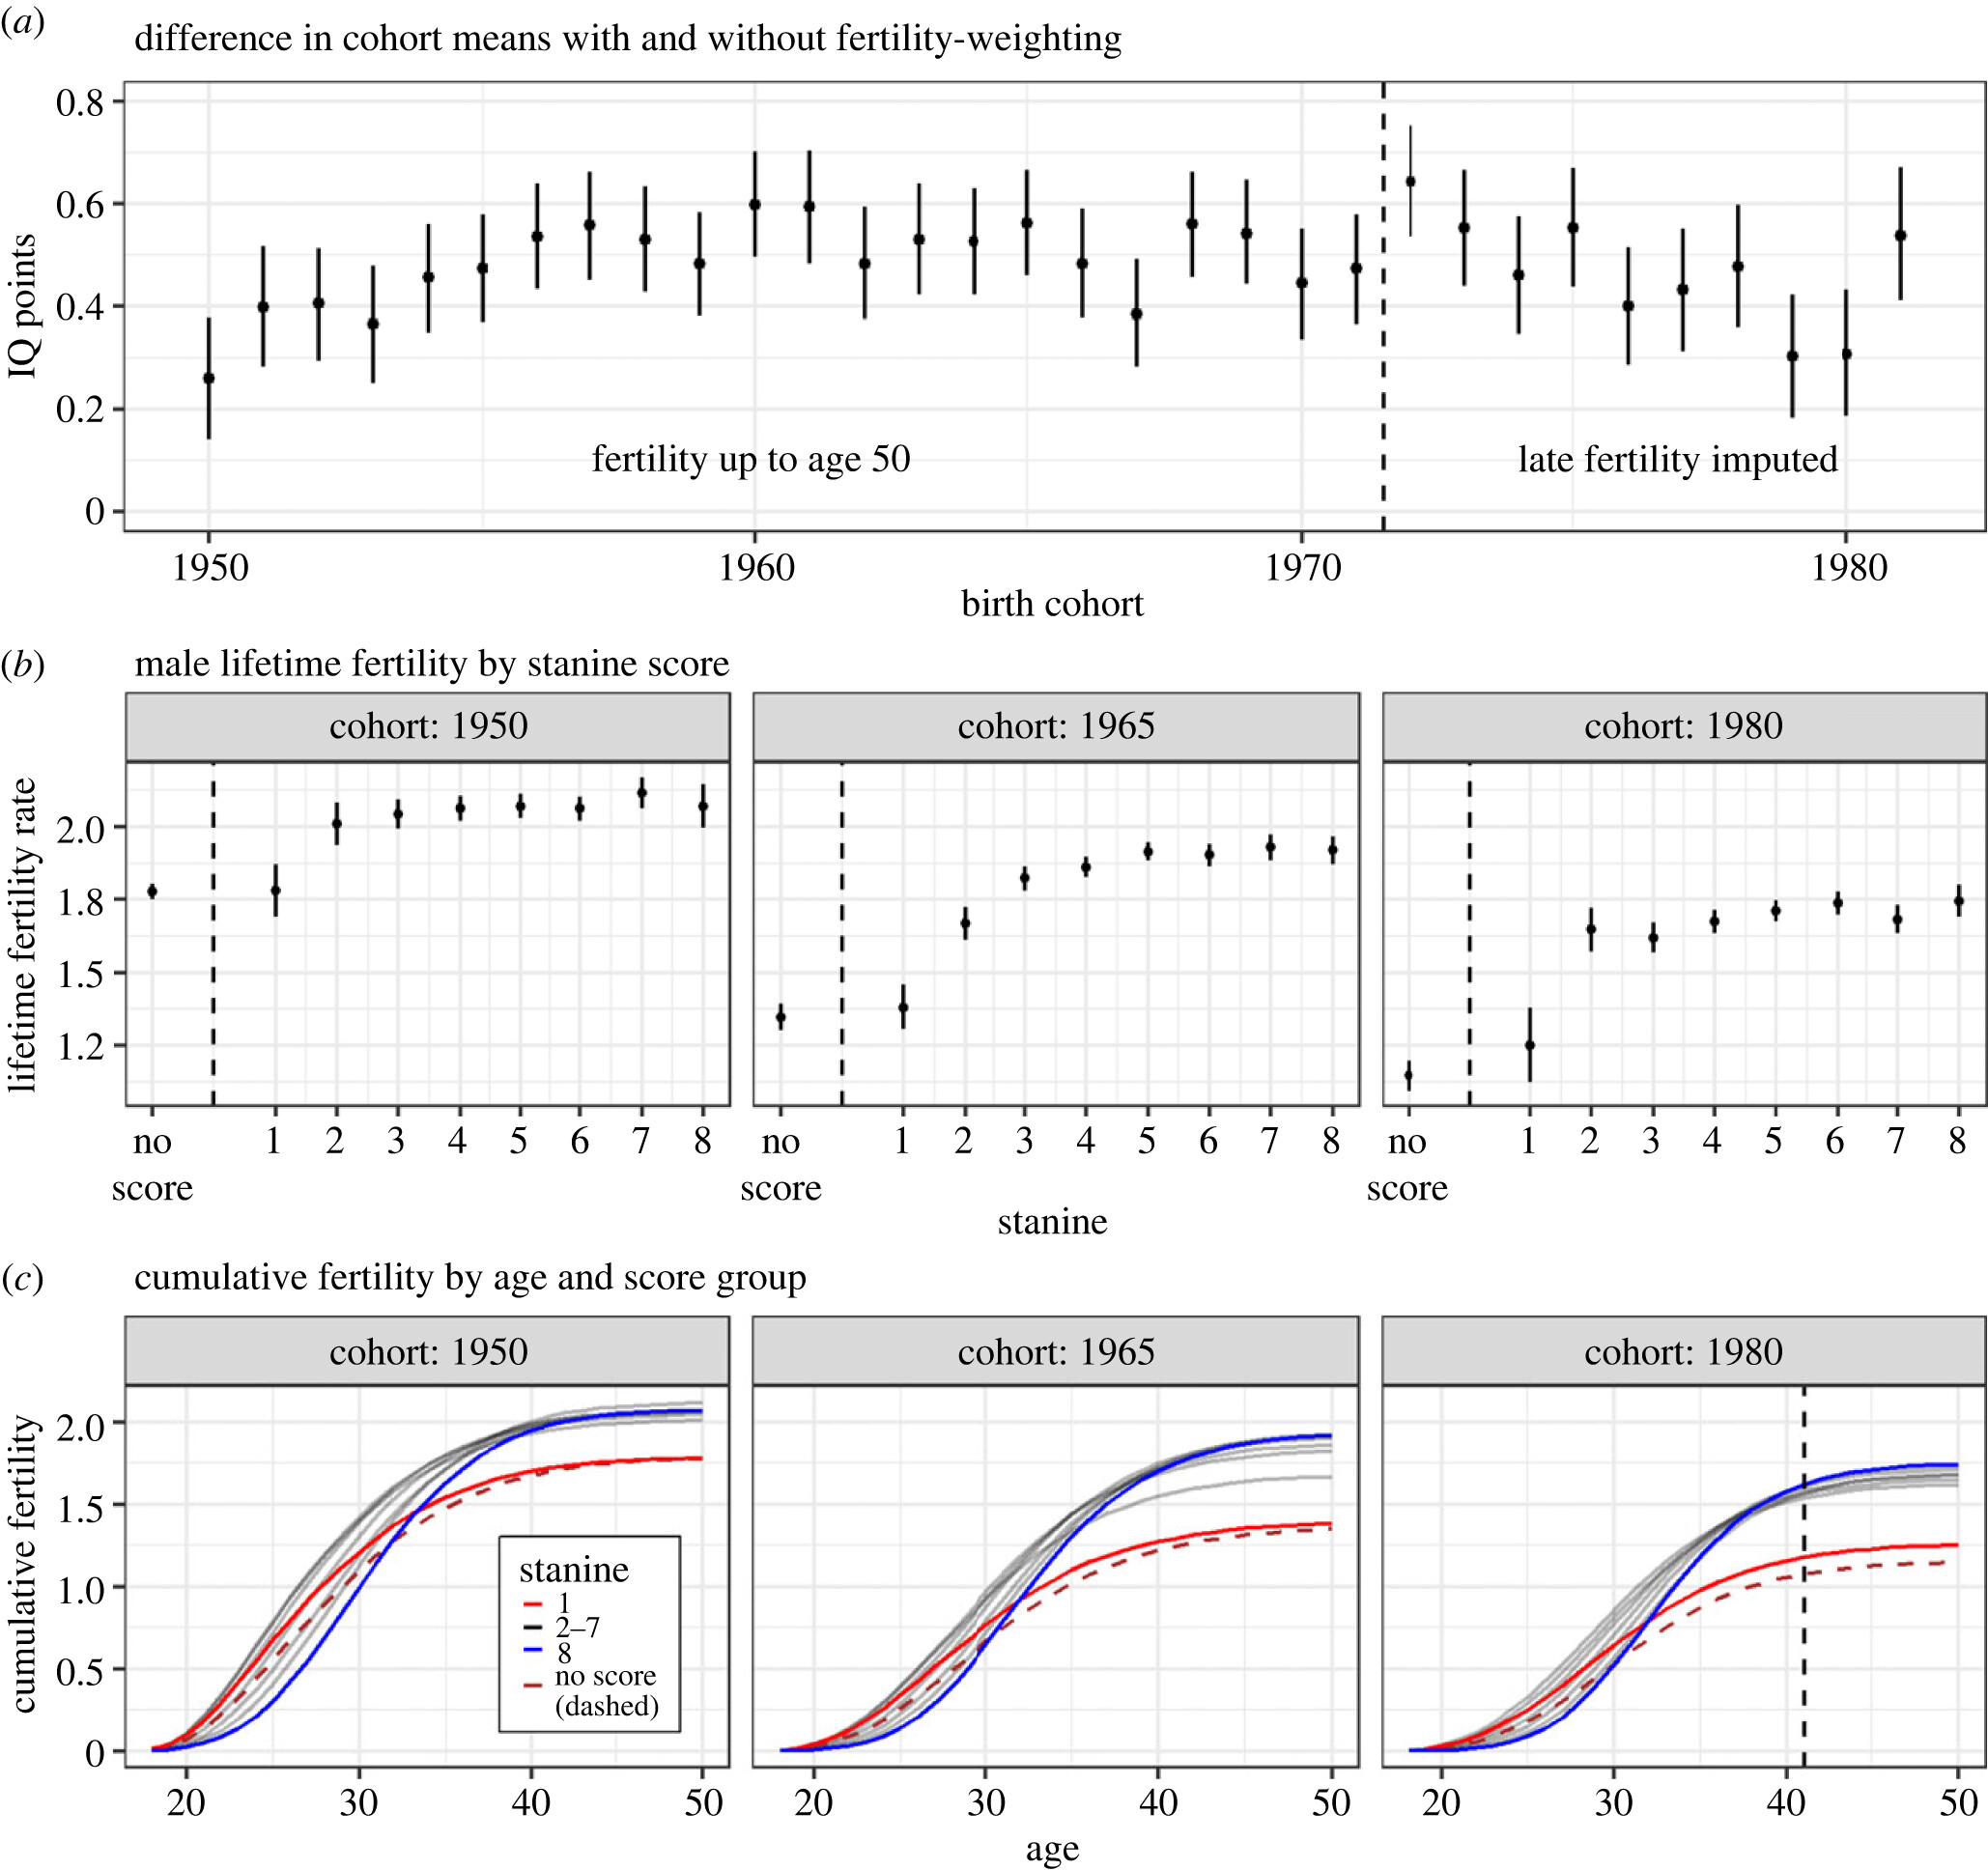
Second, male fertility for the mean 70 IQ group is markedly lower. This is the same as seen in a prior study from Norway and Sweden based on overlapping data, so that’s good. This does not mean Norway has eugenic fertility because this dataset only concerns men and only those who took the test (who were not disqualified prior for some reason). Here’s the Swedish results for ease of comparison:
And the other Norwegian study:
Third, all the other social metrics show approximately the intelligence gradient one would expect. For instance, the lowest group has about no career progression with regards to earnings. Their first job occupational status is also their last. At age 60, their income is about 25% of the highest IQ group. The 122+ IQ group on the other hand has a steady almost linear increase in salary throughout their entire career. It’s honestly kind of amazing to see.
Finally, they get to what their paper is (supposed) about, namely, dementia risk:
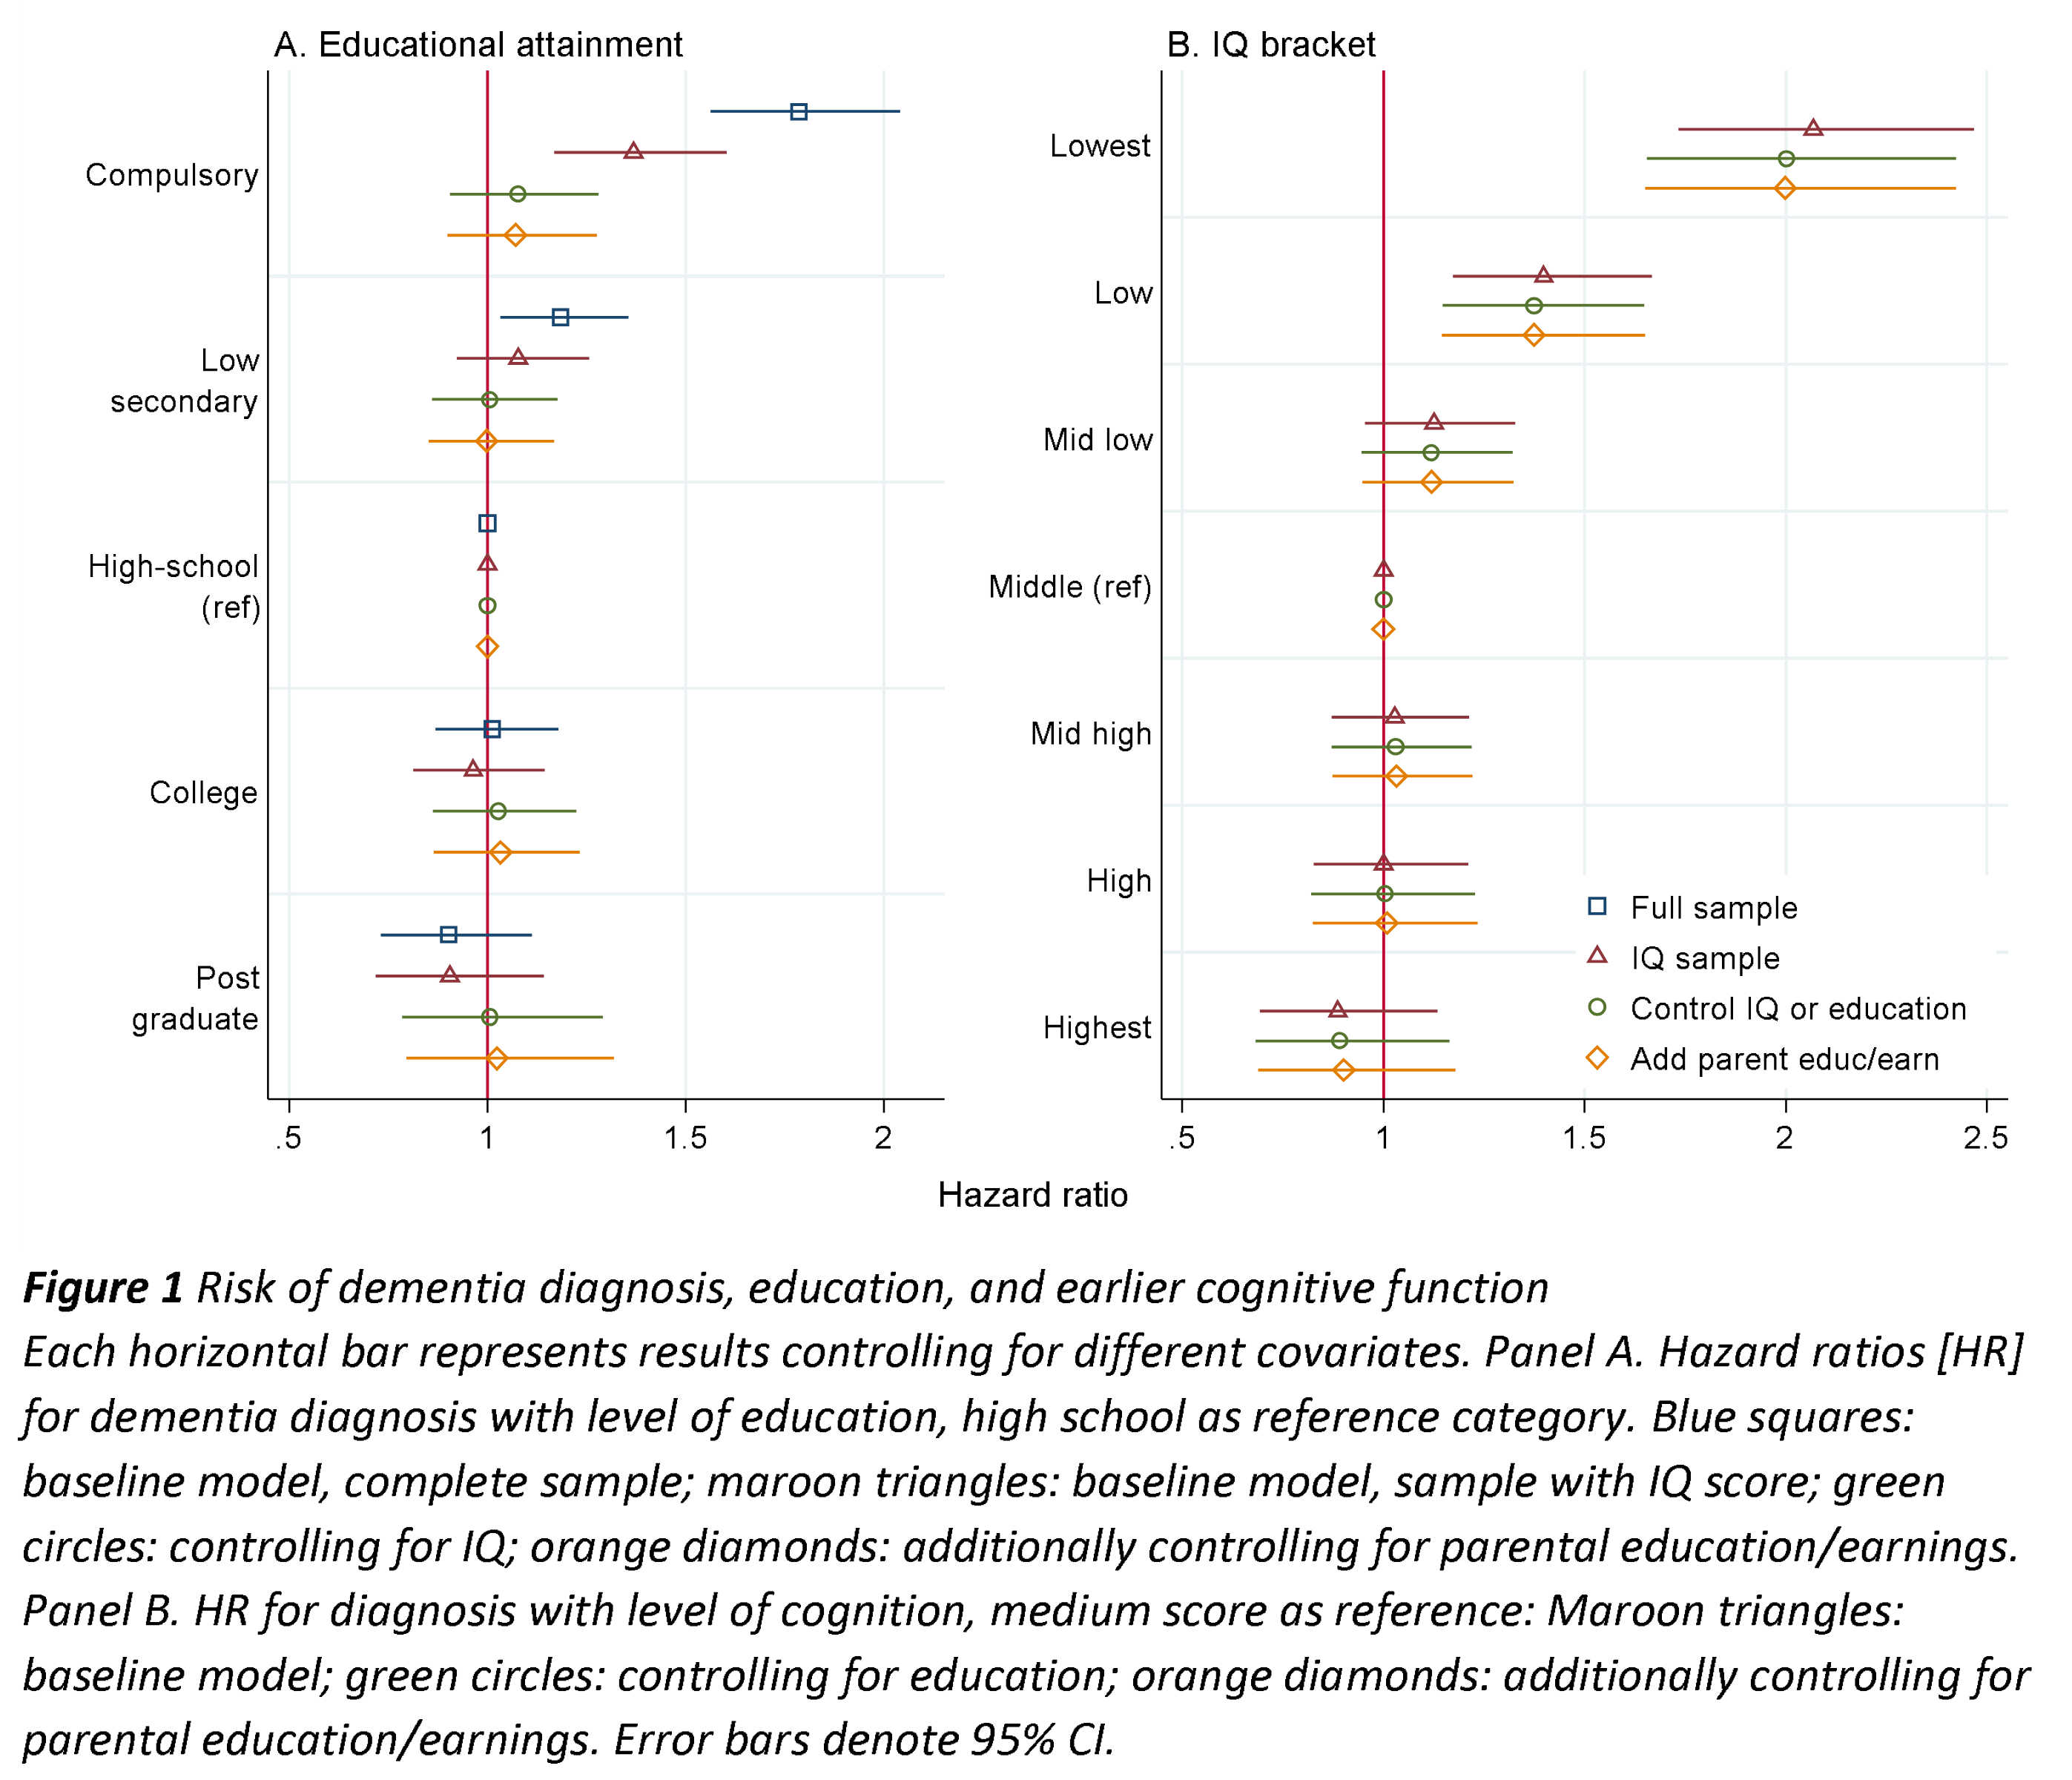
Each dot and line is a model with its confidence interval. We see that in the red triangle models, education and IQ both predict dementia risk fairly well, but IQ does better (assuming betas are standardized and comparable). However, when IQ is controlled for, education no longer predicts dementia, compare the green circle models. The authors furthermore tell us that:
Linear probability models yielded similar results (Figure S4). There was no attenuation of effects when using within-family variation in cognitive test score to predict risk, with the point estimate for the lowest score category relative to the middle increasing from 0.70 percentage points (95% CI: 0.55 to 0.86) in the baseline model to 0.90 (CI: 0.50 to 1.30) when adding family fixed effects. For education, however, the point estimate for the lowest educational category relative to HS declined from 0.22 percentage points (CI: 0.11 to 0.33) in the baseline model to 0.05 (CI: -0.23 to 0.33), suggesting that within-family factors can account for the relationship.
For good measure, here is their Figure S4:
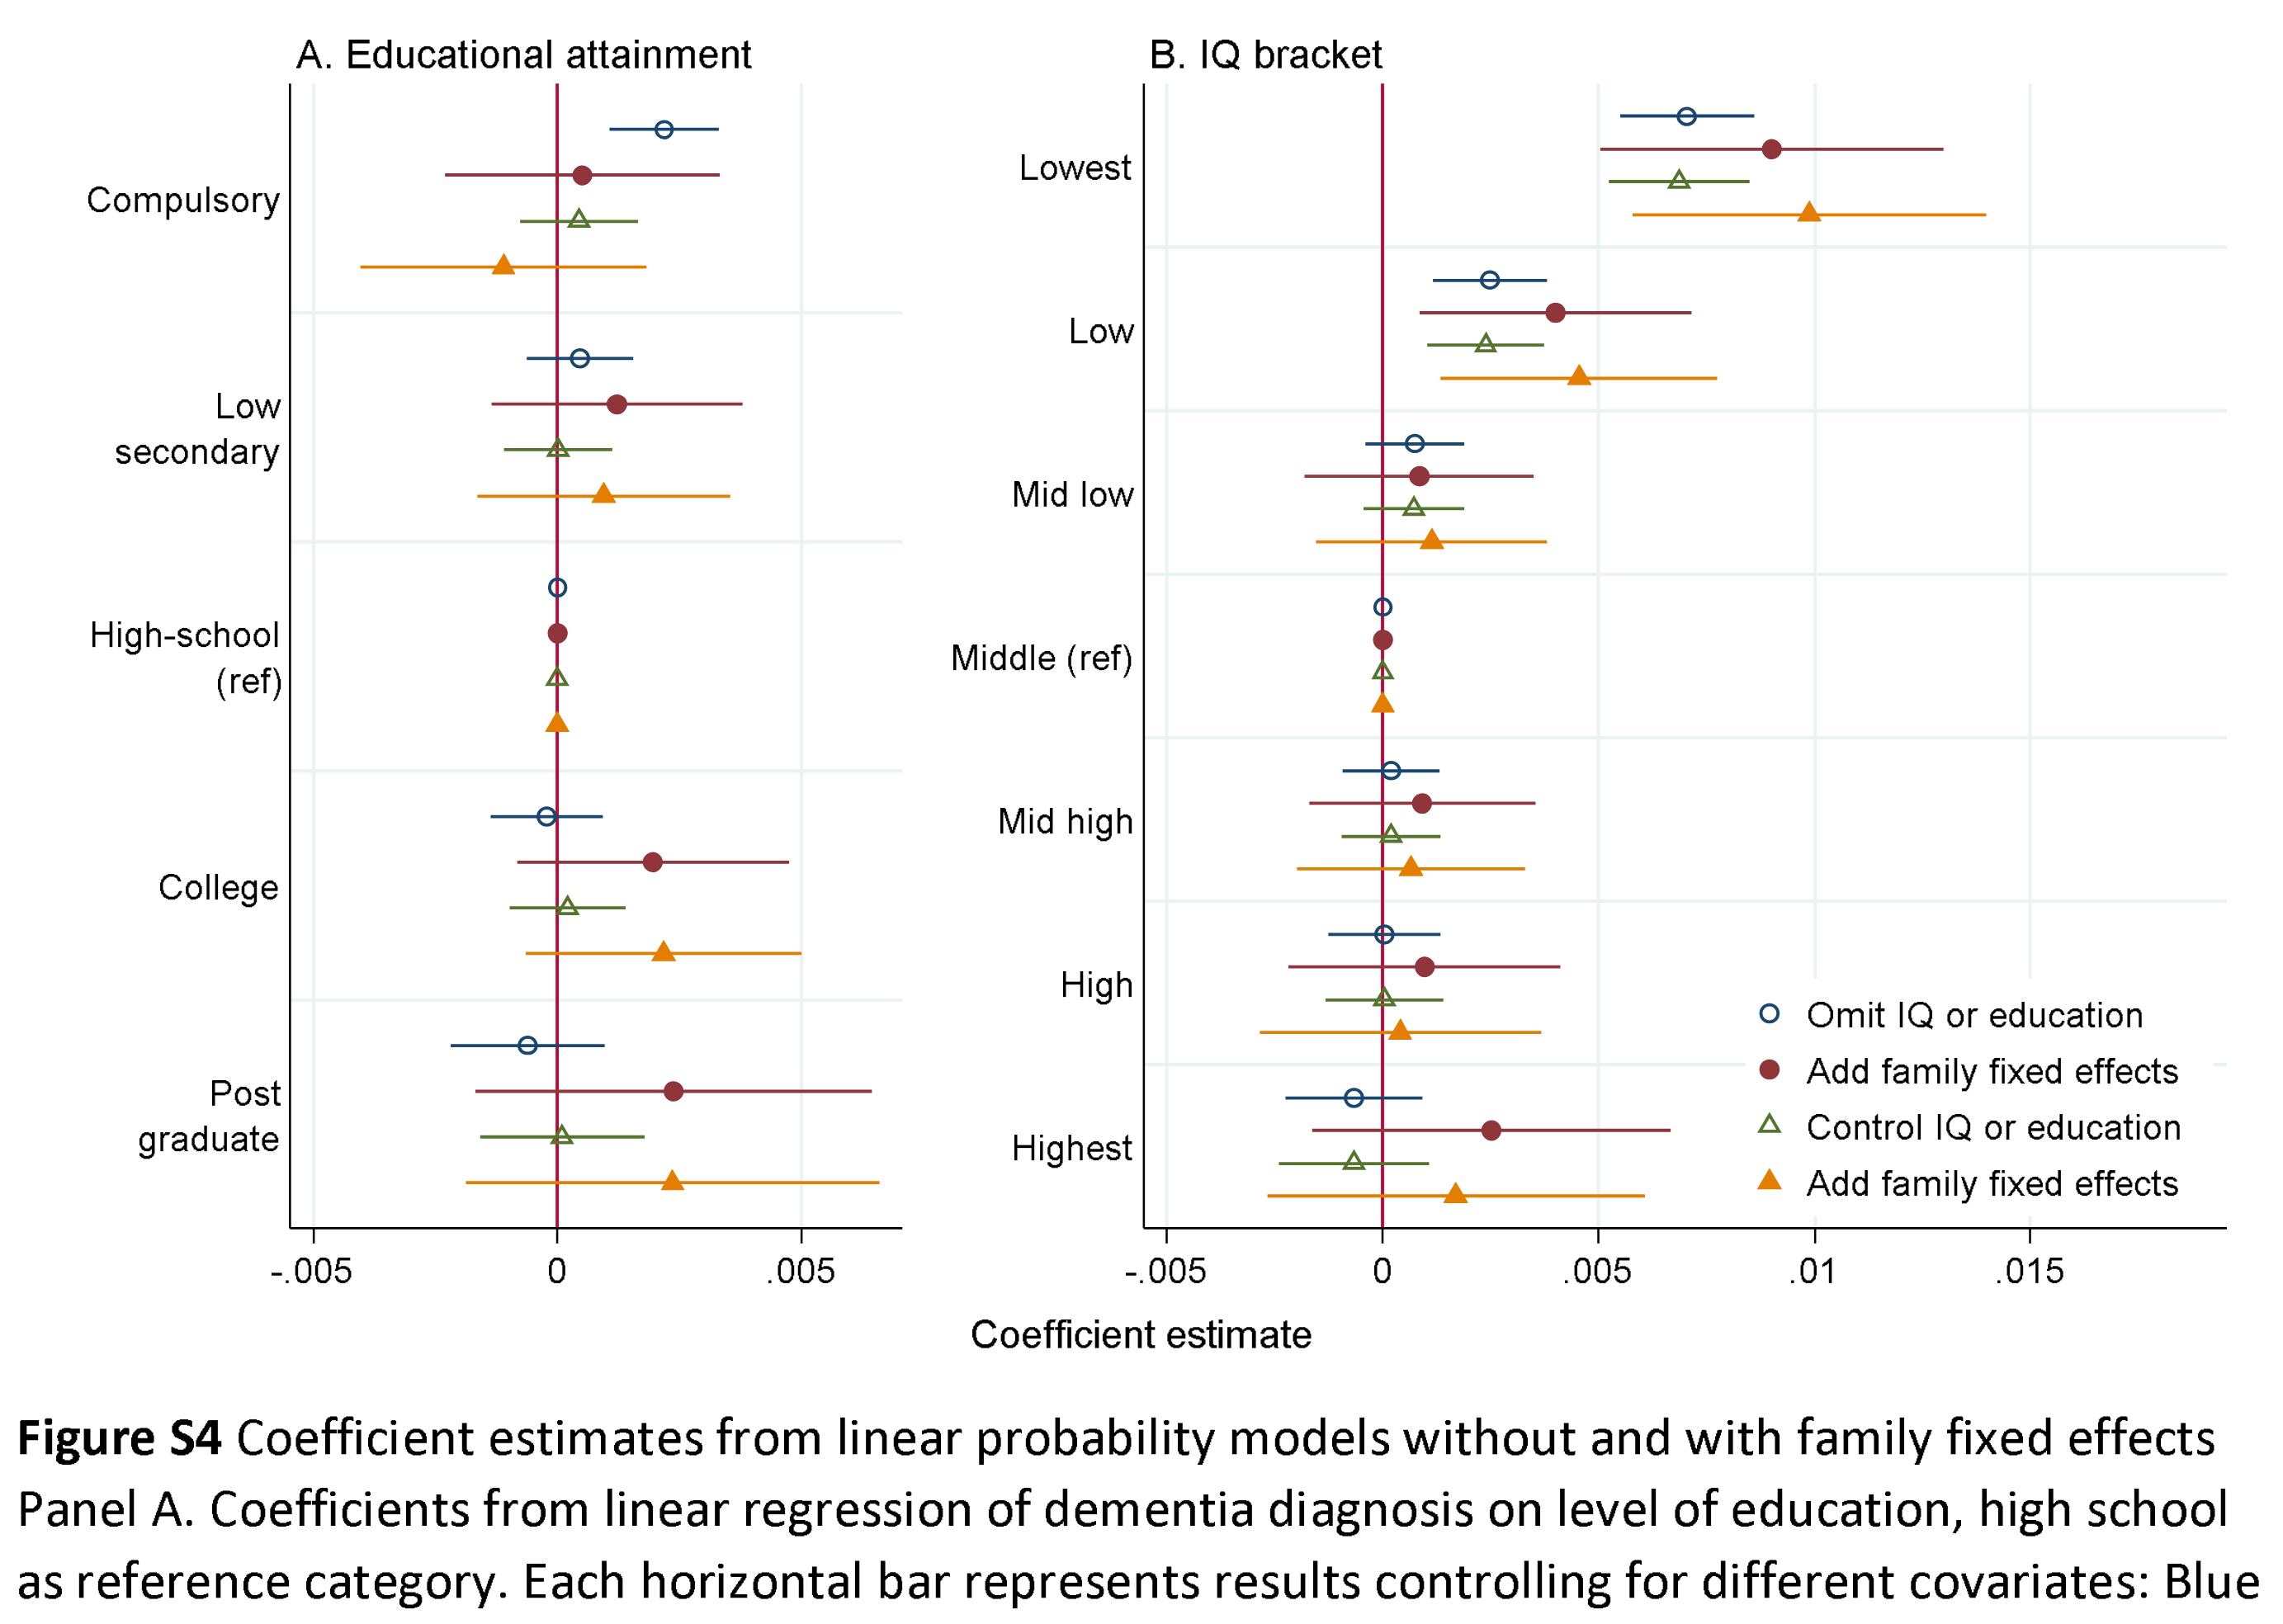
Of interest here are the red circle models (sibling comparison). On the left side, we see that education no longer predicts dementia within families (in the p > .05 sense), but on the right, we see that IQ still does. Granted, despite the massive sample size, the lines overlap quite a bit for education, so we can’t be entirely certain here about education’s lack of validity between siblings. Nevertheless, the authors are blunt about what this means:
Within-family variation in cognitive ability, reflecting non-shared genes or non-shared environment, showed the same association to early dementia diagnoses as seen in the full data. This means that factors shared within families, such as sibling-shared genes, childhood socioeconomic status, parental education, or other shared family experiences, cannot account for the findings. In contrast, the increased risk associated with low education did not survive controlling for within-family effects, demonstrating that shared family genetic or non-genetic factors can explain the association.
Taking the results for granted, it means that education is also not causal for preventing dementia. This finding aligns well with the prior literature on cognitive epidemiology that Linda Gottfredson and Ian Deary’s people pushed hard in the 2010s. This review paper by David Lubinski, though dated, is good:
This commentary touches on practical, public policy, and social science domains informed by cognitive epidemiology while pulling together common themes running through this important special issue. As is made clear in the contributions assembled here, and others (Deary, Whalley, & Starr, 2009; Gottfredson, 2004; Lubinski & Humphreys, 1992, 1997), social scientists and practitioners cannot afford to neglect cognitive ability when modeling epidemiological and health care phenomena. However, given the dominant concern about the confounding of general cognitive ability (GCA) and socioeconomic status (SES), and the extent to which SES is frequently seen as the primary cause of health disparities (while GCA is neglected as a possible influence in epidemiology and health psychology), some methodological applications for untangling the relative influences of GCA and SES are reviewed. In addition, cognitive epidemiology is placed in a broader context: Just as cognitive epidemiology facilitates an understanding of pathology (“at risk” populations, and ways to attenuate undesirable personal and social conditions), it may also enrich our understanding of optimal functioning (“at promise” populations, and ways to identify and nurture the human and social capital needed to develop innovations for saving lives, economies, and perhaps even our planet). Finally, while GCA is likely the most important dimension in the study of individual differences for modeling healthy behaviors and outcomes, other relatively independent dimensions of psychological diversity do add value (Krueger, Caspi, & Moffitt, 2000). For example, compliance has at least two psychological components: a “can do” competency component (ability) and a “will do” motivational component (conscientiousness). Ultimately, developing and modeling healthy behaviors, interpersonal environments, and medical maladies are best accomplished by teaming multiple dimensions of human individuality.
It’s a pity the authors did not also fit their models on the other social metrics with their sibling sample. This would have given us another replication of Charles Murray’s initial efforts. Going with the same naming convention, we might call that cognitive sociology.
To note, the study does not include immigrants:
To account for family background and family structure, we restrict the analyses to native-born individuals with two native-born parents. We further restrict our analyses to individuals with a valid education record at age 30 and, to ensure inclusion in all three health registries, present in Norway the year of the 58th birthday, yielding an overall sample of 268,614, of whom 207,814 (77.4%) have a valid cognitive ability score.
