It is a long time ago since I did this project. I did not write about it here before but it is a pity since the results are thus not ‘out there’. I put the project page here in 2012 (!). In short, I wrote python code to crawl Wikipedia lists. I figured out a way to decide whether a person was male or female. This was done using gendered pronouns which exist in English. I.e., the crawler fetches the full-text of the article, and counts “he”, “his”, “him”, “she”, “her”. It assigns the gender with the most pronouns. This method seems rather reliable in my informal testing.
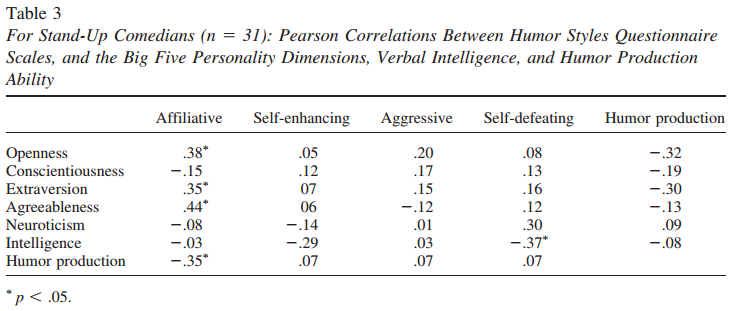
I specifically wrote it to look at comedians because I had read a study of comedians (Greengross et al 2012). They gave personality and a vocabulary test (from the Multidimensional Aptitude Battery, r=.62 with WAIS-R) to a sample of 31 comedians and psychology 400 students. The comedians scored 1.34 d above the students. Some care must be taken with this result. The comedians were much older and vocabulary raw scores go up with age (mean age 38.9 vs. 20.5). The authors do not state that they were age-corrected. Psychology students are not very bright and this was a sample from New Mexico with lots of Hispanics. We can safely conclude that comedians are smarter than the student body and the general population of New Mexico, but can’t say much about exactly. We can hazard a guess at student body (maybe 107 IQ) + age corrected d (maybe 15 IQ), so we end with an estimate of 122 IQ.
There are various other tables of interest that don’t need much explaining, which I will paste below:


As of writing this, I found another older study (Janus, 1975). I will just quote:
Method
The data to support the above theses were gathered through psychological case studies, in-depth interviews with many of the leading comedians in the United States today, and psychological tests. [n addition to a clinical interview, the instruments used were the Wechsler Adult Intelligence Scale, Machover Human Figure Drawing Test, graphological analysis, earliest memories, and recurring dreams.Population
Population consisted of 55 professional comedians. In order to be considered in this study, comedians had to be full-time professional stand-up comedians. Most of the subjects earned salaries of six figures or over, from comedy alone. In order to make the sample truly representative, each comedian had to be nationally known and had to have been in the field full time for at least ten years. The average time spent in full- time comedy for the subjects was twenty-five years. The group consisted of fifity-one men and four women. They represented all major religions, many geographic areas, and diverse socioeconomic backgrounds. Comedians were interviewed in New York, California, and points in between. Their socioeconomic backgrounds, family hierarchy, demographic information, religious influences, and analytic material were investigated. Of the population researched, 85 percent came from lower-class homes, 10 percent from lower-middle-class homes, and 5 percent from middle-class and upper-middle-class homes. All subjects participated voluntarily, received no remuneration, and were personally interviewed by the author.Intelligence
I.Q. scores ranged from 115 to 160+. For a population at large, I.Q. scores in the average range are from 90 to 110. I.Q. scores in the bright-average range of intelligence, that is, from 10g to 115, were scored by only three subjects. The remainder scored above 125, with the mean score being 138. The vocabulary subtest was utilized. Several subjects approached it as a word-association test, but all regarded it as a challenge. Since these are verbal people, they were highly motivated. The problem was not one of getting them to respond, it was one of continuously allaying their anxiety, and re- assuring them they they were indeed doing well.
So, a very high mean was found. WAIS was published in 1955, so there is approximately 20 years of FLynn gains in raw scores, presumably uncorrected for. According to a new meta-analysis of FLynn gains (Trahan et al 2014), the mean gain is 2.31 per decade. So we are assuming about a gain of 4.6 IQ here. But then again, the verbal test for the students was published in 1984, so there may be some gain there as well (FLynn effects supposedly showed down recent in Western countries). Perhaps a net gain in favor of the old study by 4 IQ. In that case, we get estimates of 134 and 122. With samples of 31 and 55, different subtests, sampling procedure etc., this is surely reasonable. We can take a weighted mean and say best estimate for professional comedians is about 129.7, or about +2SD. It seems a bit wild, are comedians really on average as smart as fysicists?
EDIT: There is another study by Janus (1978). Same test:
[N=14] Intelligence scores ranged from 112 to 144 plus. (The range of average IQ is from 90 to 110.) Four subjects scored in the bright average range–i.e., 108 to 115. The remaining subjects scored above 118 with a mean score of 126. Two subjects scored above 130. The mean score for male comics was 138. The subjects approached the testing with overenthusiasm, in some cases bordering on frenzy. Despite the brightness of the group, all subjects needed constant reassurance and positive feedback.
So 126, with ~5 IQ because of FLynn effect. New weighted mean is 128.5 IQ.
Perhaps we should test it. If you want to test it with me, write me an email/tweet. We will design a questionnaire and give it to your local sample of comedians. One can e.g. try to convince professional comedian organizations (e.g. Danish here, N=35) to forward it to their members.
So what did I find?
I did the scraping twice. One time at first in 2012, and then again later when I was reminded of the project in May 2014. Now I have been reminded of it again. The very basic stats is that there were 1106 comedians found, of which the gender distribution was this (the “other” is unknown gender, which was 1 person).
What about the change over time? The code fetches their birth year if mentioned on their Wikipedia page. Then I limited the data to US comedians (66% of the sample). This was done because if we are looking for ways to explain it, we need to restrict ourselves to some more homogenous subset. What explains the change in gender distribution in Saudi Arabia at time t1 may not also explain it in Japan.
Next we get a common scientific conflict of interest: that between precision of estimate and detail. Essentially what we need is a moving average since most or all years have too few comedians for a reliable estimate (very zigzaggy lines on the plot). So we must decide how large a moving average to use. A larger will give more precision in estimate, but less detail. I decided to try a few different options (5, 10, 15, 20). To avoid extreme zigzagginess, I only plotted them if there were >=20 persons in the interval. This plots look like this:
So in general we see a decline in the proportion of male comedians. But it is not not going straight down. There is a local minimum in 1960 or so, and a local maximum in 1980 or so. How to explain these?
I tried abortion rate (not much data before 1973) and total fertility rate (plenty of data) but was not convinced by the results. One can also inflate or deflate the numbers according to which moving interval one chooses. One can even try all the possible sizes of intervals and the delays to see which gives the best match. I did some of this semi-manually using spreadsheets, but it has a very high chance of overfitting. One would need to do some programming to try all of them in a reasonable time.
I wrote some of this stuff in a paper, but never finished it. It can now be found at its OSF repository.
Datasets
Python code. This includes code to crawl Wikipedia with and quite a lot of other raw data output files.
References
Greengross, G., Martin, R. A., & Miller, G. (2012). Personality traits, intelligence, humor styles, and humor production ability of professional stand-up comedians compared to college students. Psychology of Aesthetics, Creativity, and the Arts, 6(1), 74.
Janus, S. S. (1975). The great comedians: Personality and other factors. The American Journal of Psychoanalysis, 35(2), 169-174.
Janus, S. S., Bess, B. E., & Janus, B. R. (1978). The great comediennes: Personality and other factors. The American Journal of Psychoanalysis, 38(4), 367-372.
Trahan, L. H., Stuebing, K. K., Fletcher, J. M., & Hiscock, M. (2014). The Flynn effect: A meta-analysis.