This is a post in the on-going series about stuff in my package: kirkegaard [I’m not egocentric but since there is no central theme about the functions in the package other than I made and use them, there is nothing else to call it.]
I figure it should be easy to find someone who wrote a ready-made function to plot contingency matrices with ggplot2. Not so apparently!
However, it is a relatively simple matter. So here’s one:
Features:
- Easily plot a decent contingency table with ggplot2. Just input the datafile and the names of the two variables.
- Can also calculate marginal values, which is to say that we set either all rows or columns to be 1.
- Automatically sets the axis labels to the names you used, which is often enough.
library(devtools); install_github("deleetdk/kirkegaard"); library(kirkegaard)
GG_contingency_table(mpg, "drv", "cyl")
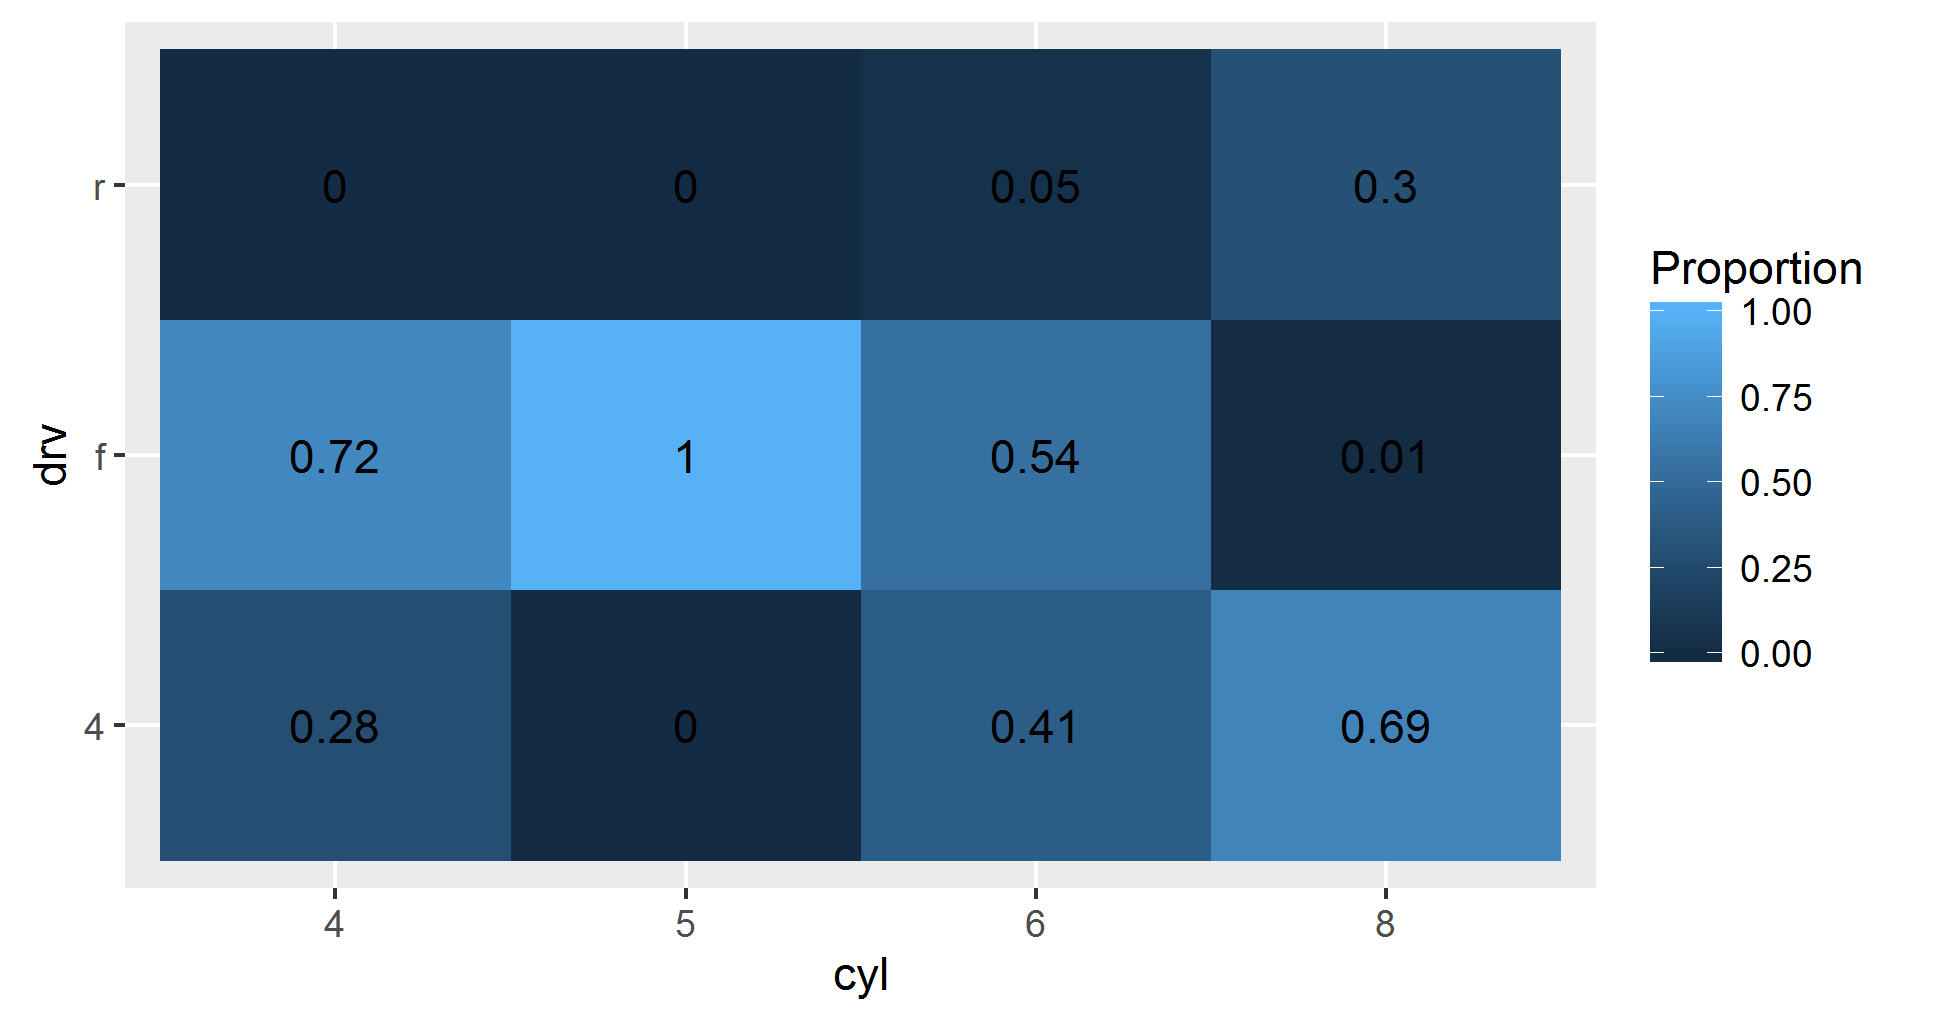
GG_contingency_table(mpg, "drv", "cyl", margin = 1)

GG_contingency_table(mpg, "drv", "cyl", margin = 2)