This is just a brief post summarizing some stuff because I don’t have time to do more right now.
Noah Carl asks me:
Can you point me to some evidence (e.g., a blog post) on “PC-bias” in polling in recent years?
It is hard to establish biased polling. One has to:
- Obtain datasets of polling data
- Forecast the election using the data
- Compare the forecast to the election results
What exactly is the bias we are talking about?
In general, when one asks people questions, they don’t always answer truthfully. There is a large literature (review) on why people lie on surveys which applies equally to surveys of political intentions (=polls). Why do people lie on surveys? Generally, its when the response would be embarrassing, unpopular or illegal — in short, what is socially desirable. The stress is on socially, because sometimes what is popular in the media to talk about is sometimes very different from what people really like/dislike. I equate the media with socially for the time being because the media reflects the collective thinking, and humans are sensitive to what (they think) others think about them. The context matters too: people lie more when they have to answer to another human (face to face, phone) than to a machine (internet).
So we expect people to lie on polls when one or more of the above are true. We expect the most lying when voters are interviewed face-to-face and when they intend to vote for parties/politicians that are very unpopular in the media. Compared with the general population, the media is pushed to the left to some degree. I reviewed polls of journalists etc. (in Danish), but generally the situation looks something like this:

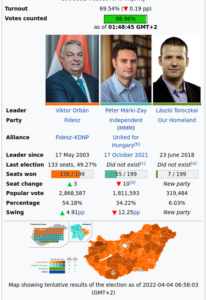
This shows the journalists preferences for the Norwegian parliament election in 2016. The numbers are the number of seats, which is 169, so each seat is ~.59%. The last election was in 2013, but one can find recent polls to compare with.
Doing some quick arithmetic, we see that the big center-left party (Ap) gets some 38.5% among journalists and about 35% for general population. Much the same. However, the big center-right party (H) gets about 25% among voters, but only 13.6% among journalists. In general, the two blocks are about equally large in parliament and in general elections. But when we look at the journalist cake chart, it has a very large left-wing lead: 12+24+65+18=119 seats, out of 169 is 70%. The immigrant critical party, Frp, gets about 15% in the general polls, but ~0% among journalists. Talk about the under-representation of minorities! Alas, it is the wrong kind — European and with more men.
A simple way to estimate how much bias to expect for each party is to calculate the difference between the general population polls/elections for a party and the journalist polls. Another way is to rank the parties on a left-right spectrum (even if this doesn’t make much sense) and then expect more bias from the parties the furthest to the right.
(I am aware that the general population polls show some bias — according to the thesis of this post — and thus are somewhat problematic to use to compare to the journalist polls, which probably also show some bias. I don’t know the details of how they were done. I ignore this problem for the being.)
Show me the data
This kind of bias has been investigated in different countries and even re-discovered a number of times. For this reason, it has a number of names in the local languages. In the UK it’s called the shy Tory factor. Before writing this post, I searched a bit and one can find a number of okay sources on the topic covering the UK (Tory, UKIP, SNP), US (Trump) and Canada. In no particular order:
- http://www.nature.com/news/the-polling-crisis-how-to-tell-what-people-really-think-1.20815
- https://fivethirtyeight.com/features/shy-voters-probably-arent-why-the-polls-missed-trump/
- http://www.threehundredeight.com/2015/05/are-conservative-parties-under.html
- https://techcrunch.com/2016/10/19/the-perils-of-polling-in-a-brexit-and-donald-trump-world/
- https://ballotpedia.org/Shy_Elephant_Factor
- http://eprints.ncrm.ac.uk/3789/1/Report_final_revised.pdf
- http://www.jstor.org/stable/3078789?seq=1#page_scan_tab_contents
- http://www.sciencedirect.com/science/article/pii/S0261379415002231
The report above is probably the most detailed on the UK.
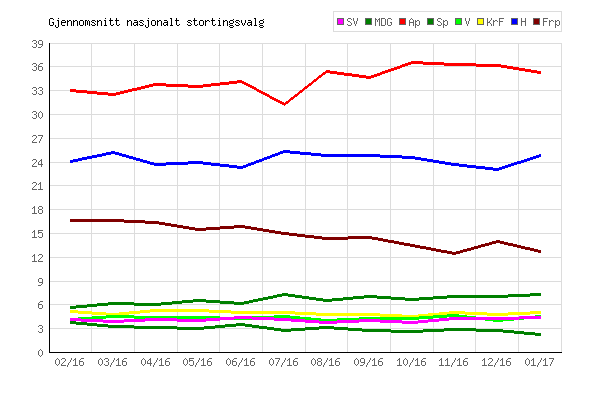
But the amount of data is not really sufficient. One should dig up more data, for more countries, more parties and more elections. Sweden is a particularly interesting case given that the media in this country is perhaps the most biased. This should be reflected in especially strong polling bias against the parties the media doesn’t like, which is primarily the immigrant critical party (Sweden Democrats, SD). There is a website that monitors SD in the polls and also has the actual election results. The result looks like this:
The yellow line is a moving average of the polls, the red dots are the election results. So, out of 3 elections, SD was underestimated 3 times. By how much? Here we have to eye-ball the chart, but something like: 1, 0.5, 2%points. So, small effects even in the most extreme country.
Denmark?
Erik Gahner has made a github repo for polling data from Denmark 2010-present. The last elections were in 2011 and 2015, so that gives us 2 datapoints. Instead, I was even more lazy and used the polls listed on Wikipedia for the 2015 election. Plotting the data with a loess looks like this:

The squares at the end show the actual results (not used in the fitting process). Looking at the plot, one can see the large gain for blue, which is O, the nationalist party. The same one polls sometimes fail to find just a single journalist who would vote for. If we take the model predictions and subtract the actual result, we get this:
> preds - d[1, parties]
    V    A    O    B   F    Ø    I    C    K     Å
1 1.1 -1.4 -3.1 0.34 1.5 0.97 0.11 0.34 0.18 0.021
So, there was a 3.1%point error for the nationalist party. Note that there was also a moderately high underestimation of A, the large center-left party, and about equal loss for V, the large center-right party.
Turns out that someone already did this kind of analysis for Denmark, data 1990-2015. Results:

Again, the bias for DF (nationalist) is the largest, but there is a also a substantial bias for S (large center-left). Not sure why this is.
Where to now?
Collect data like these for all countries one can find, particularly those with growing nationalist parties (so pretty much all European countries). Fit the same kind of model to all the data (methodological consistency), make the predictions, compare with results. Aggregate results. The effect size will not be large, so expect a lot of noise.
Wikipedia is helpful for gathering data:
- https://en.wikipedia.org/wiki/European_Parliament_election,_2014_(United_Kingdom)#Opinion_polls
- https://en.wikipedia.org/wiki/Opinion_polling_for_the_2010_United_Kingdom_general_election
- https://en.wikipedia.org/wiki/Opinion_polling_for_the_2015_United_Kingdom_general_election
- https://en.wikipedia.org/wiki/Norwegian_parliamentary_election,_2013#Opinion_polls
- https://en.wikipedia.org/wiki/Swiss_federal_election,_2015#Opinion_polls
- etc. Just search “wiki opinion polling [country]”
If someone were to make a large, clean dataset of this kind of data, the analysis would be fairly trivial to carry out.