-
Dunkel, C. S., Woodley of Menie, M. A., Pallesen, J., & Kirkegaard, E. O. (2019). Polygenic scores mediate the Jewish phenotypic advantage in educational attainment and cognitive ability compared with Catholics and Lutherans. Evolutionary Behavioral Sciences.

So predictably, our study on Jewish IQ has elicited some rather harsh (and in some cases moralistic) criticisms from people on Twitter. The paper itself is actually doing fairly well, and already has 4100 reads on ResearchGate. Since many claims have been made about the study, it seemed sensible to provide an FAQ of sorts.
Wasn’t your study underpowered, n=53?
Actually, power calculations indicate that our study was well-powered. This is easy to see by the generally small p values in the study. Underpowered studies end up with a lot of borderline p values, i.e. in the region close to 0.05. Our main p values were:
- Correlations among key variables in Table 1, all p<.001.
- The ANOVA tests for Jewish-Gentile gaps in Table 2 have p<.001, .001, .001, .05. Only the weaker similarities test had suspicious results, but we didn’t use this result for much.
- Mediation analysis in Table 3 does not have p values, but it’s obvious from the range of the 95% CI that these must be quite small too.
But really, n=53? That doesn’t sound representative
We had to rely on already existing data to do this analysis. The Wisconsin Longitudinal Study (WLS) was the first dataset we were able to find with a minimally useful Jewish sample, along with PGSs for IQ/education, and a decent IQ test.
As for representativeness, we carried out an analysis to see if modern Wisconsin Jews earn more/less money than those in other states, which would indicate whether this was a representative group. Results indicated Wisconsin was quite average.
But Jesus, n=53, will this even replicate?
While the paper was in review, we found another dataset, Health and Retirement Study (HRS), which also had the necessary variables. Unfortunately, the IQ test is worse. However, our main findings replicated (see the codebook). This dataset has 153 Jews with the right variables.
But, but, n=53 samples! No one else does that!
Something like 50% of social science studies have smaller samples than 53, as seen in e.g. this review, or this one, or this one.
But, seriously, no one does that in human genetics!
You mean, aside from these high impact studies by well known authors?
-
Huerta-Sánchez et al 2014 with n=40 Tibetans and n=40 Han Chinese
- Ilardo et al 2018 with n=33 Saluan and n=43 Bajau, which received widespread media coverage without muh n=43 complaints
- Tucci et al 2018, with n=32 Flores Island individuals.
What didn’t you use population stratification controls?
The polygenic scores were already constructed with standard population stratification controls. See the origin paper:
-
Lee, J. J., Wedow, R., Okbay, A., Kong, E., Maghzian, O., Zacher, M., … & Fontana, M. A. (2018). Gene discovery and polygenic prediction from a genome-wide association study of educational attainment in 1.1 million individuals. Nature genetics, 50(8), 1112.
But why didn’t you use more population stratification controls? Look at this random study which did that
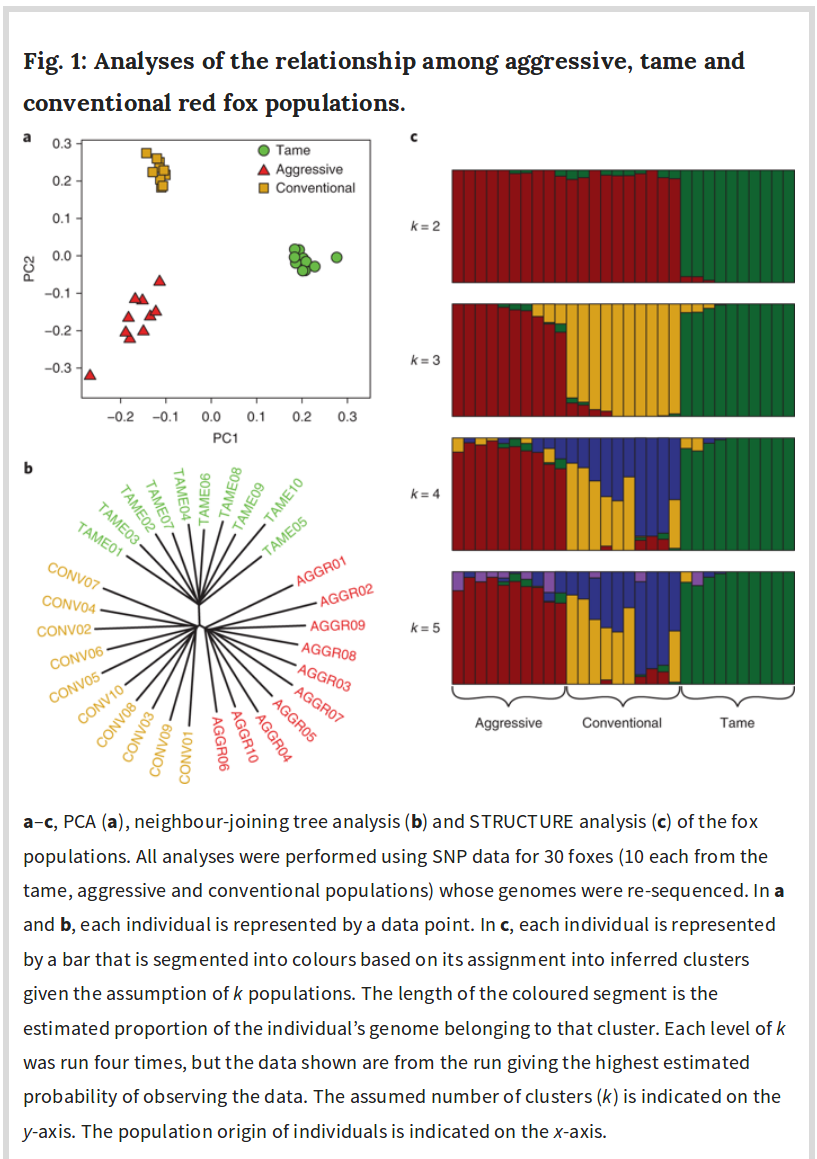
Controlling for population stratification should not be done indiscriminately. The standard method of controlling consists of controlling for a number of principal components (PCs) from the genetic data. These represent the k first genetic dimensions in the data. If the selection signal is strong, the selection signal variance will be included partly or wholly in these PCs and thus removed by the control. An interesting example of this can be seen in a recent genomic study of the Russian silver fox experiment.
-
Kukekova, A. V., Johnson, J. L., Xiang, X., Feng, S., Liu, S., Rando, H. M., … & Beklemischeva, V. (2018). Red fox genome assembly identifies genomic regions associated with tame and aggressive behaviours. Nature ecology & evolution, 2(9), 1479.
Controlling for population stratification assumes the variance associated with this is of no interest, e.g. represents irrelevant environmental causation. This is the genomics equivalent of the sociologist’s fallacy, a kind of indirect way to assume the blank slate view.
Only pseudoscientists don’t use population stratification controls!
Like the ones who just published this large study looking at Ashkenazim genetic susceptibility to Crohn’s disease compared to Gentiles?
- Rivas, M. A., Avila, B. E., Koskela, J., Huang, H., Stevens, C., Pirinen, M., … & Graham, D. (2018). Insights into the genetic epidemiology of Crohn’s and rare diseases in the Ashkenazi Jewish population. PLoS genetics, 14(5), e1007329.
Given that enriched genetic variants in NOD2 and LRRK2 contribute to differences in CD risk in AJ population, we next asked whether unequivocally established common variant associations contribute to differences in CD genetic risk. We performed polygenic risk score (PRS) analysis using reported effect size estimates from 124 CD alleles including those reported in a previously published study[36] and four variants in IL23R from a recent fine-mapping study[37], and excluding variants in NOD2 and LRRK2. We observed an elevated PRS for AJ compared to non-Jewish controls (0.97 s.d. higher, p<10−16; Fig 3A; number of non-AJ controls = 35,007; number of AJ controls = 454), and as expected when performing the PRS analysis using OR calculated from non-Jewish subset of iCHIP data the signal still remains (p<10−16, S7 Fig). We observed a similar trend for the CD samples (0.54 s.d. higher; p<10−16; Fig 3B; number of non-AJ CD cases = 20,652; number of AJ CD cases = 1,938). We demonstrate this is not a systematic property of common risk alleles in AJ by running the same comparison using instead the comparable set of established schizophrenia associated alleles from the Psychiatric Genomics Consortium[38].
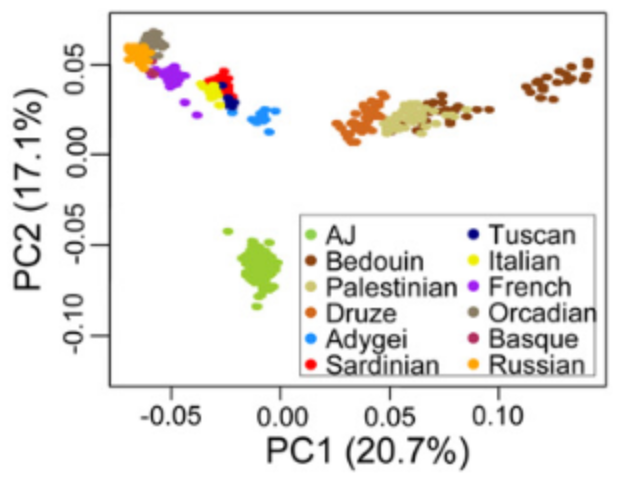
But how do we know the polygenic scores are valid in Ashkenazim?
While we are not aware of any direct validation study, it is known from plant, animal, human and simulation research that polygenic score validity declines as a function of Fst between the training population and the target population (Scutari et al 2016). The Fst difference between Ashkenazim and Central and Northern Europeans is tiny — about 0.06 to 0.08 according to Bray et al 2010 — so we don’t expect any serious decrease in validity.
The plot looks quite similar to the silver fox plot above.
But how about subtle biases in the polygenic score from Lee et al 2018?
Some recent studies have argued that even very subtle genetic stratification in training sets can create quite spurious results. We are aware of these. Indeed, I have been tweeting these studies as they come out — Kerminen et al 2018, Berg et al 2018, and Sohail et al 2018. It is currently not known how large an Fst needs to be before one gets serious issues with subtle biases in training GWASs, or whether one can construct polygenic scores differently to avoid this (e.g. only including top hits). A good candidate for future progress is using PGSs constructed from putative causal SNPs, though these have not yet found widespread use (see supplements in Lee et al 2018). We look forward to future studies examining these issues in more detail.
Why didn’t you do X analysis with the genomic data?
We did not have access to the genomic data for this study. We relied exclusively on precomputed variables, see their website.
I’ve found some other imperfections with your study / the above didn’t convince me
The purpose of our paper was not to provide irrefutable evidence of genetic basis of Ashkenazim intelligence, but to take a first stab at it, and hope that more research will follow so that we can get to the bottom of it. Our critics seem to be operating under a strange view of science where one would only ever publish something that 100% establishes some conclusion, and which no one can find a way to object to, but that’s not how science works. Scientific progress is a series a steps towards resolving a question. Sometimes there’s a big step, sometimes a small one. In this case, a study was needed to break the ice/advance the Overton window, so that others may follow. Our research group is working on multiple new projects related to Ashkenazim intelligence, some of which were inspired by the feedback we have received.
This is not some post hoc defence we made up, it’s right in the paper:
Given the above limitations, we consider the present results to be tentative and in need of replication with better PGS data and larger samples of the Jewish population. Our findings nonetheless yield an initial positive indication of the polygenic selection model and critically indicate that in the case of the Jewish versus non-Jewish Caucasian comparison, the same source of genetic variance that gives rise to of individual differences in GCA also contributes substantially to the group difference.
Where can I learn more?
Immediately following the publication of our study, someone write a good summary of the science of Jewish intelligence on Medium. This 2007 summary by Charles Murray is also good. For a book length piece, Richard Lynn’s 2011 book is worth checking out.
Bonus: 2019 April 1st, external replication published
Davide Piffer has a new study out:
- Piffer, D. (2019). Evidence for Recent Polygenic Selection on Educational Attainment and Intelligence Inferred from GWAS Hits: A Replication of Previous Findings Using Recent Data. Psych, 1(1), 55-75.
It has this figure:

Note that Piffer did not have individual level IQ data, he relied on known/estimated group IQ means, and used the PGS means from his data sources. As such, this is not a direct replication of our study, but close. Not mentioned in the table above, but the Ashkenazi sample here is based on data from ~5000 people (150 full genomes, rest exomes).