It is by now obvious that there are some quite large differences in how much of an impact COVID-19 is having. As usual with social science, the evidence is a bit of a mess and there’s no good randomized controlled trials. With that caveat, here’s some factors that probably contribute to the variation.
Measuring COVID-19 impact
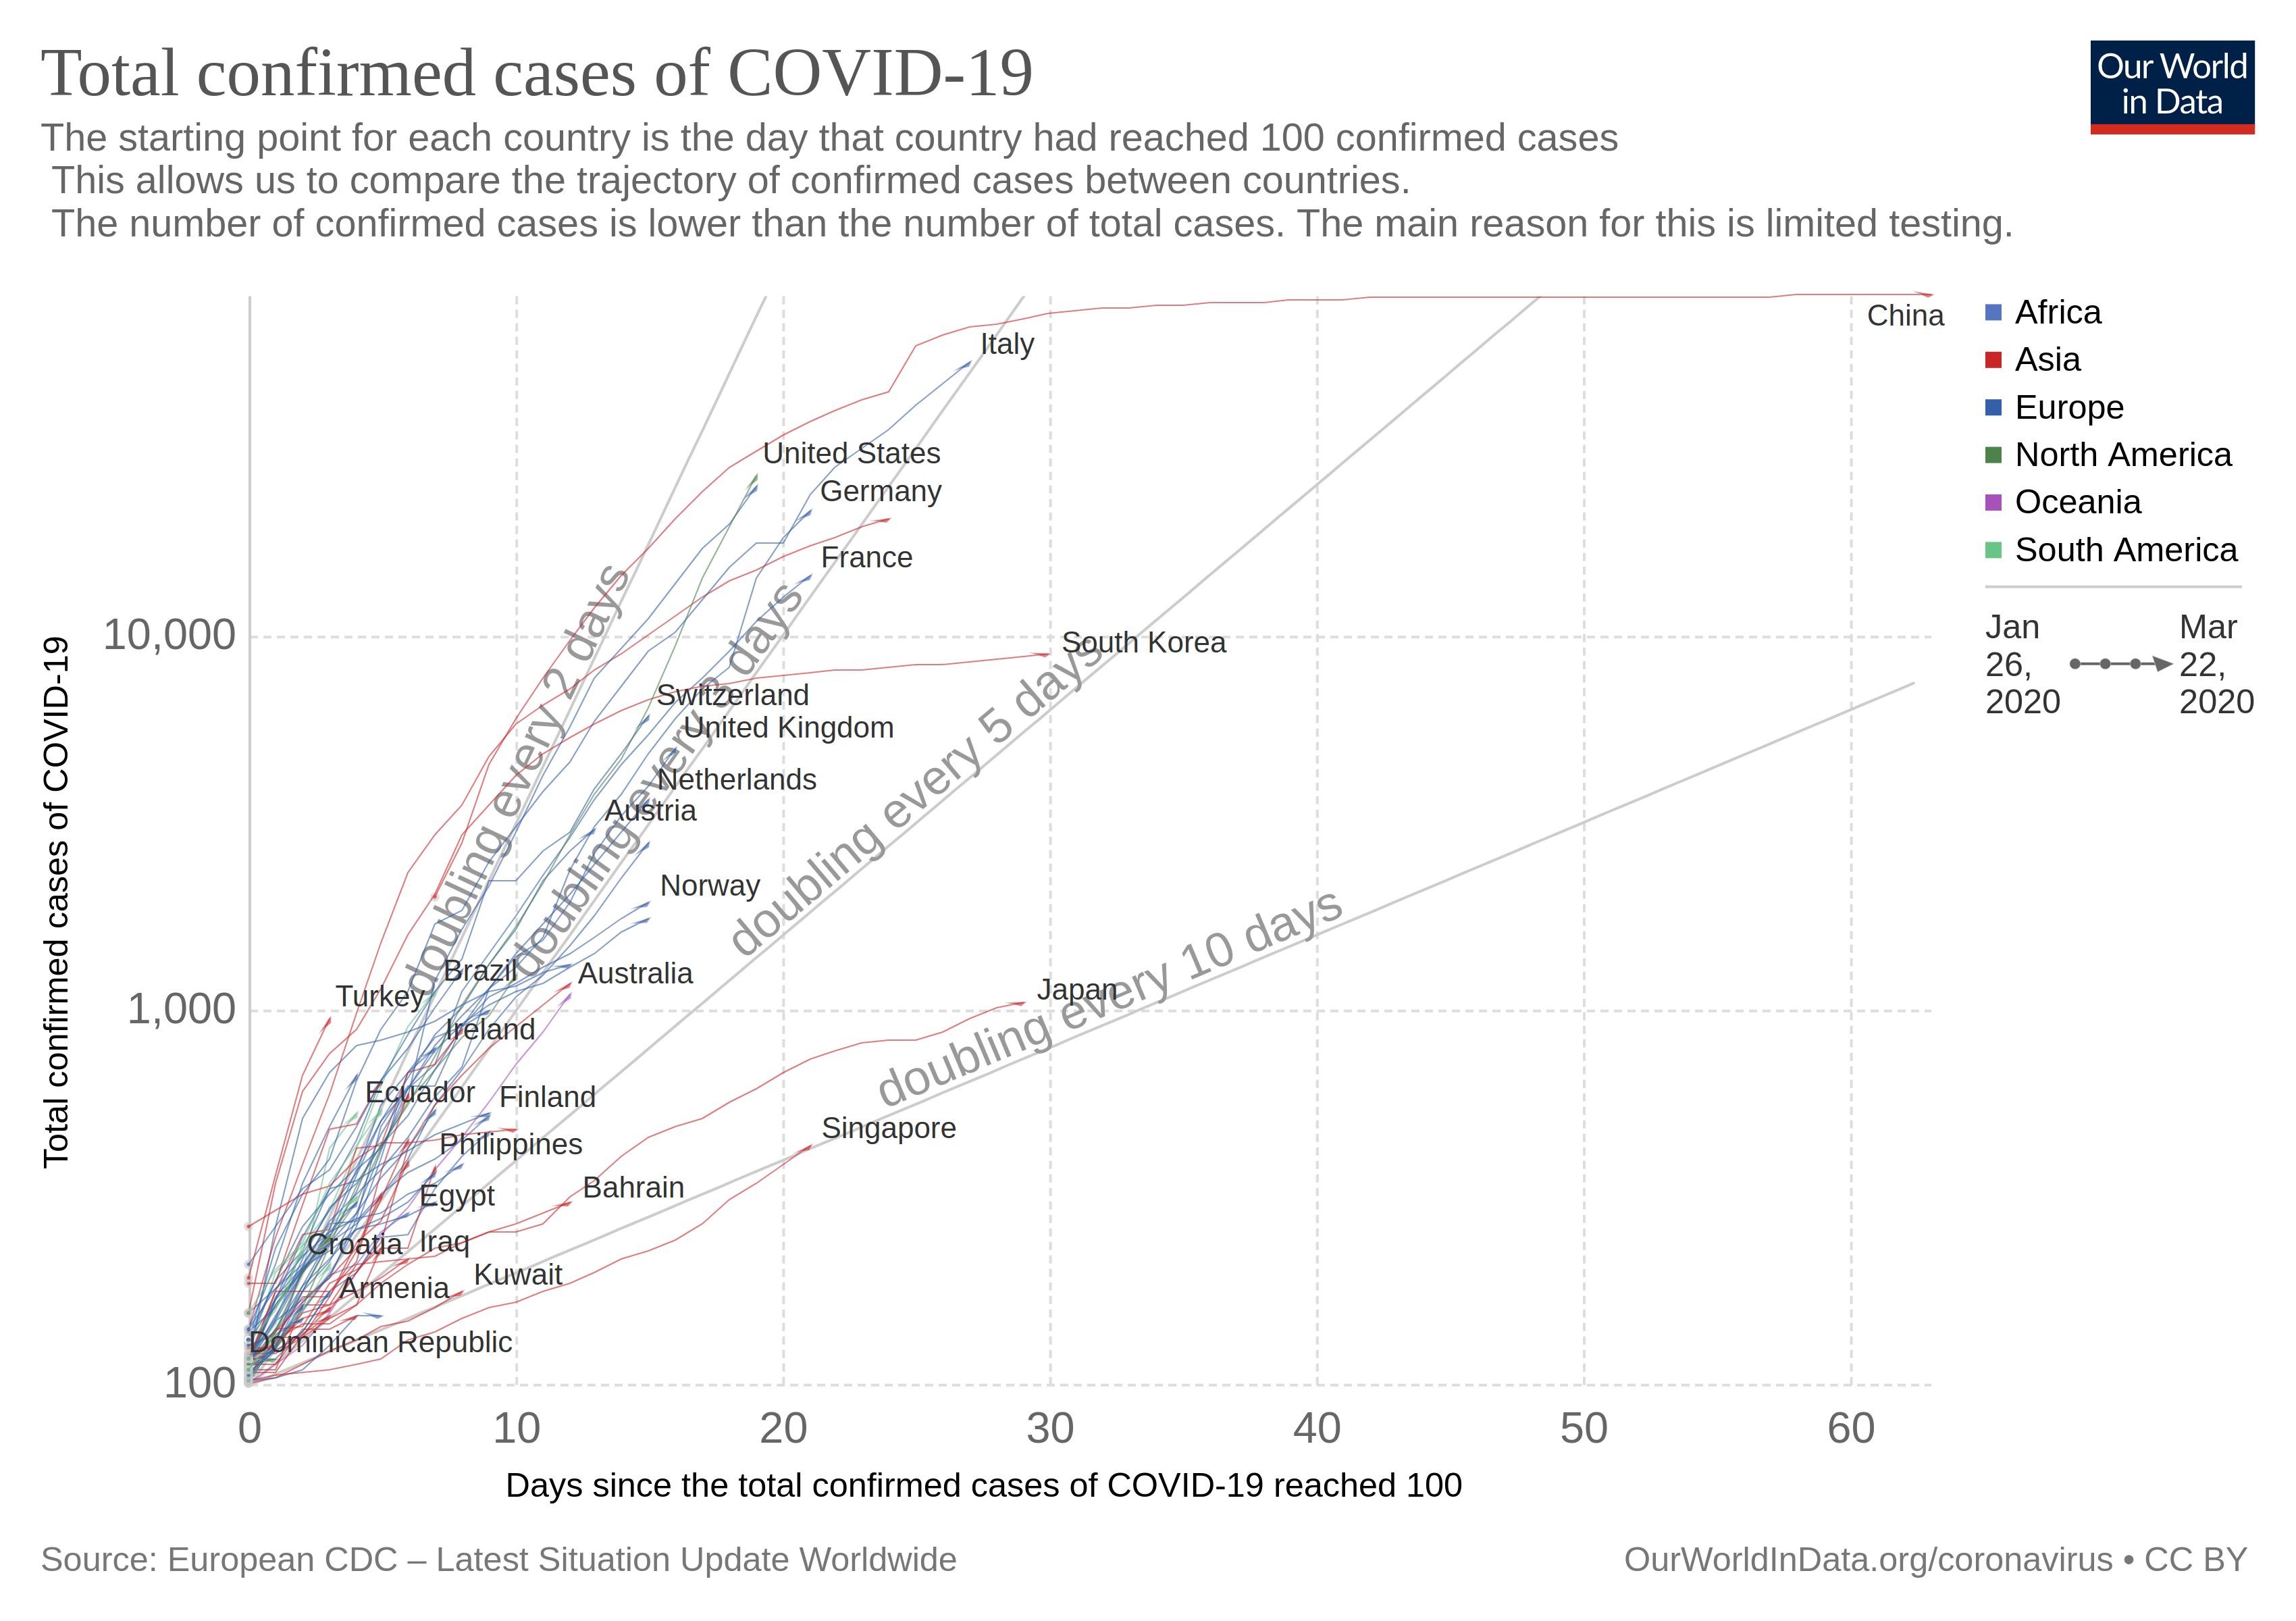
A crude measure is something like this: total cases per capita (all these plots from here):

This kind of data is adjusted for the differences in population size. But we also know that some countries test more broadly than others, and probably use different criteria for whether a case is confirmed or not. This will result in spurious differences between the prevalence. Here’s a figure of testing differences.

OK, so maybe number of cases is not a good metric. What about number of deaths per capita?
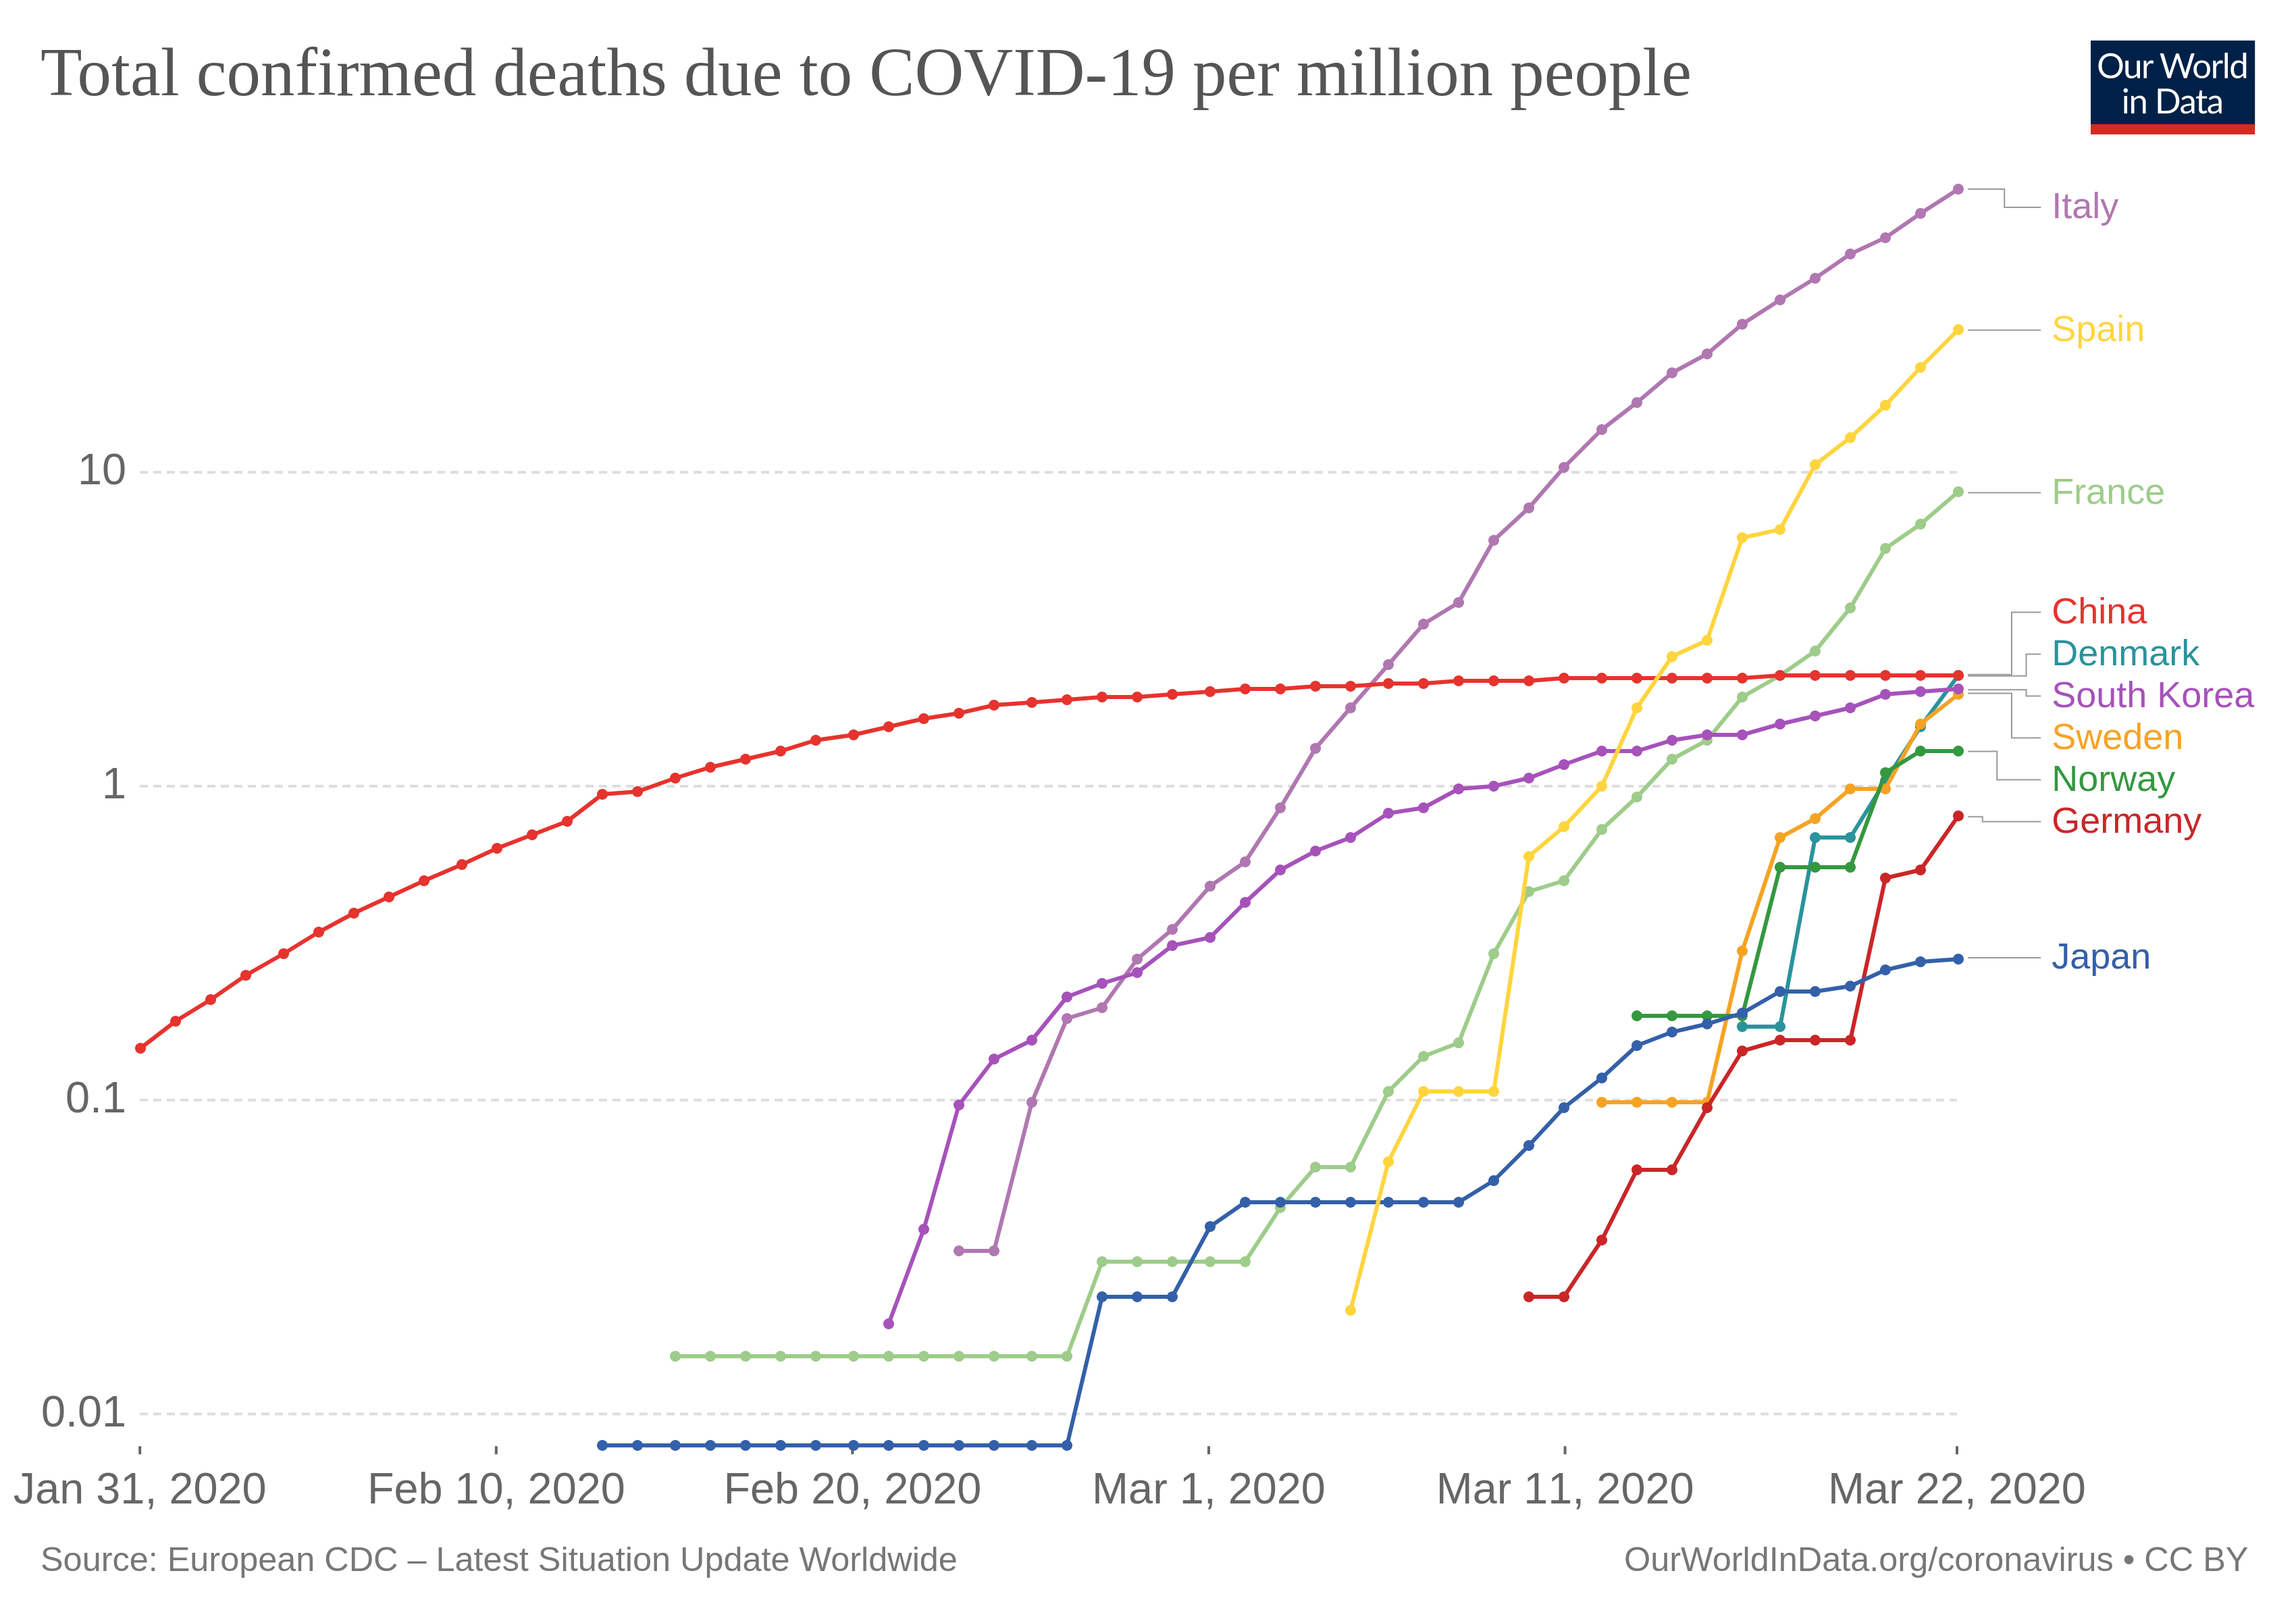
Note the use of log 10 scale! But again, the epidemic started in countries at different times. We would take to take that into account somehow. We can start by looking at days since inception, defined some way or other.
But this is again the faulty measure of confirmed cases, not per capita either! Can we get the above but using population size adjusted and deaths? I couldn’t find it, but I have seen it before on Twitter, so may need to update this post with it. Found it, thanks to Arjen Gerritsen. From this website:

One could take these data, and fit a model to the growth parameter. That parameter will be a sure of how well the country is handling COVID that is adjusted for population size, and days since inception, and probably mostly for degree of testing.
Unfortunately counting deaths is also tricky because of variation in what is included. Sick people die all the time, and some of these also get COVID, but would have died anyway. So COVID didn’t kill them, but they died and were infected at time of death, so probably would be counted in the values we see. Optimally, one would have something like a measure of marginal effect due to epidemic, i.e. additional deaths or hospitalizations in the duration of the epidemic that cannot be explained by normal variation in the last X years. Is there such data? Yeah, EuroMOMO produces these. Let’s look at the data for week 11 of 2020 (March 9 to March 15):

The map shows deviations from normal mortality levels, in z scores, based on recent history of the same countries. So, no one seems to be dying too much this week! OK, maybe due to delayed reporting issues, so what if we look back to weeks prior? No, we get the same non-result. Seemingly, the data indicate there isn’t any serious public health issue compared to normal levels.
But ‘normal levels’? I mean people in Italy are dying of COVID, so if results are within normal, they must be dying of other stuff in prior years too. And that’s what the data show. Here’s the old people deaths by country, last couple of years:

Picture is ugly, but you can make it out. Italy had a big spike in deaths in the end of 2016, but so did many other countries, mostly Mediterranean countries (+Austria). So, apparently these marginal death data tell us there’s nothing much to worry about! And yet we know there’s a massive crisis in Italy. So… 🤔🤔🤔 But moving on!
Between country factors
Lung capacity differences
These differ quite a bit for whatever reason. They are affected by age, sex, height, smoking status, but even controlled for these, there are large differences The metric is this one: Peak expiratory flow (highest velocity of air blown out from lungs using a small test).


Data is from Andreas Backhaus, an economist who computed them from the SHARE dataset and posted on Twitter. This is a massive European study, so these differences are real. One can also find papers that report on global variation e.g. Duong et al 2013.
Climate differences
It’s been reported a number of times, but CV does not seem to spread so easily in higher temperatures, presumably because it dies faster in the air/on materials with higher temperature and humidity. A typical figure goes like this (Sajadi et al 2020, see discussion at Razib Khan blog):

Where the white circles are areas of strong outbreak. We can add now that Spain’s outbreak is largest in the north (Barcelona) but these numbers are not generally in per capita format, and not adjusted for onset either, so it’s hard to say.
National intelligence and technology
Fitzy presents the typical HBD case.

While he didn’t use the best metric above, it is probably alright. We know that better countries handle all kinds of epidemics better. Epidemics are the norm in Africa, mean IQ around 70. HIV spread in Western countries, but not nearly as much as in other places. If we look at HIV prevalence, something like the top 30 countries are all populated mainly by Africans. This cannot be reverse causation because HIV only originated in 1980ish, and the national IQ gaps predate that. The outliers in the bottom right are the East Asian countries. The pattern is much the same if we look at infectious diseases in general:

Countermeasures
All of the above is really just the background. What we really want to know is which countermeasures work well so that we may adopt them. The problem is that statistically, since the use of countermeasures is statistically related to all the other factors — countries do not roll dice to decide which to implement — we would have to have a model that takes them all into account at once, otherwise we get omitted variable bias. If we had such a mode, we could simply look at the estimated benefits of each countermeasure and use that. I haven’t seen any such model, probably it doesn’t exist yet. So what people are doing is taking some index of COVID intensity, cases per capita, deaths per capita, growth in deaths per capita, or some combination of these, and then relating that to countries and seeing what they can guess works. Typically, this means people are looking at East Asian countries, who have fairly similar climate to Western countries, and similar IQs of the populations, and who seem to handle CVOID well. So what are they doing? Suggestions I’ve seen:
- Mass testing: both CV tests, and more proxy tests like fever (temperature) tests
- Use of masks, whether based on bottom-up (people start doing it) or legally mandated
- Closing of public venues (bars, concert halls, restaurants etc.)
- Movement restrictions (curfews)
- Restrictions on gatherings (e.g. fines for more than 10 persons in a room)
- Travel restrictions (mainly bans on tourism)
Probably all of these ideas work to some extent, but that’s not very informative. The various options have very different price tags. Forced closings of restaurants has a massive price tag on the private sector (probably many small companies will go bankrupt), and similar closing of tourism since many sectors and countries are strongly dependent on it (southern Europe).
On the other hand, mass producing and mandating masks seems fairly cheap, and despite the lies in the media (e.g. Time: Health Experts Are Telling Healthy People Not to Wear Face Masks for Coronavirus. So Why Are So Many Doing It?, March 4th), there’s plenty of scientific evidence that masks work: Jefferson et al 2011 in their Cochrane meta-analysis Physical interventions to interrupt or reduce the spread of respiratory viruses found that “Surgical masks or N95 respirators were the most consistent and comprehensive supportive measures.”. Now, their meta-analysis only relied upon 7 studies, and they didn’t use a proper quantitative approach, but tallied the studies with p < .05 results. So, not useless, but also not totally convincing. It stands to reason that restricting the flow of air would have some effect on blocking transmission to others, and perhaps to self.
Mass testing seems decent as well, but I am worried about the test reliabilities. According to Zhuang et al 2020, the tests they used in China had terrible reliability with only ~20% of cases tested positive were actually true positives! (i.e. the posterior AKA positive predictive value). Seemingly, one can machine learn CT test data to get good reliability (Zheng et al 2020), but this data is more difficult to obtain I think.
I generally ascribe to the dictum of try simpler things first. I am happy with our current lockdown in Denmark, but it cannot continue indefinitely. We have to move to a long-term sustainable solution. Vaccines are apparently far into the future and will have unknown effectiveness (many viruses mutate so fast that effective vaccination is very difficult, e.g. HIV). Currently, I would put my money on cheap countermeasures, and continuing the lockdown until we have these in place. Then we can gradually go back to normal while monitoring the prevalence. Monitoring the prevalence will require random sampling with reliable tests. So we need to get a lot of masks, lot of tests (improved ones, or doing multiple testings per person).
Finally, going back to the test reliability. Recall here that the rarer a disease is, the higher the test reliability must be to find it in the noise. So if we can keep Corona infections (ongoing) at e.g. 0.1% prevalence, we must have really good tests to spot these cases if we test random people. The take-away from this low positive predictive value is that many of those cases of claimed asymptomatic cases are probably just false positives. The effect of this bias in testing is that number of mild cases are over-estimated. This means that the r0 (how much the disease spreads) will be over-estimated, and the fatality rate will be under-estimated. We simply need better data to estimate these things.
Mass testing details
I’ve proposed doing mass testing, repeated random samples to follow the prevalence. Steve Sailer echoes my call, which is just an echo of John Ioannidis ditto. Naturally, someone found a way to misinterpret my tweet. What I propose is essentially that we do repeated random samples of chosen demographics. Since cities are the most hit areas, and the easiest to sample (less distance between people, and less distance to test facilities), I suggest we do random samples of these. We could do random samples of parts of cities if desired. We should do these as often as we can afford to, meaning that we have to set aside test capacity to test suspected cases. I also suggest that we do repeated testing of some subset of persons because we need to evaluate the test properties, especially we need to know how often they produce false positives and false negatives. False negatives can be fake in the sense that we may simply be testing the person too early in their illness duration (e.g. on day of infection the viral load will be very load and possibly undetectable by many tests), or they may get sick after we tested them. We need the test property data in order to properly interpret the results from random testing. What all of this will give us is a measure of how well the efforts are going. Especially, it will give us the option of carrying out randomized controlled trials of social policies. For instance, we can order (one part of) city to have a curfew, and we can let another city have regular restrictions. More importantly, there will be some natural variation in social policies due to political diversity (e.g. states/counties/communes/cities make their own rules to some extent). This natural variation can be exploited to infer causal effects BUT only if we have data about the prevalence history in them. Many countries, chiefly the Nordic ones, have databases of citizens that allow precise merging of data. These databases can be used to sample people and merge the results with personal data, such as employment, marriage status, household size, commuting distance (and whether they own a car or use public transport!) and so on.
I realize that this probably will not generally be done, but perhaps it can be done in some cases. There is probably variation in China one could exploit if one had the data.