Abstract
In this commentary I explain how mean differences between normal distributions give rise to different percentages of the populations being above or below a given threshold, depending on where the threshold is.
Introduction
“Research uncovers flawed IQ scoring system” is the headline on phys.org, which often posts news about research from other fields. It concerns a study by Harrison et al (2015). The researchers have allegedly “uncovered anomalies and issues with the Wechsler Adult Intelligence Scale-Fourth Edition (WAIS-IV), one of the most widely used intelligence tests in the world”. An important discovery, if true. Let’s hear it from the lead researcher:
“Looking at the normal distribution of scores, you’d expect that only about five per cent of the population should get an IQ score of 75 or less,” says Dr. Harrison. “However, while this was true when we scored their tests using the American norms, our findings showed that 21 per cent of college and university students in our sample had an IQ score this low when Canadian norms were used for scoring.”
How can it be? To learn more, we delve into the actual paper titled: Implications for Educational Classification and Psychological Diagnoses Using the Wechsler Adult Intelligence Scale–Fourth Edition With Canadian Versus American Norms.
The paper
First they summarize a few earlier studies on Canada and the US. The Canadians obtained higher raw scores. Of course, this was hypothesized to be due to differences in ethnicity and educational achievement factors. However, this did not quite work out, so Harrison et al decided to investigate it more (they had already done so in 2014). Their method consists of taking the scores from a large mixed sample consisting of healthy people — i.e. with no diagnosis, 11% — and people with various mental disorders (e.g. 53.5% with ADHD), and then scoring this group on both the American and the Canadian norms. What did they find?
Blast! The results were similar to the results from the previous standardization studies! What happened? To find out, Harrison et al do a thorough examination of various subgroups in various ways. No matter which age group they compare, the result won’t go away. They also report the means and Cohen’s d for each subtest and aggregate measure — very helpful. I reproduce their Table 1 below:
| Score | M (US) |
SD (US) |
M (CAN) |
SD (CAN) |
p | d | r |
| FSIQ | 95.5 | 12.9 | 88.1 | 14.4 | <.001 | 0.54 | 0.99 |
| GAI | 98.9 | 14.7 | 92.5 | 16 | <.001 | 0.42 | 0.99 |
| Index Scores | |||||||
| Verbal Comprehension | 97.9 | 15.1 | 91.8 | 16.3 | <.001 | 0.39 | 0.99 |
| Perceptual Reasoning | 99.9 | 14.1 | 94.5 | 15.9 | <.001 | 0.36 | 0.99 |
| Working Memory | 90.5 | 12.8 | 83.5 | 13.8 | <.001 | 0.53 | 0.99 |
| Processing Speed | 95.2 | 12.9 | 90.4 | 14.1 | <.001 | 0.36 | 0.99 |
| Subtest Scores | |||||||
| Verbal Subtests | |||||||
| Vocabulary | 9.9 | 3.1 | 8.7 | 3.3 | <.001 | 0.37 | 0.99 |
| Similarities | 9.7 | 3 | 8.5 | 3.3 | <.001 | 0.38 | 0.98 |
| Information | 9.2 | 3.1 | 8.5 | 3.3 | <.001 | 0.22 | 0.99 |
| Arithmetic | 8.2 | 2.7 | 7.4 | 2.7 | <.001 | 0.3 | 0.99 |
| Digit Span | 8.4 | 2.5 | 7.1 | 2.7 | <.001 | 0.5 | 0.98 |
| Performance Subtests | |||||||
| Block Design | 9.8 | 3 | 8.9 | 3.2 | <.001 | 0.29 | 0.99 |
| Matrix Reasoning | 9.8 | 2.9 | 9.1 | 3.2 | <.001 | 0.23 | 0.99 |
| Visual Puzzles | 10.5 | 2.9 | 9.4 | 3.1 | <.001 | 0.37 | 0.99 |
| Symbol Search | 9.3 | 2.8 | 8.5 | 3 | <.001 | 0.28 | 0.99 |
| Coding | 8.9 | 2.5 | 8.2 | 2.6 | <.001 | 0.27 | 0.98 |
Sure enough, the scores are lower using the Canadian norms. And very ‘significant’ too. A mystery.
Next, they go on to note how this sometimes changes the classification of individuals into 7 arbitrarily chosen intervals of IQ scores, and how this differs between subtests. They spend a lot of e-ink noting percents about this or that classification. For instance:
“Of interest was the percentage of individuals who would be classified as having a FSIQ below the 10th percentile or who would fall within the IQ range required for diagnosis of ID (e.g., 70 ± 5) when both normative systems were applied to the same raw scores. Using American norms, 13.1% had an IQ of 80 or less, and 4.2% had an IQ of 75 or less. By contrast, when using Canadian norms, 32.3% had an IQ of 80 or less, and 21.2% had an IQ of 75 or less.”
I wonder if some coherent explanation can be found for all these results. In their discussion they ask:
“How is it that selecting Canadian over American norms so markedly lowers the standard scores generated from the identical raw scores? One possible explanation is that more extreme scores occur because the Canadian normative sample is smaller than the American (cf. Kahneman, 2011).”
If the reader was unsure, yes, this is Kahneman’s 2011 book about cognitive biases and dual process theory.
They have more suggestions about the reason:
“One cannot explain this difference simply by saying it is due to the mature students in the sample who completed academic upgrading, as the score differences were most prominent in the youngest cohorts. It is difficult to explain these findings simply as a function of disability status, as all participants were deemed otherwise qualified by these postsecondary institutions (i.e., they had met normal academic requirements for entry into regular postsecondary programs). Furthermore, in Ontario, a diagnosis of LD is given only to students with otherwise normal thinking and reasoning skills, and so students with such a priori diagnosis would have had otherwise average full scale or general abilities scores when tested previously. Performance exaggeration seems an unlikely cause for the findings, as the students’ scores declined only when Canadian norms were applied. Finally, although no one would argue that a subset of disabled students might be functioning below average, it is difficult to believe that almost half of these postsecondary students would fall in this IQ range given that they had graduated from high school with marks high enough to qualify for acceptance into bona fide postsecondary programs. Whatever the cause, our data suggest that one must question both the representativeness of the Canadian normative sample in the younger age ranges and the accuracy of the scores derived when these norms are applied.”
And finally they conclude with a recommendation not to use the Canadian norms for Canadians because this results in lower IQs:
Overall, our findings suggest a need to examine more carefully the accuracy and applicability of the WAIS-IV Canadian norms when interpreting raw test data obtained from Canadian adults. Using these norms appears to increase the number of young adults identified as intellectually impaired and could decrease the number who qualify for gifted programming or a diagnosis of LD. Until more research is conducted, we strongly recommend that clinicians not use Canadian norms to determine intellectual impairment or disability status. Converting raw scores into Canadian standard scores, as opposed to using American norms, systematically lowers the scores of postsecondary students below the age of 35, as the drop in FSIQ was higher for this group than for older adults. Although we cannot know which derived scores most accurately reflect the intellectual abilities of young Canadian adults, it certainly seems implausible that almost half of postsecondary students have FSIQ scores below the 16th percentile, calling into question the accuracy of all other derived WAIS-IV Canadian scores in the classification of cognitive abilities.
Are you still wondering what it going on?
Populations with different mean IQs and cut-offs
Harrison et al seems to have inadvertently almost rediscovered the fact that Canadians are smarter than Americans. They don’t quite make it to this point even when faced with obvious and strong evidence (multiple standardization samples). They somehow don’t realize that using the norms from these standardization samples will reproduce the differences found in those samples, and won’t really report anything new.
Their numerous differences in percents reaching this or that cut-off are largely or entirely explained by simple statistics. They have two populations which have an IQ difference of 7.4 points (95.5 – 88.1 from Table 1) or 8.1 points (15 * .54 d from Table 1). Now, if we plot these (I used a difference of 7.5 IQ) and choose some arbitrary cut-offs, like those between arbitrarily chosen intervals, we see something like this:
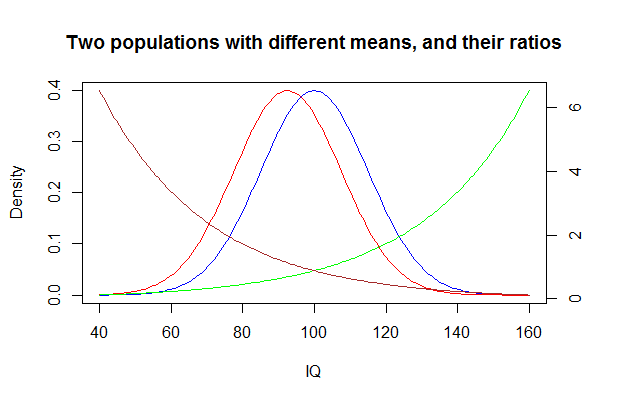
Except that I cheated and chose all the cut-offs. The brown and the green lines are the ratios between the densities (read off the second y-axis). We see that around 100, they are generally low, but as we get further from the means, they get a lot larger. This simple fact is not generally appreciated. It’s not a new problem, Arthur Jensen spent much of a chapter in his behemoth 1980 book on the topic, he quotes for instance:
“In the construction trades, new apprentices were 87 percent white and 13 percent black. [Blacks constitute 12 percent of the U.S. population.] For the Federal Civil Service, of those employees above the GS-5 level, 88.5 percent were white, 8.3 percent black, and women account for 30.1 of all civil servants. Finally, a 1969 survey of college teaching positions showed whites with 96.3 percent of all posi tions. Blacks had 2.2 percent, and women accounted for 19.1 percent. (U.S. Commission on Civil Rights, 1973)”
Sounds familiar? Razib Khan has also written about it. Now, let’s go back to one of the quotes:
“Using American norms, 13.1% had an IQ of 80 or less, and 4.2% had an IQ of 75 or less. By contrast, when using Canadian norms, 32.3% had an IQ of 80 or less, and 21.2% had an IQ of 75 or less. Most notably, only 0.7% (2 individuals) obtained a FSIQ of 70 or less using American norms, whereas 9.7% had IQ scores this low when Canadian norms were used. At the other end of the spectrum, 1.4% of the students had FSIQ scores of 130 or more (gifted) when American norms were used, whereas only 0.3% were this high using Canadian norms.”
We can put these in a table and calculate the ratios:
| IQ threshold | Percent US | Percent CAN | US/CAN | CAN/US |
| 130 | 1.4 | 0.3 | 4.67 | 0.21 |
| 80 | 13.1 | 32.3 | 0.41 | 2.47 |
| 75 | 4.2 | 21.2 | 0.20 | 5.05 |
| 70 | 0.7 | 9.7 | 0.07 | 13.86 |
And we can also calculate the expected values based on the two populations (with means of 95.5 and 88) above:
| IQ threshold | Percent US | Percent CAN | US/CAN | CAN/US |
| 130 | 1.07 | 0.26 | 4.12 | 0.24 |
| 80 | 15.07 | 29.69 | 0.51 | 1.97 |
| 75 | 8.59 | 19.31 | 0.44 | 2.25 |
| 70 | 4.46 | 11.51 | 0.39 | 2.58 |
This is fairly close right? The only outlier (in italic) is the much lower than expected value for <70 IQ using US norms, perhaps a sampling error. But overall, this is a pretty good fit to the data. Perhaps we have our explanation.
What about those (mis)classification values in their Table 2? Well, for similar reasons that I won’t explain in detail, these are simply a function of the difference between the groups in that variable, e.g. Cohen’s d. In fact, if we correlate the d vector and the “% within same classification” we get a correlation of -.95 (-.96 using rank-orders).
MCV analysis
Incidentally, the d values report in their Table 1 are useful for using the method of correlated vectors. In a previous study comparing US and Canadian IQ data, Dutton and Lynn (2014) compared WAIS-IV standardization data. They found a mean difference of .31 d, or 4.65 IQ, which was reduced to 2.1 IQ if the samples were matched on education, ethnicity and sex. An interesting thing was that the difference between the countries was largest on the most g-loading subtests. When this happens, it is called a Jensen effect (or that it has a positive Jensen coefficient, Kirkegaard 2014). The value in their study was .83, which is on the high side (see e.g. te Nijenhuis et al, 2015).
I used the same loadings as used in their study (McFarland, 2013), and found a correlation of .24 (.35 with rank-order), substantially weaker.
Supplementary material
The R code and data files can be found in the Open Science Framework repository.
References
- Harrison, A. G., Holmes, A., Silvestri, R., Armstrong, I. T. (2015). Implications for Educational Classification and Psychological Diagnoses Using the Wechsler Adult Intelligence Scale–Fourth Edition With Canadian Versus American Norms. Journal of Psychoeducational Assessment. 1-13.
- Jensen, A. R. (1980). Bias in Mental Testing.
-
Kirkegaard, E. O. (2014). The personal Jensen coefficient does not predict grades beyond its association with g. Open Differential Psychology.
- McFarland, D. (2013). Model individual subtests of the WAIS IV with multiple latent
factors. PLoSONE. 8(9): e74980. doi:10.1371/journal.pone.0074980 -
te Nijenhuis, J., van den Hoek, M., & Armstrong, E. L. (2015). Spearman’s hypothesis and Amerindians: A meta-analysis. Intelligence, 50, 87-92.