Published to The Winnower 2015/10/20.
A properly formatted PDF of this paper can be downloaded here (not sized to A4 sheets).
Abstract
Two new approaches to spatial autocorrelation (SAC) were examined for their ability to measure SAC: correlation of distance scores and k nearest spatial neighbor regression. Furthermore, the methods were compared to a more traditional measure of SAC, Moran’s I. All methods were found to give similar results as measured by their intercorrelations.
Three approaches, correlation of distance scores, k nearest spatial neighbor regression and spatial local regression, were used on simulated datasets to see if they could successfully distinguish between a true and a spurious cause. The correlation of distances approach was found to be lacking, while the other two methods clearly distinguished between the spurious and true causes and gave similar results.
Key words: spatial autocorrelation, Moran’s I, correlation of distances, k nearest spatial neighbor regression, KNSNR, spatial local regression, SLR.
1. Introduction
Much research analyzes data from countries, states, weather stations or other units have that a location. Spatial autocorrelation (SAC) is when there are spatial patterns in the dataset (Hassall & Sherratt, 2011; Radil, 2011). This can be both positive (nearby cases are similar), neutral (neighbor cases have no particular relationship, absence of SAC), or negative (nearby cases are dissimilar). Figure 1 illustrates this.

Figure 1: Illustrations of spatial autocorrelation. From (Radil, 2011).
The presence of SAC in a dataset means that the cases are not independent which means that the degrees of freedom are overestimated. There are methods for correcting the degrees of freedom, but these are not the focus of this paper (Gelade, 2008; Hassall & Sherratt, 2011). Instead, the purpose of this article is to explore ways to measure and correct for SAC with respect to effect sizes.
2. Correlation of distances method
A conceptually simple method for examining SAC is the correlation of distance scores method (CD). CD was used by Davide Piffer (Piffer, 2015) but is so simple that it would be surprising if it had not been thought of before. The first step is to calculate distance scores for all cases for all variables of interest. Note that the kind of distance score depends on the type of variable. Piffer analyzed, among other things, phylogenetic distances (genetic distance between two organisms or classes of organisms) and used Fst values. However, if one’s data concern e.g. countries, one would use spherical geometric distances. If one is analyzing data from flatland (of any hyperspace with flat planes), one could use euclidean distances. For single metric type variables, one could use the absolute difference. Alternatively, one could combine several non-spatial variables and employ various well-researched distance measures such as complete linkage (James, Witten, Hastie, & Tibshirani, 2013, p. 401).
The distance scores results in a new dataset which has N(N-1)/2 cases (choose 2 of N, order irrelevant), where N is the number of cases in the original dataset.
The idea behind the method is that given two variables that are linearly related, pairs of cases that are far from each other on one variable should also be far from each other on another variable. To better understand this, it is worth looking at some example data. Figure 2 shows the spatial distribution of some datapoints in flatland. An outcome variable also exists and is shown by color coding.

Figure 2: Dataset 1. Flatland and outcome.
There are clear spatial patterns in the data: 1) we see 5 fairly distinct clusters, 2) neighbors tend to have similar outcomes, and 3) points with higher x and y values tend to have higher outcome values.
Using the distance scores, one can examine (2) with a standard Pearson correlation, as shown in Figure 3.

Figure 3: Scatter plot of distance scores for spatial and outcome.
As expected we see a positive correlation, i.e. cases closer to each other do have more similar outcomes. We also see substantial non-linearity in the plot. This is because the cases are not uniformly spatially distributed and that distances between all pairs of cases are used.
If one wants to control for SAC, one can use standard statistical methods such as multiple regression or semi-partial correlations. Suppose one has a predictor that is spatially distributed as shown in Figure 4.

Figure 4: Dataset 1. Flatland and predictor.
We see that there is some similarity to Figure 2, but it is not immediately obvious whether the relationship owes to a pattern at the cluster-level or whether the pattern is general. In the original data the correlation between predictor and outcome is .66 and using CD it is .36.
The semi-partial correlation between predictor and outcome is .13, a fair bit lower than .36, which gives us some evidence that the relationship owes much of its size to the cluster pattern. If one instead uses multiple regression the standardized betas are .16 and .36 for predictor and spatial distance, respectively. In fact, the true correlation of predictor and outcome once SAC is taken into account is near 0. The relationship between them is purely due to their common association with the clusters we see (common cause scenario).
2.1. A second dataset
What about a similar situation where the relationship between predictor and outcome is not spurious? Consider the data in Figures 5 and 6.

Figure 5: Dataset 2. Flatland and outcome.

Figure 6: Dataset 2. Flatland and predictor.
We see the same overall pattern as before, but it is subtly different. The correlation in the original dataset between predictor and outcome is nearly the same, .68 vs. .66 before. However, using the distance scores, the correlation between outcome and spatial distance is only .17 vs. .45 before. The distance-based correlation between predictor and outcome is .43 vs. .36 before.
The semi-partial correlation for predictor and outcome correcting the latter for spatial distance is .39 vs. .13 before. A fairly large difference. Using multiple regression the betas are .42 and .04 for predictor and spatial distance, respectively.
Clearly, the distance scores approach shows that the association between predictor and outcome is different in the two datasets.
2.2. The relationship between correlations of distances and correlations in the original data
Before we go further, it is worth examining the relationship between correlations of distance data and correlations of the original data. From my experimentation, correlations of distance scores seem to be an r2-type statistic (Hunter & Schmidt, 2004, p. 189). This can be seen if one simulates normally distributed data with a known correlation and then correlate their distance scores. The results are shown in Figure 7.

Figure 7: Comparison of r, CD and r2.
As can be seen, the correlation of distance scores is almost exactly the same as the square of the correlation, or conversely, the square root of the correlation of distance scores is almost the same as the original correlation score.
Going back to the results in the previous section, this means that we need to take the square root of the semi-partial correlations and standardized betas to get an r-type measure. These values are shown in Table 1.
|
Relationship |
Dataset 1 |
Dataset 2 |
|
r (predictor x outcome), original data |
.66 |
.68 |
|
sqrt. r (predictor x outcome), distance data |
.60 |
.66 |
|
sqrt. r (spatial x outcome), distance data |
.67 |
.41 |
|
sqrt. rsp (predictor x outcome, spatial), distance data |
.36 |
.62 |
|
sqrt. beta (predictor x outcome), distance data |
.40 |
.65 |
|
sqrt. beta (spatial x outcome), distance data |
.60 |
.20 |
Table 1: Table of numbers from datasets 1 and 2.
There are several things worth noting. 1) The square root conversion seems to work because the distance-based correlations are similar to the ones based on the original data. 2) Distance-based correlations were higher for the first dataset as expected. 3) Semi-partial correlations of distance-data showed that the predictor had a substantial size (.36) in the first dataset despite this relationship being entirely spurious. However, it did correctly indicate a stronger effect in the second dataset (.62). 4) Similarly, multiple regression showed that the predictor had substantial validity in the first dataset and reversely that spatial distance had some validity in the second dataset. Neither should be the case. On the positive side, in both cases did the true causes have larger effect sizes (.60>.40; .65>.20).
3. k nearest spatial neighbors regression
Given the problems of the CD method, I developed a new method. It is a variant of the general approach of using the neighboring points to predict values, called k nearest neighbors (KNN) (James et al., 2013). The implementations of KNN I could find for R did not support spatial data, so I wrote my own implementation which I dub k nearest spatial neighbors regression (KNSNR) The approach is fairly simple:
-
For each case, calculate the distance (spherical, euclidean or otherwise) to each every other case.
-
For each case, find the k nearest neighbor cases.
-
For each case, calculate the mean value of the neighbors’ scores and use that as the prediction.
One can alter k in (2) to tune the method. This value should probably be found thru cross-validation (James et al., 2013).
(3) can be altered to make more advanced versions such as taking into account the relative distances among the nearest neighbors (closer neighbors are more important) or the case weights (if using aggregated data or uncertain data).
The function I wrote will output one of four things: 1) predicted values, 2) correlation of actual values with predicted values, 3) residuals, and 4) the correlation of a predictor with the residuals of the outcome. Each has its use.
The correlation of actual values with predicted values is a measure of the SAC in a given variable. It corresponds to the correlation of a given variable and spatial distance when using distance data. Which k is the right to use? It depends. What k does here is change the zoom level. The value at each k tells you how much SAC there is in the dataset given a particular level of zooming in on every case. Figure 8 shows the amount of SAC in the outcome variable according to the first 100 values of k for multiple datasets.

Figure 8: The amount of SAC in datasets 1-6 according to KNSNR at a k 1-100.
In general, k should be larger than 1. k=3 often works well. k reached plateaus for datasets 1-2 around k=10. For these datasets k=50 makes more sense because there are 50 cases in each cluster. At all levels, however, do we see that SAC is stronger for the odd numbered datasets, just as was found using CD.
The predicted scores from KNSNR can be used in a multiple regression model where they can compete with other variables. The residuals can be correlated with a predictor to easily perform semi-partial correlation with SAC controlled for in the chosen variable. The semi-partial correlation between predictor and outcome controlling outcome for SAC in the first dataset is .01 while it is .42 in the second dataset (using k=50). In other words, the method tells us that the without SAC in the outcome the predictor doesn’t work in the first dataset, but it does in the second. The semi-partial correlations of spatial prediction x outcome controlled for predictor are .34 and .01, for the first and second datasets respectively. In other words, spatial proximity retains predictive value once the predictor has been controlled, showing that there is an additional unmeasured cause with strong SAC. All four results are good because they are in line with how the data were generated.
4. A different kind of spatial autocorrelation
The previous examples were easy in the sense that the data pretty clearly contained clusters of points. One could have easily classified the cases into the regional/island clusters and used a more traditional approach to the question: multi-level analysis. In simple terms, one would look whether relationship found in the pooled data holds when analyzing the data within each cluster. Table 2 shows these results.
|
Cluster |
Dataset 1 |
Dataset 2 |
|
1 |
-0.176 |
0.511 |
|
2 |
-0.094 |
0.615 |
|
3 |
-0.037 |
0.5 |
|
4 |
0.117 |
0.511 |
|
5 |
0.162 |
0.617 |
Table 2: Correlations inside clusters in datasets 1-2.
Clearly, the datasets are markedly different in that there is a near-zero relationship inside the clusters in the first, but there are fairly strong relationships in the second.
When results give discrepant results across levels, it is termed Simpson’s paradox. Not understanding this concept has lead to bogus claims of sex discrimination at least twice (Albers, 2015; Kievit, Frankenhuis, Waldorp, & Borsboom, 2013). An interactive visualization of the phenomenon can be found at: http://emilkirkegaard.dk/understanding_statistics/?app=Simpson_paradox
Clearly we did not need to use SAC to spot the difference between datasets 1-2. However, the datasets are unusual in that they permit very easy clustering of the cases. Real life datasets are often more difficult to deal with. Consider datasets 3-4 shown in Figures 9-12.

Figure 9: Dataset 3. Flatland and outcome.

Figure 10: Dataset 3. Flatland and predictor.

Figure 11: Dataset 4. Flatland and outcome.

Figure 12: Dataset 4. Flatland and predictor.
These datasets are variations of datasets 1-2, yet now the clusters are not easy to spot. One would not be able to use a simple clustering algorithm on the spatial data to sort them into 5 clusters correctly. If one cannot do that, one cannot use the standard multi-level approach because it requires discrete levels.
The correlations between the predictors and outcomes is in fact identical to before: .66 and .68 respectively. These correlations are generated in the same way as before, meaning that the first is a spurious, SAC induced correlate, while the second is a true cause. The datasets still contain a sizable amount of SAC as was seen in Figure 8, so one might still wonder how this affects the results. Using the semi-partial SAC control approach, the results are .15 and .46 respectively. Should the number .15 be closer to 0? Not exactly.
To understand why, I need to be more explicit about how the data were simulated. In the odd numbered datasets, the outcome and predictor variables are both a function of the clusters, which serve is a SAC variable (SACV). In the even numbered datasets, the predictor is a function of the clusters + noise and the outcome is a function of the predictor + noise. Figure 13 shows the path models.

Figure 13: Path models for the example datasets.
The difference between datasets 1-2 and 3-4 is solely that the within cluster spatial variation was increased from standard deviation=6 to 15. This weakens the SAC in the data and thus the effect of controlling for SAC. The results are thus in line with expectations.
Still, we would like paired examples that appear similar – i.e. has similar r (predictor x outcome) – but where the first effect is spurious and the second is real and that our methods correctly identify this. To do this, I created two more datasets. This time there are no a priori clusters.
The generation proceeded like this:
-
For each case:
-
Sample two values from the uniform distribution of numbers between 1 and 100 and use these as x and y coordinates.
-
Sample a number from a standard normal distribution and use it as the score for the SACV.
-
-
Induce SAC in the SACV using a KNSN-type approach.
After this, I proceeded similarly to before, namely by creating two variables, predictor and outcome, according to the path models shown in Figure 13. Noise were added to hit a target uncorrected correlation of .66, similar to datasets 1-4. Because the SACV variable has strong SAC, controlling for SAC decreases the correlation in the spurious cause scenario because path goes thru the SACV, but not in the true cause scenario where causation is directly from predictor to outcome.
It is worth going into more detail about how SAC was induced. The algorithm works as follows:
-
For each iteration:
-
For each case:
-
Find the k nearest spatial neighbors.
-
Find the mean value of the chosen variable for these neighbors.
-
-
For each case:
-
Change the value of the datapoint to (1-w) times its current value and w times the mean value of its neighbors.
-
-
(a) and (b) must proceed in this fashion otherwise the order of the cases would affect the algorithm. The algorithm requires values for the three parameters: i, k and w. i determines the number of iterations the algorithm goes thru. k control the number of neighbors taken into account and w controls the relative weight given to the value from the neighbors. Smaller k means the SAC pattern will be more local, while both i and w makes the SAC stronger but in different ways. The parameters used for datasets 5 and 6 were i=20, k=10, w=1/3.
Figures 14 to 17 show the spatial layout as well as predictor and outcome values for datasets 5-6.

Figure 14: Example 5. Flatland and outcome.

Figure 15: Example 5. Flatland and predictor.

Figure 16: Example 6. Flatland and outcome.

Figure 17: Example 6. Flatland and predictor.
From just inspecting the spatial plots, it is not easy to see a marked difference between datasets 5 and 6. Both datasets clearly show some degree of SAC. Figures 18 and 19 show the regressions between predictor and outcome.

Figure 18: Scatter plot for predictor and outcome in dataset 5.

Figure 19: Scatter plot for predictor and outcome in dataset 6.
Altho not identical, there do not seem to be marked differences between the datasets. Thus, one could not tell the situations apart by simple inspection. There are also no obvious clusters one could classify cases into and use multi-level analysis.
However, if we examine the strength of SAC in the datasets, they are fairly different as shown in Table 3.
|
Variable |
Dataset 5 |
Dataset 6 |
|
SACV |
0.998 |
0.998 |
|
x |
0.999 |
0.999 |
|
y |
0.998 |
0.998 |
|
predictor |
0.758 |
0.632 |
|
outcome |
0.794 |
0.365 |
|
outcome_predictor_resids |
0.28 |
-0.035 |
Table 3: SAC in datasets 5 and 6. SAC calculated using k=10 because data were generated using k=10.
Unsurprisingly, the coordinate variables and the SACV show extreme levels of SAC. The predictors diverge a bit in SAC, while the difference in SAC for the outcome variables is fairly large. This is as expected given the way the data were generated. In dataset 6, the outcome variable is 2 steps away from SACV, while it is only 1 step away in dataset 5. Also worth noting is the SAC in the model residuals in dataset 5, which was discussed by (Hassall & Sherratt, 2011) as indicating a problem. This indicates that one or more causes not included in the model are SAC.
The correlations with the predictor after controlling the outcome for SAC are .08 and .49 for datasets 5 and 6, respectively showing that the method can successfully detect which association is due to an uncontrolled common cause which is SAC.
4.1. Control outcome, predictor or both for SAC?
So far I have only presented results where the outcome was controlled for SAC. However, one might also control the predictor or both. It is not immediately clear to me which one is the best. For this reason, I tried all three side by side. Table 4 shows the results.
|
Dataset |
k3_o |
k3_p |
k3_b |
k10_o |
k10_p |
k10_b |
k50_o |
k50_p |
k50_b |
|
1 |
0.17 |
0.17 |
0.07 |
0.04 |
0.04 |
-0.01 |
0.01 |
0.01 |
0.02 |
|
2 |
0.57 |
0.57 |
0.58 |
0.45 |
0.45 |
0.53 |
0.42 |
0.42 |
0.54 |
|
3 |
0.3 |
0.3 |
0.27 |
0.19 |
0.19 |
0.24 |
0.15 |
0.15 |
0.24 |
|
4 |
0.6 |
0.6 |
0.61 |
0.52 |
0.52 |
0.58 |
0.46 |
0.46 |
0.56 |
|
5 |
0.18 |
0.18 |
0.07 |
0.08 |
0.08 |
0.03 |
0.27 |
0.27 |
0.36 |
|
6 |
0.57 |
0.57 |
0.57 |
0.49 |
0.49 |
0.55 |
0.51 |
0.51 |
0.59 |
Table 4: KNSN regression results, controlling either or both variables with three different k values. The number is the value of k used, the letter indicators which variable was controlled for SAC: p=predictor, o=outcome, b=both.
We see some interesting patterns. When k is 3 or 10, controlling both variables tends to reduce the correlation further in the datasets with spurious causes, but not in the datasets with real causes. When using k=50, controlling both actually tends to make the results stronger for both true and spurious causes.
The most important comparison is that between datasets 5 and 6 because these are the most realistic datasets. When using an appropriate k (3 or 10), we see that controlling both reduces the spurious correlations (.18 to .07; .08 to .03) but either leaves unchanged or increases the true cause correlation (.57 to .57; .49 to .55). For this reason, it would seem best to control both predictor and outcome variables provided one has a reasonable idea about the correct k to use.
4.1.1. Multiple regression
There is another way to control for a variable, namely multiple correlation. However, because the predicted values from KNSNR were often very similar (r>.7) to the predictor, this was not very useful. Therefore, if one does use the MR approach one should pay attention to multicollinearity in the models, e.g. by means of the variable inflation factor (Field, 2013; Gordon, 2015).
5. Spatial local regression
Local regression is a method related to the k nearest neighbor regression. The idea of local regression is that instead of fitting a model to all the predictor data, one fits the model for every case and weigh the nearby cases more than the distant cases. Afterwards we combine the models. The result of this is a smooth fit to the data. Figure 20 shows as illustration of this.
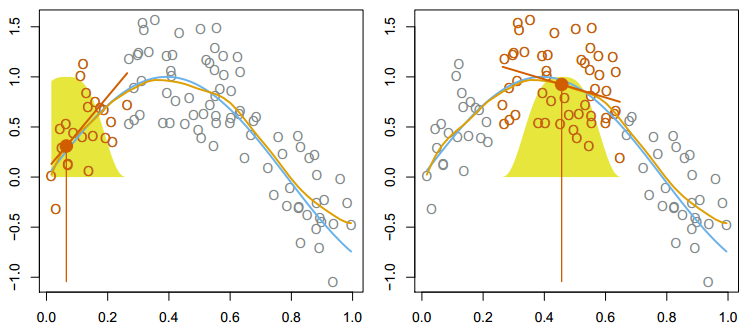
Figure 20: Local regression. At each point, a model is fit. Only nearby cases are used to fit and they are weighted by their distance such that the more distant cases weigh less. Copied from (James et al., 2013, p. 285).
In the above case, the distance measure for the cases is their absolute difference on the predictor variable. However, one could also use spatial distance, a method one might call spatial local regression (SLR). In this way, one would fit a regression for each case and use only the cases that are spatially nearby and finally aggregate/meta-analyze the results. The rationale here is that SAC will have only a weak influence when one examines cases near each other.
For the regression betas, one could use a weighted mean with unit-weights or inverse distance weights. The latter is theoretically superior, but I implemented both options. The implementation can also output the vector of beta values in case someone wants to experiment using other central tendency measures.
The results are surprisingly similar to those from KNSNR. Table 5 shows results for the predictor x outcome relationship in datasets 1-6 using SLR.
|
Dataset |
slr_3_none |
slr_10_none |
slr_50_none |
slr_3_inverse |
slr_10_inverse |
slr_50_inverse |
|
1 |
-0.017 |
-0.033 |
0.047 |
-0.008 |
-0.021 |
0.03 |
|
2 |
0.442 |
0.493 |
0.551 |
0.436 |
0.493 |
0.551 |
|
3 |
0.102 |
0.156 |
0.316 |
0.1 |
0.159 |
0.278 |
|
4 |
0.457 |
0.533 |
0.583 |
0.456 |
0.535 |
0.588 |
|
5 |
0.141 |
0.225 |
0.494 |
0.129 |
0.194 |
0.452 |
|
6 |
0.51 |
0.555 |
0.623 |
0.501 |
0.55 |
0.625 |
Table 5: Spatial local regression results for the predictor x outcome relationship in datasets 1-6. The number refers to the chosen k value. The word refers to the use of weights.
Recall that datasets with odd numbers are spurious causes while those with even numbers are true causes. For k=3 and 10, we see strong contrasts between the results from the even and odd numbered datasets, but not for k=50. It appears that using k=50 is sufficient to induce a strong spurious effect. The use of weights does not seem to have much effect, which is somewhat surprising. It does have a small effect on reducing the size of the spurious cause correlations.
To further investigate this, calculated the same numbers as shown in Table 5 but for k = [3-50] using only inverse weighing. Results are shown in Figure 21.

Figure 21: Spatial local regression results for datasets 1-6 for varying values of k. Inverse distance used as weight.
We see that at lower k values, all correlations decrease, but the spurious ones decrease more. As k increases towards N of the sample, the spurious and true cause correlations converge.
6. Comparison of measures of SAC
It is worth comparing the two measures of SAC examined in this paper to the more standard methods in the field. Two methods are widely used to measure the amount of SAC in a dataset: Moran’s I and Geary’s C (Gelade, 2008; Hassall & Sherratt, 2011; Radil, 2011). These two measures are described as approximately inversely related and often only the first is used. I also used only the first because I was unable to understand the implementations of the latter in R (e.g. in spdep package). Both Moran’s I and Geary’s C are global measures of SAC, altho local variations exist (Radil, 2011).
Because KNSNR tends to hit a ceiling quickly (e.g. in Table 2), the analysis here is focused on variables where this doesn’t happen. For this purpose, the outcome, predictor and residuals from predicting the first with the latter are examined with all three methods in across all datasets. Results from different datasets with the ‘same’ variable were appended. Because KNSNR requires a tuning parameter, 3 values were chosen for this (3, 10, and 50). A square root version of CD was also added to see if the non-linearity inherent in the CD correlations would substantially change the relationship to the other measures.
To increase sample size and diversity of datasets, more datasets were created. Dataset 7 is a variant of dataset 6, but where SAC is also induced into the outcome and predictor variables. Dataset 8 uses the distance to the center as the basis for the predictor values and the outcome values are a noisy version of the predictor. Datasets 9 and 10 are variants of dataset 8 but where the distance to the points (75;75) and (100;100) are used, respectively. Dataset 11 had no SAC induced and functions as a null dataset. Dataset 12 has datapoints perfectly distributed in a grid pattern, perfect negative SAC for the predictor and uneven SAC for the outcome. The supplementary materials contains scatter plots for these additional datasets. Table 6 shows the SAC values according to the 5 measures and Table 7 shows their intercorrelations.
|
Dataset and variable |
Morans_I |
cd |
cd_sqrt |
knsn_3 |
knsn_10 |
knsn_50 |
|
ex1_outcome |
0.403 |
0.452 |
0.673 |
0.741 |
0.789 |
0.798 |
|
ex1_predictor |
0.432 |
0.547 |
0.739 |
0.764 |
0.812 |
0.819 |
|
ex1_outcome_predictor_resids |
0.074 |
0.062 |
0.249 |
0.227 |
0.283 |
0.325 |
|
ex2_outcome |
0.146 |
0.172 |
0.415 |
0.3 |
0.453 |
0.468 |
|
ex2_predictor |
0.298 |
0.309 |
0.556 |
0.598 |
0.671 |
0.685 |
|
ex2_outcome_predictor_resids |
-0.002 |
0.02 |
0.141 |
-0.02 |
-0.021 |
-0.107 |
|
ex3_outcome |
0.248 |
0.378 |
0.615 |
0.646 |
0.716 |
0.735 |
|
ex3_predictor |
0.278 |
0.468 |
0.684 |
0.698 |
0.758 |
0.756 |
|
ex3_outcome_predictor_resids |
0.038 |
0.054 |
0.233 |
0.16 |
0.271 |
0.303 |
|
ex4_outcome |
0.09 |
0.176 |
0.419 |
0.268 |
0.386 |
0.445 |
|
ex4_predictor |
0.18 |
0.263 |
0.512 |
0.507 |
0.601 |
0.635 |
|
ex4_outcome_predictor_resids |
-0.004 |
0.04 |
0.199 |
-0.018 |
0.014 |
-0.059 |
|
ex5_outcome |
0.136 |
0.066 |
0.258 |
0.737 |
0.794 |
0.671 |
|
ex5_predictor |
0.14 |
0.055 |
0.234 |
0.693 |
0.758 |
0.662 |
|
ex5_outcome_predictor_resids |
0.021 |
0.026 |
0.162 |
0.14 |
0.28 |
0.243 |
|
ex6_outcome |
0.031 |
0.041 |
0.202 |
0.246 |
0.365 |
0.323 |
|
ex6_predictor |
0.105 |
0.042 |
0.204 |
0.54 |
0.632 |
0.565 |
|
ex6_outcome_predictor_resids |
-0.013 |
0.023 |
0.152 |
-0.092 |
-0.035 |
-0.101 |
|
ex7_outcome |
0.176 |
0.065 |
0.256 |
0.98 |
0.994 |
0.729 |
|
ex7_predictor |
0.219 |
0.101 |
0.317 |
0.987 |
0.997 |
0.831 |
|
ex7_outcome_predictor_resids |
0.174 |
0.088 |
0.296 |
0.976 |
0.99 |
0.676 |
|
ex8_outcome |
0.126 |
0.017 |
0.131 |
0.599 |
0.651 |
0.642 |
|
ex8_predictor |
0.27 |
0.028 |
0.167 |
0.994 |
0.993 |
0.972 |
|
ex8_outcome_predictor_resids |
-0.007 |
0.002 |
0.04 |
0.018 |
-0.01 |
-0.171 |
|
ex9_outcome |
0.188 |
0.201 |
0.448 |
0.595 |
0.645 |
0.65 |
|
ex9_predictor |
0.395 |
0.483 |
0.695 |
0.997 |
0.997 |
0.985 |
|
ex9_outcome_predictor_resids |
-0.007 |
0 |
0.015 |
-0.02 |
-0.199 |
|
|
ex10_outcome |
0.2 |
0.25 |
0.5 |
0.6 |
0.652 |
0.66 |
|
ex10_predictor |
0.414 |
0.565 |
0.752 |
0.998 |
0.998 |
0.993 |
|
ex10_outcome_predictor_resids |
-0.007 |
0 |
0.015 |
0.016 |
-0.016 |
-0.176 |
|
ex11_outcome |
-0.002 |
-0.002 |
-0.027 |
-0.023 |
-0.04 |
|
|
ex11_predictor |
-0.006 |
0.001 |
0.037 |
0.019 |
-0.004 |
-0.126 |
|
ex11_outcome_predictor_resids |
-0.002 |
-0.002 |
-0.027 |
-0.023 |
-0.04 |
|
|
ex12_outcome |
0.024 |
0.018 |
0.134 |
0.767 |
0.734 |
-0.22 |
|
ex12_predictor |
-0.023 |
-0.003 |
-0.999 |
0.889 |
-0.916 |
|
|
ex12_outcome_predictor_resids |
0.024 |
0.018 |
0.134 |
0.767 |
0.734 |
0.084 |
Table 6: SAC measures of three variables in 11 datasets.
| Morans_I | cd | cd_sqrt | knsn_3 | knsn_10 | knsn_50 | |
| Morans_I | 0.889 | 0.897 | 0.737 | 0.728 | 0.849 | |
| cd | 0.892 | 0.961 | 0.501 | 0.502 | 0.652 | |
| cd_sqrt | 0.892 | 0.999 | 0.598 | 0.574 | 0.758 | |
| knsn_3 | 0.811 | 0.643 | 0.641 | 0.718 | 0.838 | |
| knsn_10 | 0.733 | 0.583 | 0.593 | 0.874 | 0.638 | |
| knsn_50 | 0.932 | 0.822 | 0.822 | 0.752 | 0.708 |
Table 7: Intercorrelations among 6 SAC measures in 12 datasets. Pearson correlations above diagonal. Spearman’s rank-order below.1
All correlations between the measures were sizable as one would expect. The CD measure showed downward-biasing non-linearity because the rank-order correlations were noticeably stronger.
Behind the strong intercorrelations lie some surprisingly inconsistencies. Consider ex1_outcome vs. ex7_outcome_predictor_resids. CD gives 0.452 and 0.088 while knsn_3 gives 0.741 and 0.976. What this seems to mean is that there is a strong local SAC (which knsn_3 measures) in the residuals but a weak global SAC (which CD measures).
The KNSNR results for dataset 12 need special attention. Because the points are distributed in an exact grid pattern, many pairs of points are equidistant. This poses a problem for KNN-type approaches because they have to picked k nearest neighbors. In this case, the computer chooses one based on the position in the distance matrix which is an arbitrary choice. If one is examining data distributed in a perfect grid pattern, extra attention should be given to the choice of k. Notice also that cases close to the edges have no neighbors in that direction (this isn’t Pacman world), so the algorithm must choose neighbors further away. This can give strange results.
7. Comparison of correction methods
In the previous sections, three different methods for controlling for SAC were discussed. It is useful to do a straight up comparison with the best choice of parameters. Table 8 shows the uncontrolled and SAC-controlled correlation in datasets 1-6 using correlation of distances (using semi-partial, partial and multiple regression sub-methods), KNSNR (using all three parameters with regards to which variable(s) to control for SAC, k=10) and SLR (using inverse weights, k=3).
|
Dataset |
Uncontrolled |
CD_d_sqrt |
CD_p_sqrt |
CD_b_sqrt |
CD_mr_sqrt |
KNSNR_d_k10 |
KNSNR_p_k10 |
KNSNR_b_k10 |
SLR_k3 |
|
1 |
0.664 |
0.356 |
0.367 |
0.356 |
0.402 |
0.042 |
0.046 |
-0.012 |
-0.008 |
|
2 |
0.684 |
0.622 |
0.633 |
0.622 |
0.65 |
0.447 |
0.481 |
0.532 |
0.436 |
|
3 |
0.664 |
0.445 |
0.456 |
0.445 |
0.485 |
0.194 |
0.199 |
0.235 |
0.1 |
|
4 |
0.684 |
0.628 |
0.635 |
0.628 |
0.646 |
0.518 |
0.533 |
0.583 |
0.456 |
|
5 |
0.661 |
0.611 |
0.61 |
0.611 |
0.611 |
0.08 |
0.089 |
0.034 |
0.129 |
|
6 |
0.662 |
0.626 |
0.626 |
0.626 |
0.626 |
0.487 |
0.514 |
0.548 |
0.501 |
Table 8: SAC corrected results across methods.
We see that for datasets 1-4, the CD approaches fail to correct for the spurious correlation since the correlations after control are still sizable. For the same datasets we see that KNSNR and SLR perform ok to well. For the most important datasets, 5-6, the CD approaches barely make a difference, but the other two methods make a very large difference.
8. Discussion and conclusion
Table 9 shows an overview of SAC methods and their uses.
|
Approach |
Can induce SAC? |
Can measure SAC? |
Can control for SAC? |
|
Correlation of distances |
? |
Yes |
Yes |
|
k nearest spatial neighbor |
Yes |
Yes |
Yes |
|
Spatial local regression |
No |
No |
Yes |
|
Moran’s I and similar |
No |
Yes |
No |
Table 9: Overview of SAC methods and their uses.
Correlation of distances (Piffer, 2015) is a clever idea, and a potentially powerful approach because it can be used to both measure and control for SAC and possibly induce SAC too. However, the version of it examined in this paper (“simple CD”) seems to be fairly useless in the sense that it failed to correct for spurious causation in simulated datasets.
It is worth examining whether limiting CD to the nearest k neighbors or neighbors within a radius of a given number of kilometers makes it a better measure. Another option is to weigh the datapoints by weights that diminish as the distance increases (e.g. inverse). Both suggested modifications attempt to deal with the problem that results from the globalness of the simple CD.
A second problem with CD approaches is that because distance scores are based on two datapoints, any measurement error in these scores will have a compound effect on the difference scores, but the matter is complicated (Trafimow, 2015). I’m not sure if this has an effect on the conversion back to an r-type measure as described in this paper, but it might.
A third problem with CD approaches is that the number of distances quickly become very large. E.g. for a dataset with 10,000 cases, the number of distance scores is 49,995,000. This makes for fairly resource-intensive calculations. Random sampling of datapoints could probably be used to offset this problem at the price of some sampling error.
KNSNR approaches are powerful since they can be used to all three ends. The main weakness seems to be that they require a tuning parameter. Probably some approach could be find this through re-sampling methods similar to those used to find tuning parameters for e.g. lasso regression (James et al., 2013). One problem with KNSNR is that it tends to fairly quickly reach a ceiling.
SLR approaches seem more limited because they can only be used to correct for SAC. They do however seem to give similar results to KNSNR approaches, so they could probably be used along KNSNR in a multi-method approach to controlling for SAC. Like KNSNR approaches SLR requires a tuning parameter, but it seems to always be better to use k=3. The smaller the k, the smaller the effect of SAC in the data on the estimate but the more sampling error.
Still, the present findings call for further research into all three approaches.
8.1. Limitations
Only 12 test datasets were examined. Testing the methods against each other on a larger and more diverse set of datasets might change conclusions somewhat.
Of the traditional measures of SAC, only Moran’s I was used in the comparisons. Further research should compare the proposed measures with other already developed measures such as Geary’s C, Gi, Gi* and local Moran’s I (Radil, 2011, p. 19).
Another method used by (Hassall & Sherratt, 2011), spatial eigenvector mapping, to correct for SAC could not be used because I could not find a suitable R implementation.
Supplementary material and acknowledgments
The R source code for this paper is available at https://osf.io/f2pnr/files/
Thanks to Davide Piffer for helpful comments.
References
Albers, C. (2015). NWO, Gender bias and Simpson’s paradox. Retrieved from http://blog.casperalbers.nl/science/nwo-gender-bias-and-simpsons-paradox/
Field, A. P. (2013). Discovering statistics using IBM SPSS statistics (4th edition). Los Angeles: Sage.
Gelade, G. A. (2008). The geography of IQ. Intelligence, 36(6), 495–501. http://doi.org/10.1016/j.intell.2008.01.004
Gordon, R. A. (2015). Regression analysis for the social sciences (Second edition). New York: Routledge, Taylor & Francis Group.
Hassall, C., & Sherratt, T. N. (2011). Statistical inference and spatial patterns in correlates of IQ. Intelligence, 39(5), 303–310. http://doi.org/10.1016/j.intell.2011.05.001
Hunter, J. E., & Schmidt, F. L. (2004). Methods of meta-analysis correcting error and bias in research findings. Thousand Oaks, Calif.: Sage. Retrieved from http://site.ebrary.com/id/10387875
James, G., Witten, D., Hastie, T., & Tibshirani, R. (Eds.). (2013). An introduction to statistical learning: with applications in R. New York: Springer.
Kievit, R., Frankenhuis, W. E., Waldorp, L., & Borsboom, D. (2013). Simpson’s paradox in psychological science: a practical guide. Quantitative Psychology and Measurement, 4, 513. http://doi.org/10.3389/fpsyg.2013.00513
Piffer, D. (2015). A review of intelligence GWAS hits: Their relationship to country IQ and the issue of spatial autocorrelation. Intelligence, 53, 43–50. http://doi.org/10.1016/j.intell.2015.08.008
Radil, S. M. (2011). Spatializing social networks: making space for theory in spatial analysis. University of Illinois at Urbana-Champaign. Retrieved from https://www.ideals.illinois.edu/handle/2142/26222
Trafimow, D. (2015). A defense against the alleged unreliability of difference scores. Cogent Mathematics, 2(1), 1064626. http://doi.org/10.1080/23311835.2015.1064626
Notes
1 The reader with a sense for detail might wonder how the rank-order correlations for CD and CD_sqrt differ. Taking the square root of a vector of numbers does not change their order, so how can the rank-order correlations be different? The explanation is that sometimes the square root is undefined because the original number was negative. The correlations are based on pair-wise, not case-wise complete data, which results in a slightly different set of cases used for the correlations for CD and CD_sqrt.
A correction to this was made 2015-11-10. See http://openpsych.net/forum/showthread.php?tid=251&pid=3675#pid3675