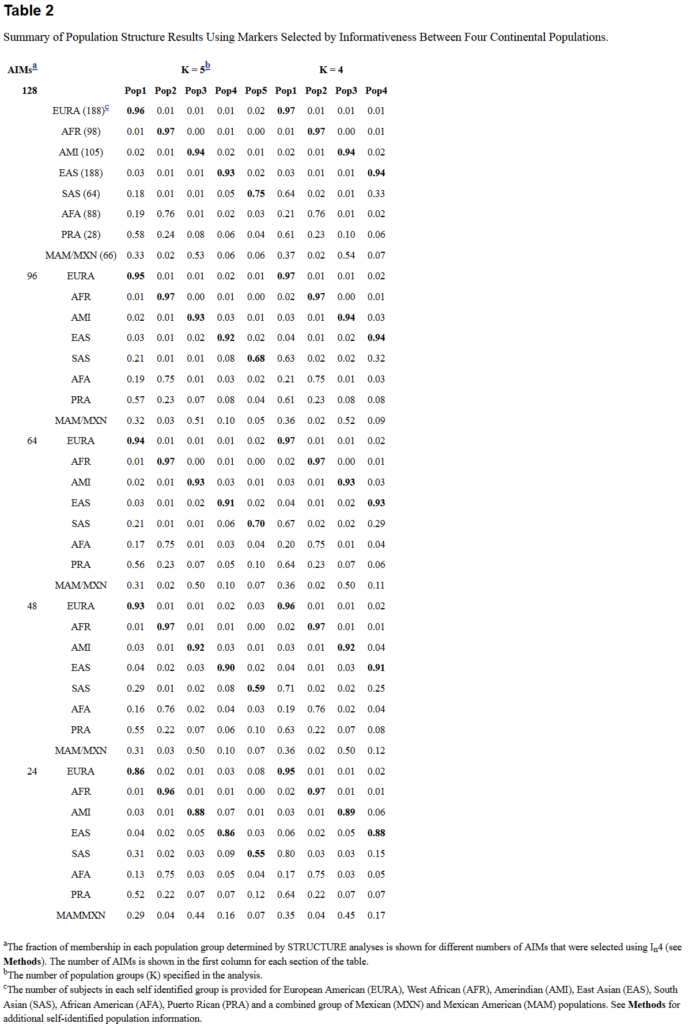
The fewer SNPs (which may be AIMs or not) used to estimate individual-level ancestry, the higher the measurement error. Here I just dump some findings related to this topic. The results are somewhat divergent. The findings Ruiz-Linares cites are somewhat at odds with the others as far as I can tell.
It is important to quantify the measurement error in individual-level ancestry estimates because this biases the observed relationships downwards. To correct for this, one must know how much measurement error there is.
Heterogeneity in Genetic Admixture across Different Regions of Argentina
In an effort to validate the ancestry estimates obtained with our set of AIMs, we next compared individual genetic ancestry estimates obtained with the set of 99 AIMs to those obtained with a set of 118,192 SNPs in a group of 54 individuals within our Buenos Aires sample. The correlation coefficients for the European and Indigenous American estimates were 0.90 and 0.93 respectively (Table S3). African ancestry showed a small level of correlation (correlation coefficient 0.12).
A small number of candidate gene SNPs reveal continental ancestry in African Americans
Ancestry estimated from 276 AIMs and 1144 candidate gene SNPs
Reference values of ancestry for the 2547 individuals were calculated using 276 AIMs. The 1300 self-reported African-Americans had a mean proportion of 0.92 African ancestry and the 1247 self-reported European Americans a mean African ancestry of 0.01. Nine of the self-reported African Americans were found to have greater than 0. 88 proportion European ancestry, suggesting incorrect classification. The 1144 candidate gene SNPs yielded ancestry estimates that were highly correlated with the reference estimates derived from the 276 AIMs (r = 0.989).
Ancestry estimated from random subsets of 276 AIMs
For the full study population, the 15 AIM subsets generated ancestry estimates that were highly correlated with the reference values (r = 0.991) (Table 1). Of the total 254,700 ancestry estimates for all subjects generated using 15 AIMs, 93.8% fell within ± 0.15 of the corresponding reference estimates. The mean absolute difference from the reference values was 0.06 ± 0.04, and the median was less than 0.01 (Figure 1). For the self-reported African Americans, the mean absolute difference from the reference values was 0.06 ± 0.07, and the median was 0.03, with the great majority (89.1%) of estimates within ± 0.15 of the reference estimates (Figure 2). Using subsets of 30, 60, and 120 AIMs, the mean absolute difference from the reference values for the self-reported African Americans improved to 0.05 ± 0.06, 0.04 ± 0.04, and 0.02± 0.03, respectively, with medians of 0.03, 0.02, and 0.01 (Figure 2).
Ancestry estimated from random subsets of 1144 candidate gene SNPs
Highly correlated ancestry estimates were also obtained when smaller subsets of the 1144 candidate genes were used for estimation (Table 1). With 120 candidate gene SNPs, the mean Pearson correlation coefficient with the reference estimates was 0.986 ± 0.003, indicating that little information was lost when roughly 10% of the full set of candidate gene SNPs was used. The smallest correlation obtained from the 100 randomizations of 120 candidate gene SNPs was 0.977 (Table 1 and Figure 3). Of the total 254,700 ancestry estimates generated using 120 randomly-chosen candidate gene SNPs, the mean absolute difference from the reference values was 0.04 ± 0.07, the median was 0.01, and 92.0% of estimates fell within ± 0.15 of their corresponding reference estimates (Figure 4). For the self-reported African Americans, the mean absolute difference from the reference estimates was 0.06 ± 0.08 and the median was 0.03; 86.5% of estimates fell within ± 0.15 of the reference estimates (Figure 5).
Results remained consistent when 60 candidate gene SNPs were used. The mean correlation with the reference estimates was 0.977 ± 0.009, with only 2 of 100 randomizations yielding correlations less than 0.95 (0.922 and 0.947) (Table 1 and Figure 3). The mean absolute difference from the reference values was 0.05 ± 0.09, and the median was 0.01; only 9.6% of all ancestry estimates differed from corresponding reference values by more than ±0.15 (Figure 4). For the self-reported African Americans, the mean difference from the reference estimates was 0.07 ± 0.10 and the median was 0.04; 85.0% of estimates fell within ± 0.15 of the reference values (Figure 5).
Random subsets of 30 candidate gene SNPs generated ancestry estimates less consistent with the reference values, with correlations ranging from 0.78 to 0.95. However, 92% of the 30 SNP randomizations yielded correlations greater than 0.90 (Table 1 and Figure 3). For the self-reported African Americans, the mean absolute difference from the reference values was 0.10 ± 0.15, the median was 0.05, and 80.0% of estimates fell within ± 0.15 of the reference values (Figure 5). Random subsets of 15 candidate gene SNPs performed markedly worse than the other subsets (Table 1), especially with respect to inferring the ancestry of the self-reported African Americans: the mean absolute difference from the reference values was 0.18 ± 0.21 and the median was 0.09, with 34.9% of estimates missing the reference by more than 0.15.
In a sample of Colombians recently included in a genome-wide association study that used Illumina’s 610 chip [19], this set of 30 markers produced individual ancestry estimates with correlations of ∼0.7 (for all the three ancestries) compared with ancestry estimates obtained using an LD-pruned set of 50,000 markers from the chip data, and identical mean estimates. We compared the accuracy of these estimates with estimates obtained using markers from the list of 446 proposed by Galanter et al. (2012) [58], specifically for studying admixture in Latin Americans. From this list, 152 markers are present on Illumina’s 610 chip (i.e. ∼5 times the number of markers that we used) and produced estimates with correlations of ∼0.85 with the ancestry estimates from the 50,000 marker set. By contrast, when the set of markers we selected was reduced to 15, the resulting ancestry estimates had a correlation of ∼0.6 with the 50,000 marker set estimates, again showing that there is a diminishing return in accuracy when one increases the numbers of SNPs used in ancestry estimation.

