Many libertarians defend women’s voting rights (women’s suffrage) by reference to general principles about equality of legal rights. The historical reason for this move, I think, is that libertarians and classical liberals was a political reaction to the extra legal rights of the nobility and royalty. Thus, their goal was to equalize such rights, and this also implies equalizing them for women as well as non-European groups (most famously, African descent slaves).
History aside, the stance of libertarians is odd politically because women really don’t like libertarianism, a few Twitter liberty hotties aside. For instance, sex composition of US libertarians as measured by this 2013 survey was 68% male. I think it underestimates because it didn’t look at voting, and voting results tend to be more extreme than various kinds of self-report. There’s some more numbers here and here, but again they are not based on actual voting patterns as far as I can tell. Pew research produced this figure based on 2014 data (US again). For a broader comparison, see also Karlin’s Coffee Salon demographics.
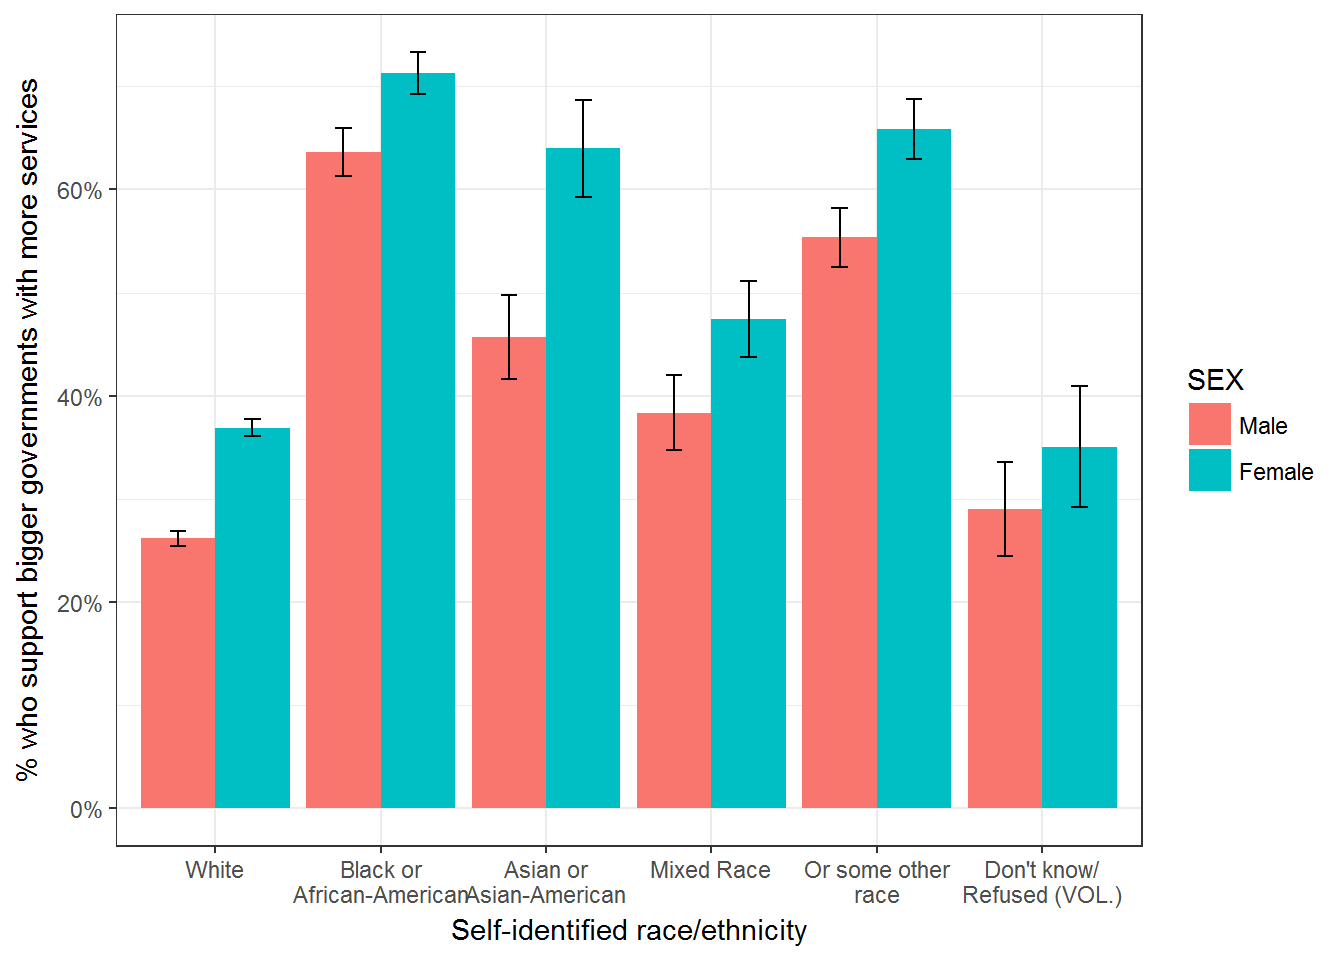
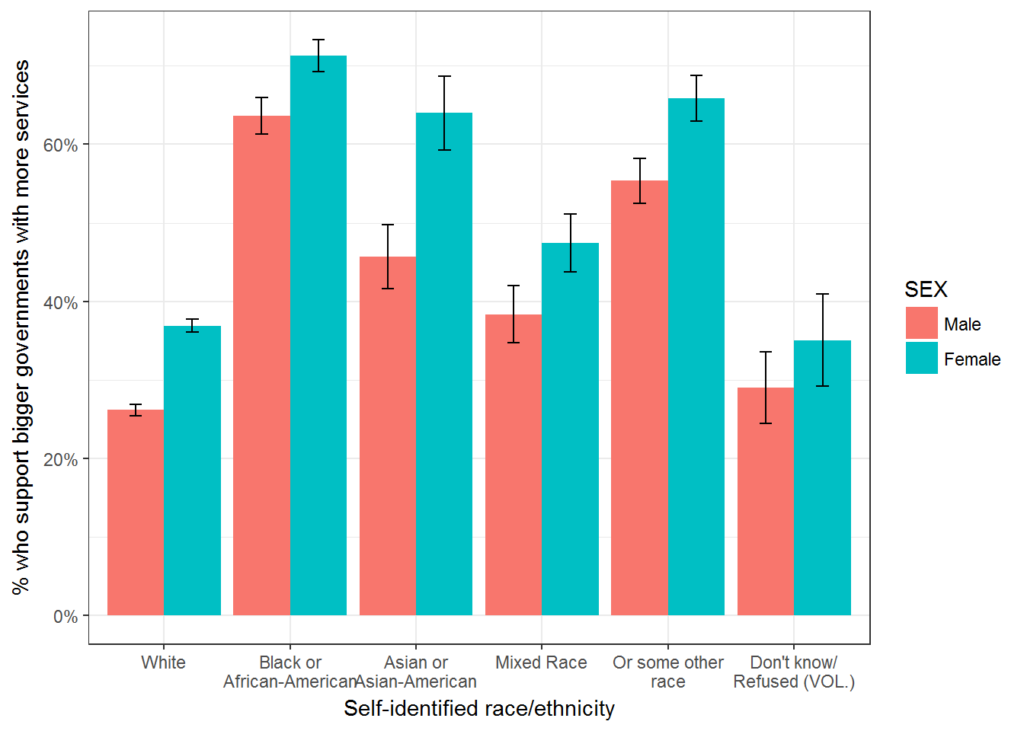
We can also have a look ourselves since Pew releases their data after 2 years (dataset collection). I am actually surprised few people use these public datasets, which are high quality, representative surveys that cover many difference topics. There are even a few surveys with IQ-like items, mainly related to scientific knowledge. Back in 2017, I downloaded one of these surveys to plot the demographics of preference for smaller government. Simple race x sex breakdown looks like this:
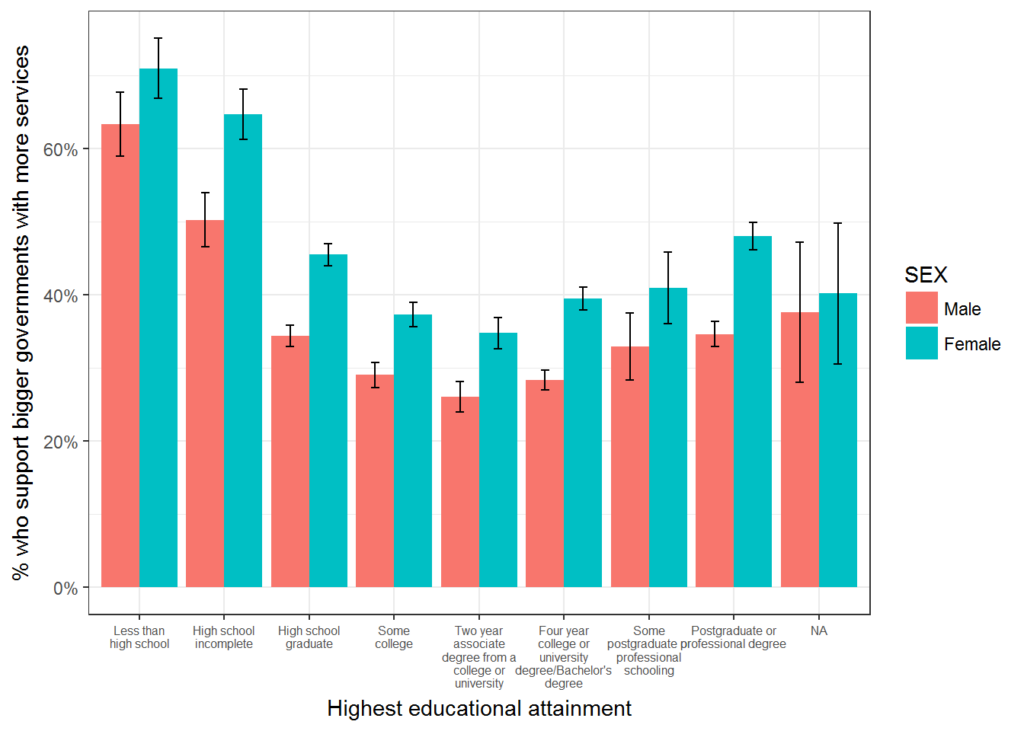
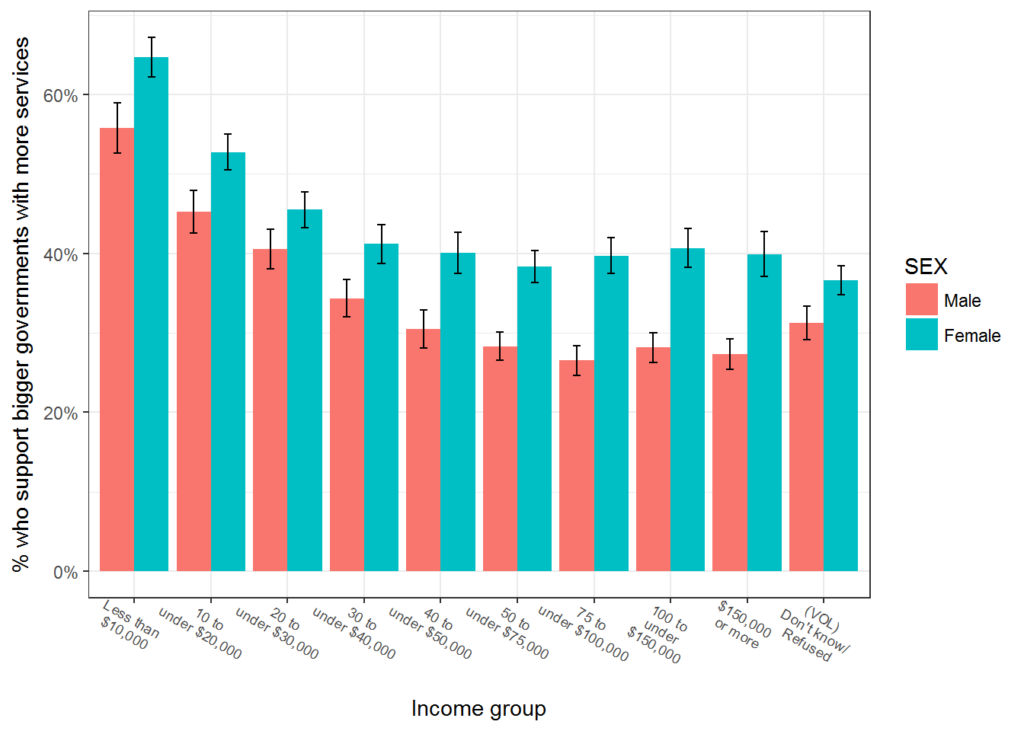
The female preference for larger government shows up pretty much no matter how you slice the data:
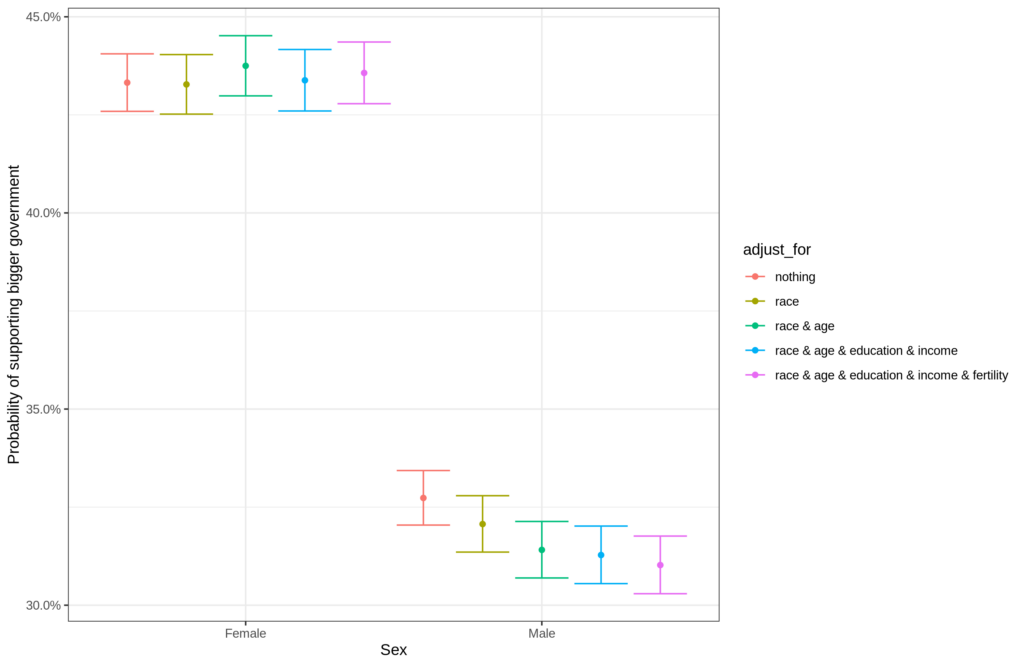
More numerically, we can also fit a regression model with all of these proposed explanatory factors at the same time:
To produce this plot, I did:
- Fit 5 logistic regression models (using rms package for R) with varying predictions. The first has just sex, and then we incrementally add more covariates to see if they can make the effect of sex go away.
- Extract the probability of favoring bigger govt from the 5 models, and combine these to a dataset.
- Plot the probabilities with appropriate error bars (95% confidence predictions) and labels.
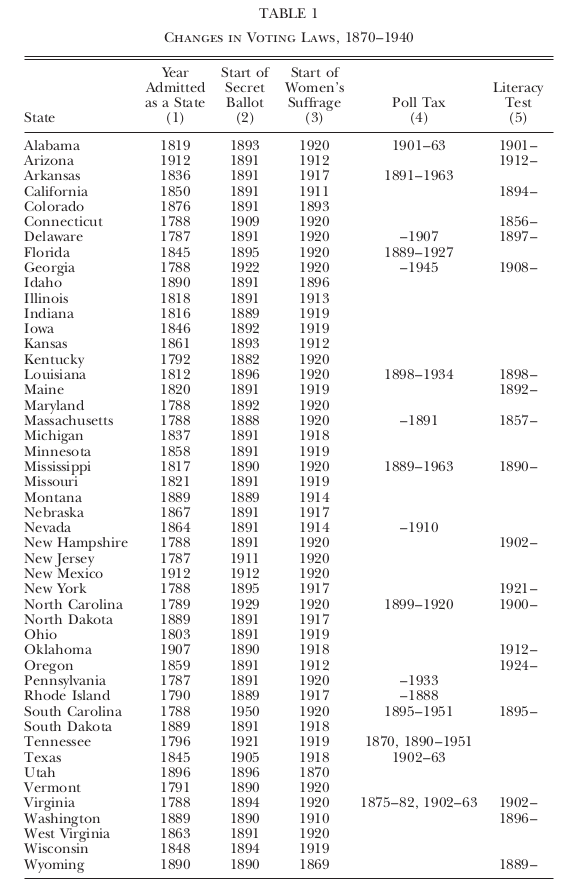
So, all in all, we see that the sex difference actually does not get smaller with controls, it gets slightly larger (because male % decreases slightly). Numerically, the logit changes from 0.452 to 0.567 between first and final model. Because of this, one cannot explain female bigger government preference out of their present social conditions in society, it must have deeper roots, meaning evolutionary. Leaving speculations about the origin aside, we can also predict that giving women votes should increase the size of the government. Does it? We can rely upon policy changes in history that extended the vote to women. There are a few of these studies actually. The most obvious country to examine is the United States:
-
Lott, Jr, J. R., & Kenny, L. W. (1999). Did women’s suffrage change the size and scope of government?. Journal of political Economy, 107(6), 1163-1198.
This paper examines the growth of government during this century as a result of giving women the right to vote. Using cross‐sectional time‐series data for 1870–1940, we examine state government expenditures and revenue as well as voting by U.S. House and Senate state delegations and the passage of a wide range of different state laws. Suffrage coincided with immediate increases in state government expenditures and revenue and more liberal voting patterns for federal representatives, and these effects continued growing over time as more women took advantage of the franchise. Contrary to many recent suggestions, the gender gap is not something that has arisen since the 1970s, and it helps explain why American government started growing when it did.
This is the most famous, I think, mainly because the author is naughty for other reasons.
Switzerland is another good choice:
-
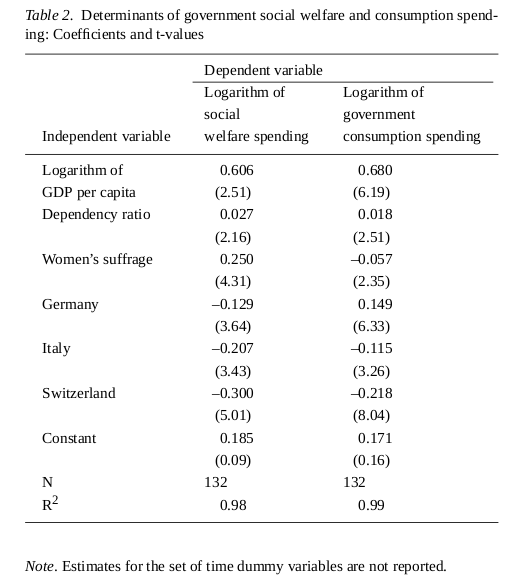
Abrams, B. A., & Settle, R. F. (1999). Women’s suffrage and the growth of the welfare state. Public Choice, 100(3-4), 289-300.
In this paper we test the hypothesis that extensions of the voting franchise to include lower income people lead to growth in government, especially growth in redistribution expenditures. The empirical analysis takes advantage of the natural experiment provided by Switzerland’s extension of the franchise to women in 1971. Women’s suffrage represents an institutional change with potentially significant implications for the positioning of the decisive voter. For various reasons, the decisive voter is more likely to favor increases in governmental social welfare spending following the enfranchisement of women. Evidence indicates that this extension of voting rights increased Swiss social welfare spending by 28% and increased the overall size of the Swiss government.
Authors explain on their results:
The results for the key variable, suffrage, are striking. Based upon our estimates, giving women the vote in Switzerland raised the level of social welfare spending by 28%, after accounting for other influences on that spending variable. In Switzerland, social welfare spending is about half the government budget, so this result implies an increase in overall government spending of about 14%. Qualitatively, this result is consistent with the Husted and Kenny (1997: 76) finding of “. . . strong support for the prediction that welfare spending rises as the decisive voter moves down the income distribution.”
In an attempt to shed some light on whether the effect of suffrage on welfare spending was immediate or occurred with some lag, we estimated several alternative models (not reported here). In these models we varied the date at which the suffrage variable switched from 0 to 1. Rather than indicating the year in which suffrage occurred, this alternative formulation indicates alternative years when suffrage may have begun to influence spending. The values for the suffrage coefficient and t-statistic are maximized when suffrage equals one beginning in 1973: the coefficient equals 0.295 versus 0.25 in Table 2, while the t-value is 6.30 versus 4.31. This simple test suggests the reasonable conclusion that the political mechanism in Switzerland did not respond immediately to this sweeping change in the nature of the electorate, but with a lag of about two years.
In contrast to the positive impact on social welfare spending, enfranchisement of Swiss women appears to have reduced the rate of government consumption spending in Switzerland. The estimates for model 2 suggest that, as a result of women’s suffrage, the level of government consumption spending is about 5.8% less than otherwise. This finding differs from the Husted and Kenny (1997: 80) study: they found that “. . . nonwelfare government expenditures were unaffected by various measures of political influence of the poor. . .” Examination of Swiss government spending suggests that at least part of the observed reduction in government consumption spending may e attributed to cuts in military outlays. In the period 1963–1971, military spending averaged 2.46% of GDP. In the period 1972–1983, following the enfranchisement of women, military spending averaged only 1.99% of GDP (Source: U.S. Arms Control and Disarmament Agency).
Government consumption spending in Switzerland is about 38% of total government outlays. Thus, the 5.8% reduction translates into a 2.2% reduction in total outlays. That impact, combined with the estimated positive effect on social welfare spending, suggests that the overall effect of women’s suffrage on total government spending in Switzerland is around 12%.
So, women moved spending from military (national defense) into enjoyment/health, and also increased the overall spending.
Thus, overall, the conclusion seems to be that anyone who is against large government should be against women voting, at least prima facie. One could defend it on other grounds such as keeping a fair and simple rights setup in society. If one wants to avoid a direct sexist solution, one could attempt to target problem voters in other ways. For instance, one idea is to limit voting rights to people who are employed in the private sector, i.e. who are not dependent on the welfare state for their own salaries. Another idea is to remove voter rights from people who are living off non-earned welfare payouts (unemployment/disability benefits and the like, but not including earned pensions). The latter solution is in line with the typical rational voter framework of economics, but the results above for effect of sex do not generally align with self-interested voting since the effect of sex was remarkable stable no matter which controls were employed.
Update 2020-08-20 – third study
A friend notified me there is a third study.
- Aidt, T. S., & Dallal, B. (2008). Female voting power: the contribution of women’s suffrage to the growth of social spending in Western Europe (1869–1960). Public Choice, 134(3-4), 391-417.
Women’s suffrage was a major event in the history of democratization in Western Europe and elsewhere. Public choice theory predicts that the demand for publicly funded social spending is systematically higher where women have and use the right to vote. Using historical data from six Western European countries for the period 1869–1960, we provide evidence that social spending out of GDP increased by 0.6–1.2% in the short-run as a consequence of women’s suffrage, while the long-run effect is three to eight times larger. We also explore a number of other public finance implications of the gender gap.
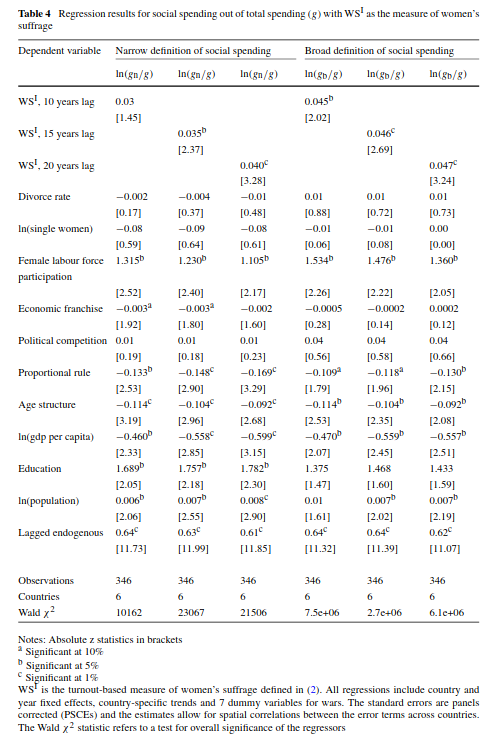
These are the main results. Unfortunately, this paper is massively p-hacked, and most stuff is reported as “significant at 10%”, laughable. Someone will have to re-do this study without the p-hacking. Maybe do one of those many teams studies.
