Now that the video is up, here’s some other studies I came across.
- Falkenberg, L. (1990). Improving the accuracy of stereotypes within the workplace. Journal of Management, 16(1), 107-118.
Has a pretty straightforward summary of stereotypes and stereotyping:
Organizations experience high levels of inefficiency when decisions are based on inaccurate stereotypes. As humans are dependent upon stereotypes in their daily information processing, a critical issue is the identification of conditions that produce more accurate stereotypes. This article delineates a social cognition model of stereotyping and identifies the factors involved in developing more accurate stereotypes. The model is applied to gender stereotypes to indicate how these stereotypes may be modified. Managerial implications and future research issues are identified with the anticipation that these ideas will provide guidelines as to how to stimulate more accurate stereotypes in organizations.
From the introduction:
Humans are dependent upon stereotypes to reduce their information processing demands. Unfortunately this dependence creates a number of problems for organizations and individuals. Inaccurate stereotypes leads to inefficient and uneconomical decisions, and create major barriers in the advancement of minority status individuals. [some citation] Stereotypes can not be eliminated; thus, a critical issue for organizations is identifying conditions that propagate more accurate stereotypes.
…
Within a social cognition frame work stereotypes function to reduce information processing demands, define group membership, and/or predict behavior based on group membership [6 citations]. Stereotyping has a negative connotation because it is often (a) a source or excuse for social injustice, (b) based on relatively little information, (c) resistant to change even with new information, (d) rarely accurately applied to specific individuals [2 citations]. However, stereotyping is not a negative process; rather it is a neutral, subconscious cognitive process that increases the efficiency of interpreting environmental information. Stereotypes often reflect accurate generalizations about large social categories [4 citations]. In recognition that stereotypes are developed and employed subconsciously, have some degree of accuracy, and can produce social injustice, stereotyping in this study is defined as a neutral, necessary cognitive process that can lead to inaccuracies and/or negative consequences.
[left out citations because PDF not OCR’d]
-
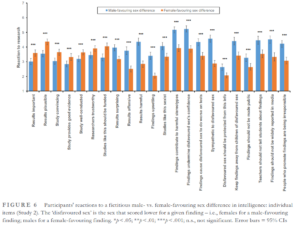
Hall, J. A., & Carter, J. D. (1999). Gender-stereotype accuracy as an individual difference. Journal of Personality and Social Psychology, 77(2), 350.
Accuracy of participants’ ratings of gender differences on 77 behaviors and traits was assessed by correlating participants’ ratings with actual gender differences based on meta-analyses. Accuracy at the group level was impressively high in 5 samples of participants. Accuracy of individuals showed wide variability, suggesting that ability to accurately describe gender differences is an individual difference. Analysis of correlations between individual accuracy and a battery of psychological measures indicated that accuracy was negatively related to a tendency to accept and use stereotypes, negatively related to a rigid cognitive style, and positively related to measures of interpersonal sensitivity.
They collected data from 5 samples, totaling 708 students, massive for its time.
Some tables of interest. First, overall accuracy. Not sure why there is no value for all data combined, which would be marginally better. Samples 4-5 each have ~200 students evenly split by sex.

Accuracy across trait types:

Individual accuracy summary stats:

Finally, correlations of individual accuracy:

PONS:
The Profile of Nonverbal Sensitivity (PONS) test (Rosenthal et al., 1979) measures ability to identify an encoder’s intended message through nonverbal cues. In this test, a female encoder acts out affective scenes that are each edited to 2 s;these scenes are presented to the test taker in different nonverbal channels,which may consist of facial cues, gestural cues, voice tone cues (but not linguistic cues), and combinations of these. The test taker responds on a multiple-choice answer sheet. In Sample 3 we used the 40-item silent face and body short form of the PONS; in Sample 4 we used the full-length PONS, consisting of 220 items for all nonverbal channels. In the present study, Cronbach’s alpha was .22 for the short form and .83 for the full-length test.
So, it’s an old, longer, and probably better version of the modern Eyes in the mind test. Probably also measures emotional intelligence. It’s the only decent positive predictor in this sample, while social dominance was a negative predictor:
Social Dominance Scale (Samples 3, 4, and 5). This 14-item instrument measures the belief that some groups are superior to others (Pratto, Sidanius, Stallworth, & Malle, 1994). Sample items are “Some people are just more deserving than others” and “It is important that we treat other countries as equals” (reverse scored). Although not directly measuring stereotyping, the scale is described by its authors as significantly correlated with measures of ethnic prejudice and sexism. Higher values indicate more endorsement of the concept of group superiority (median a = .82).
-
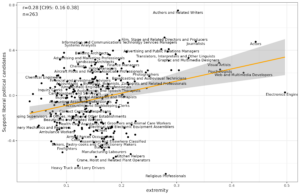
Garg, N., Schiebinger, L., Jurafsky, D., & Zou, J. (2018). Word embeddings quantify 100 years of gender and ethnic stereotypes. Proceedings of the National Academy of Sciences, 115(16), E3635-E3644.
Word embeddings are a powerful machine-learning framework that represents each English word by a vector. The geometric relationship between these vectors captures meaningful semantic relationships between the corresponding words. In this paper, we develop a framework to demonstrate how the temporal dynamics of the embedding helps to quantify changes in stereotypes and attitudes toward women and ethnic minorities in the 20th and 21st centuries in the United States. We integrate word embeddings trained on 100 y of text data with the US Census to show that changes in the embedding track closely with demographic and occupation shifts over time. The embedding captures societal shifts—e.g., the women’s movement in the 1960s and Asian immigration into the United States—and also illuminates how specific adjectives and occupations became more closely associated with certain populations over time. Our framework for temporal analysis of word embedding opens up a fruitful intersection between machine learning and quantitative social science.
Results:


A similar study is this one: Bolukbasi et al 2016.
Interest in stereotype accuracy over time? Ngram viewer seems to indicate not too much disparity.

But the academic literature gives another picture:
- 3570 “inaccurate stereotypes” vs. 441 “accurate stereotypes”: ratio = 8.1
- 677 “inaccurate stereotype” vs. 333 “accurate stereotype”: ratio = 2.0