This figure is flowing around Twitter recently:
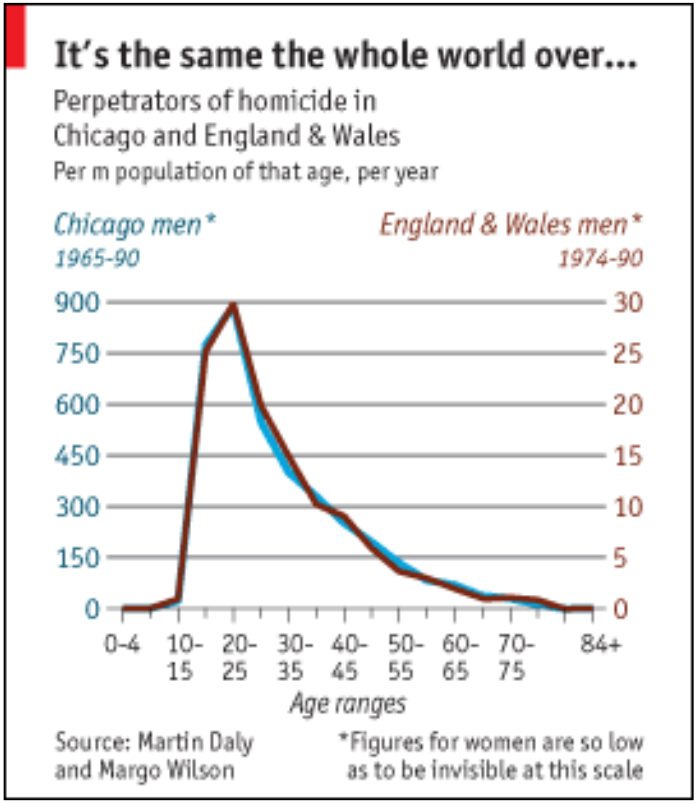
The usual commentary is simply to notice the Y axis. Chicago men having a homicide rate of 900, and those in England and Wales of 30. That’s 30x.
Asking around, no one could provide me with the direct source, neither for The Economist, nor the scientific source — Daly and Wilson, yes, but which publication?
Jurij Federov however was finally able to find it. It is on Internet Archive, but you have to be quick because their paywall is included in the archived version, but doesn’t appear the first few seconds (slow JavaScript?). Anyway, so the figure is there good and well, but still no exact source. Jurij was also able to track it down, at least, maybe. This 1997 study:
- Daly, M., & Wilson, M. (1997). Crime and conflict: Homicide in evolutionary psychological perspective. Crime and justice, 22, 51-100.
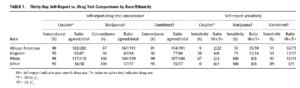
Criminological theories are usually framed in sociological terms but always entail psychological assumptions. Psychological accounts, in their turn, entail assumptions about the adaptive “design” of evolved mental mechanisms and processes. Thus, explicit attention to recent theory and research on psychology and evolution can sometimes help criminologists generate productive hypotheses and avoid blind alleys. Homicide research is illustrative. Interpersonal conflicts are engendered by interactions among individuals whose psyches were designed by natural and sexual selection to make them effective competitors and effective nepotists (kin-benefactors). These considerations suggest numerous testable hypotheses about such matters as who is likely to kill whom, and how the demography of homicide perpetration and victimization is likely to vary among victim-killer relationships. An evolutionary psychological perspective inspires us to criticize recent criminological discussions of sex differences and age patterns in criminal offending, theories that contrast rational choice with emotional or impulsive behavior, and the medicalization of antisocial behavior as a pathology.
One figure has the data:
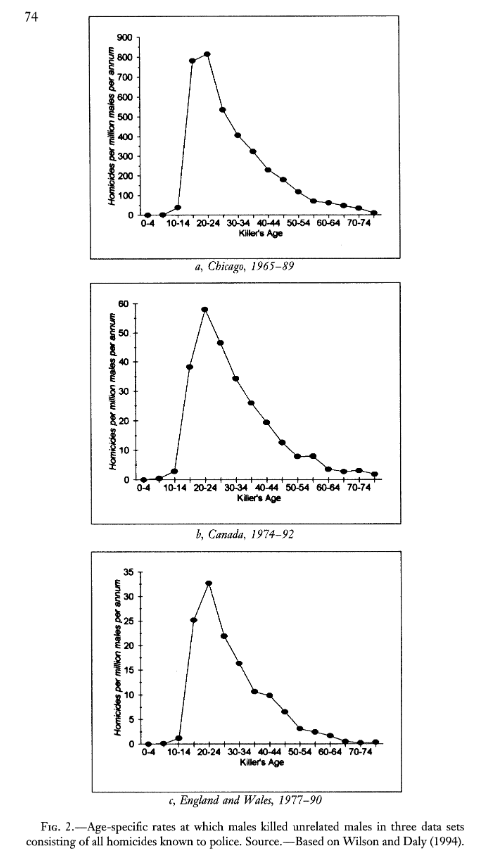
Except we notice that the figure has a less stark contrast as the remade one. Here, the maximum for Chicago and England-Wales are 825ish and 33ish. The ratio is reduced to a mere 25x. Still, this paper is not the original, but refers us to Wilson and Daly 1994… which is:
- Wilson and Daly, (1994). “A Lifespan Perspective on Homicidal Violence: The Young Male Syndrome.” In Proceedings of the 2nd Annual Workshop of the Homicide Research Working Group, edited by C. Rebecca Block and Richard L. Block. Washington, D.C.: National Institute of Justice.
A deadline conference paper. All hope lost? No, one can find copies of these proceedings at the website. However…

Notice the absence of a link for the 1994 meeting, the very one we need! Wait! Actually, if we check, the 1993 one is the one with the right title, and it does have the right paper. The year citation was wrong, it should be 1993. The figure in it is:
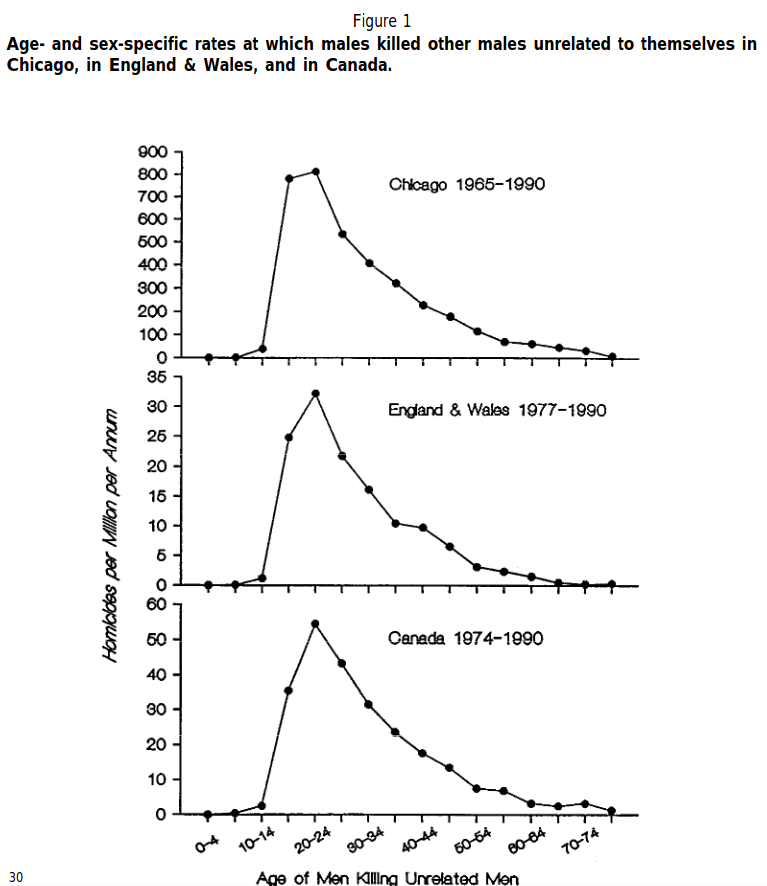
This is essentially identical to the 1997 one, and still not The Economist one. We can also note that The Economist uses different age spans. Are these errors introduced by their graphic artist or does it indicate a different data source? I can’t really say for sure, but it appears The Economist fudged the data to make Chicago inhabitants look worse, making the age pattern more clear. I emailed the authors Martin Daly (Margo Wilson died) to ask, will update if they respond.