In the very enjoyable book The Art of Statistics: How to Learn from Data David Spiegelhalter mentions as example of an experiment that sounds too good to be true:
In practice the process of allocating treatments in trials is generally more complex than simple randomization case by case, since we want to make sure that all types of people are equally represented in the groups getting different treatments. For example, we may want to have roughly the same number of high-risk older people to get statins and get placebos. This idea came from agricultural experiments, where many of the ideas of randomized trials originated, largely driven by the work of Ronald Fisher (of whom more later). A large field, for example, would be divided up into individual plots, and then each plot would be randomly allocated to a different fertilizer, just like people being randomly allocated a medical treatment. But parts of the field might be systematically different due to drainage, shade and so on, and so first the field would be divided up into ‘blocks’ containing plots which were roughly similar. Randomization was then organized in a way that guaranteed that each block contained equal numbers of plots given each fertilizer, which would mean, say, that the treatments were balanced within boggy areas.
For example, I once worked on a randomized trial comparing alternative methods of repairing hernias: standard ‘open’ surgery versus laparoscopic or ‘keyhole’ surgery. It was suspected that the skill of the team might increase during the trial, and so it was essential that the two treatments were balanced at all times as the trial progressed. I therefore blocked the sequence of patients into groups of 4 and 6, and made sure patients were randomized equally to each treatment within each block. Back in those days the treatments were printed on little slips of paper, which I folded and placed in opaque numbered brown envelopes. I remember watching patients lying on the pre-op trolley, with no idea which treatment they were going to get, while the anaesthetist opened the envelope to reveal what was going to happen to them, and in particular whether they were going to go home with one large scar or a set of punctures.
Randomized trials became the gold standard for testing new medical treatments, and are now increasingly used to estimate the effects of new policies in education and policing. For example, the UK Behavioural Insights Team randomly allocated half of students retaking GCSE Mathematics or English to nominate someone to receive regular text messages that encouraged them to support the student in their studies – the students with a ‘study supporter’ had a 27% higher pass rate. The same team also observed a variety of positive effects in a randomized trial of body-worn video cameras for police officers, such as fewer people being unnecessarily stopped and searched.5
The sources given are: http://www.behaviouralinsights.co.uk/education-and-skills/helping-everyone-reach-their-potential-new-education-results/ and http://www.behaviouralinsights.co.uk/trial-results/measuring-the-impact-of-body-worn-video-cameras-on-police-behaviour-and-criminal-justice-outcomes/, which are now both dead, but we can easily find the current versions. I was interested in the first, so we read the link, but it turns out to be a kind of news summary, no details. They say one can get more details in their annual report, which they link to, and which is by now ALSO 404. But OK, we locate the internet archive version and get the PDF. Alas, it is not very detailed either. We get this summary:
The FE college learners we interviewed identified ‘not knowing who to turn to’ as a key barrier to their academic engagement. This chimes with the literature, which consistently finds strong social support to be predictive of better academic outcomes, including higher aspirations, persistence and attainment. As part of the Behavioural Research Centre for Adult Skills and Knowledge (ASK), run as a partnership between us and the DfE, we collaborated with Professor Todd Rogers at Harvard University to design an intervention which would encourage those around the learner to provide support throughout their course.
Learners nominated up to two ‘study supporters’ to receive regular text messages about their course throughout the year, with nominees including family, friends and employers. The messages highlighted key events, such as upcoming tests, or updated the supporter on what the learner was learning in class. In addition, they made it easier for study supporters to engage with the learner by suggesting questions they could ask to prompt a learning conversation.
The intervention cost less than £10 per student over the year but had a dramatic effect on attainment. Students receiving the messages were 27 per cent more likely to pass their GCSEs or functional skills in maths or English, with a pass rate of 28.1 per cent compared to 22.2 per cent among students who had volunteered to be part of the programme but had not been selected for the trial.
But there are still no details! Not even a link. But we get a researcher name, Professor Todd Rogers at Harvard University, and a project name, Behavioural Research Centre for Adult Skills and Knowledge (ASK). OK, so I tried a search for the mysterious study, and found another page on their website about this study, where they still don’t link to the study BUT mentioned a bigger replication, that they linked to, and where the link works(!). Skimming that report (more on it below), I find the actual report which is here just kidding, it is also 404 already but seriously it is this one:
- Miller et al. (2016) ‘Texting Parents: Evaluation Report and Executive Summary’, London: Education Endowment Foundation.
And their findings:

No p values, but effect sizes are extremely small (less than 0.10 d). Now, there are two main a finding can be doubtful. A suspicious p value (one between 0.01 and 0.10) indicates researcher cheating (p-hacking) and a very small effect size suggests the result may be due to some small bias somewhere. Small effects with small p values are not reliable, since they can also arise from some slight imperfection in randomization, differential drop-out or whatever. Reading further, we do find the p values:
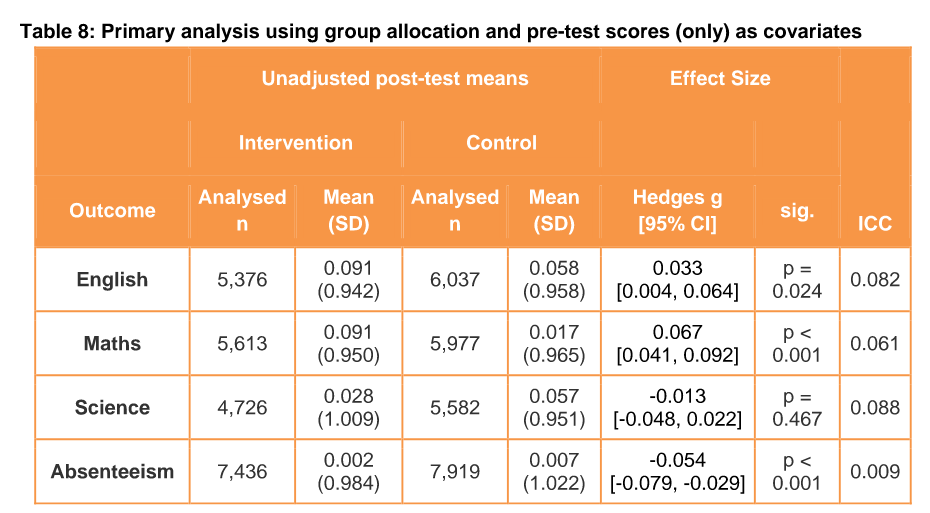
OK, so the English class test results is suspicious but the math and absenteeism ones look legit though tiny. Recall that a d of 0.10 means a correlation of 0.05, and these are closer to 0.05 d, so a correlation of 0.025! Do we really care about that? The authors also show that only the last one is robust to varying the method with multiple imputation for missing data and additional covariates. So uh.. I also can’t find anything about the fantastic 27% relative improvement.
But I didn’t give up, so I managed to find the dissertation of the student who did this work, another 300+ pages to skim:
- Groot, A. S. B. (2018). Social support and academic success: field experiments in further education in England (Doctoral dissertation, UCL (University College London)).
Alright, and this one has the 27% if we look closely! Finally on page 110 we get the primary results:

OK, so most p values are < .01, and we are happy. And the figure with the magic numbers:
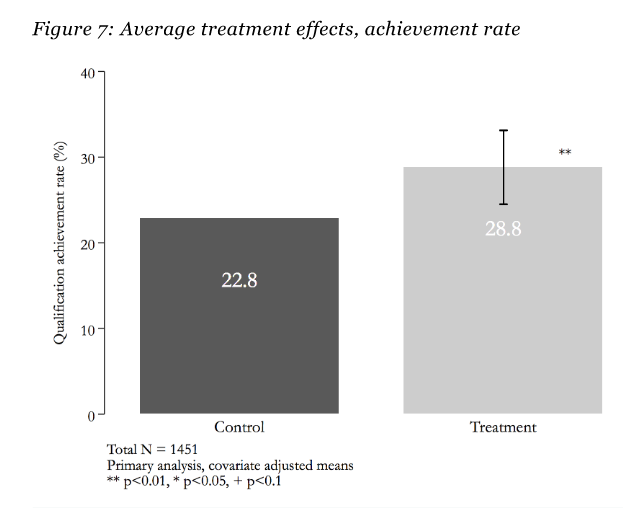
Now, recall these numbers are the same as those in that annual report (the one that was 404 and we had to find on internet archive), and the relative increase is the magic 27%. 28.8-22.8=6, 6/22.8=0.263, which with some rounding is probably 27%! Hooray, we managed to track down one claim after a lot of effort.
OK, so about that replication study!
- Scandone, B., Wishart, R., Griggs, J., Smith, N., Helen, B., Lepanjuuri, K., … & Averill, P. (2020). Texting Students and Study Supporters (Project SUCCESS): Evaluation Report.
They find… drum roll…

Alrighty! So all that fanfare, multiple such media stories, no doubt many books mentioning this great result, and we have to dig into an even obscurer report to learn the truth: this idea didn’t work at all!
Think this stuff is just an outlier? Definitely not. Going through this kind of ordeal to hunt down some supposedly great result is often like this and the results like this too (hovering between “null” and “do we even care?”). For more pessimism, see the Metallic Laws of social science review at Gwern’s.
Oh yeah, and you can pay 4,600 $ to attend a class by that professor, where he will no doubt tell you about a bunch of other studies that probably will be equally replicable. How low is your opinion of social science and why isn’t it lower?