Suppose you ran 20 studies. By coincidence, one of them attains p < .05 and, by good fortune, it’s in the right direction too. The other studies get thoroughly examined p-hacked, and some of them also attain a p < .05 finding. Still, you end up with 12 null studies, and 8 positive of which only 1 didn’t involve light to moderate cheating i.e. p-hacking. You publish the 10 most positive studies. Now it the published record of science says that 8 out of 10 studies support support your theory. Trust the science! Later on some skeptic comes around. He does a meta-analysis and finds the evidence of this p-hacking. Sometimes governments decide to sponsor very large studies, and these invariably find near-zero results. Still, you really liked that one initial study. How would you go on about making it more credible? You could track down the subjects, and measure them again. If the initial finding was due to sampling error in the lucky direction, chances are high your follow-up measurements will produce quite similar results.
Sounds outlandish?
- García, J. L., Heckman, J. J., & Ronda, V. (2021). The Lasting Effects of Early Childhood Education on Promoting the Skills and Social Mobility of Disadvantaged African Americans (No. w29057). National Bureau of Economic Research.
This paper demonstrates multiple beneficial impacts of a program promoting inter- generational mobility for disadvantaged African-American children and their children. The program improves outcomes of the first-generation treatment group across the life cycle, which translates into better family environments for the second generation leading to positive intergenerational gains. There are long-lasting beneficial program effects on cognition through age 54, contradicting claims of fade-out that have dominated popular discussions of early childhood programs. Children of the first-generation treatment group have higher levels of education and employment, lower levels of criminal activity, and better health than children of the first-generation control group.
Sounds impressive? And the 2nd author is a Nobel prize winner too. But then:
This paper analyzes newly collected data on the original participants of the pioneering Perry Preschool Project (PPP) through age 54 and on their children into their mid-twenties. The program aimed to promote social mobility of disadvantaged African-American children. It has substantial intergenerational multiplier effects and improves social mobility on a number of dimensions. Gains in cognition are sustained through age 54, contradicting claims about cognitive fade-out in the treatment effects of early childhood programs. Enriched early childhood education programs are promising vehicles for promoting social mobility. Perry is relevant today because it influences the design of current and proposed early childhood education programs. At least 30% of current Head Start programs are based on it (Elango et al., 2016). More than 10% of African-American children born in the 2010s would satisfy the eligibility criteria to participate in PPP (Garc ́ıa et al., 2021).
Ah, the Perry Preschool Project. Where did I hear about this study before? Oh right:
And from Educational interventions keep not working:

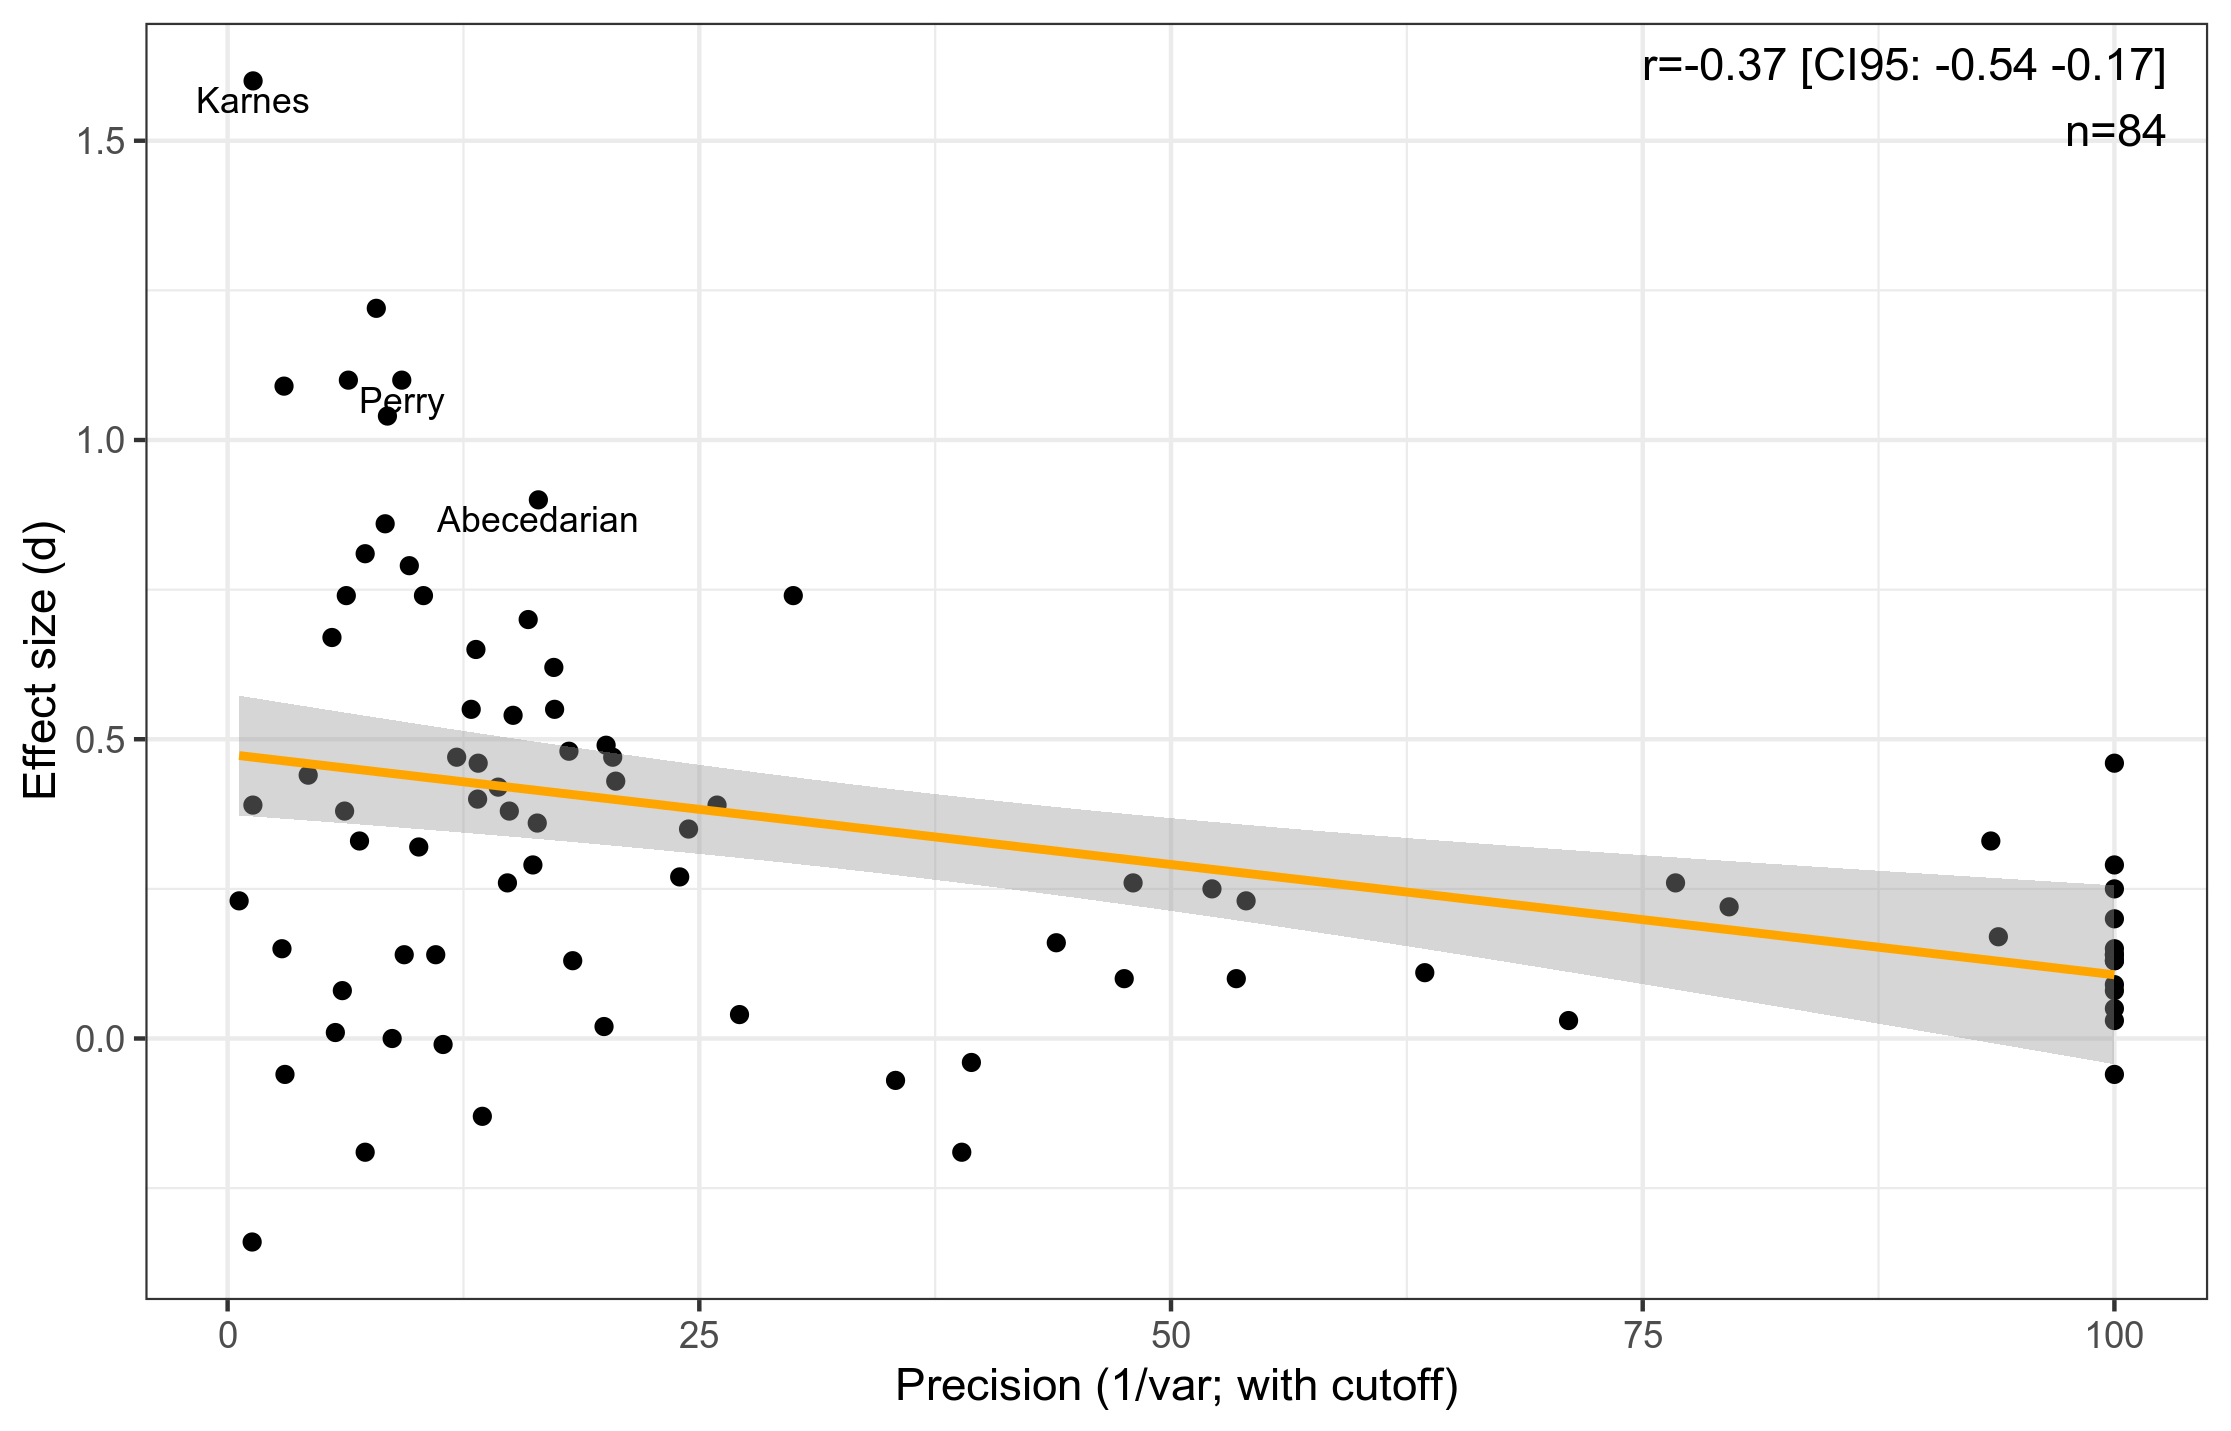
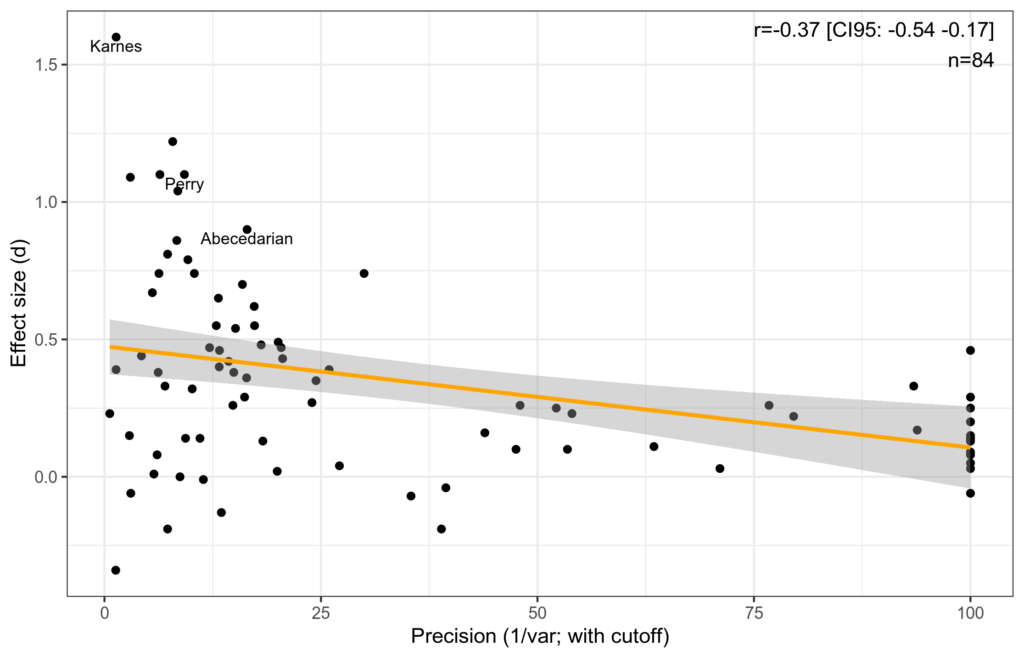
The first plot shows the association between statistical precision of a study, mainly it’s sample size, and the reported effect size. Perry is one of those tiny studies with huge effect sizes. The second plot shows the date of studies and their effect sizes. These decline with age, presumably because newer studies are higher quality in general, and larger. Perry is among the oldest. This is a collection of 84 such studies collected by authors sympathetic to this kind of work. We can guess at the results being even less convincing if a skeptic had collected them.
You almost have to be dumb to believe this stuff. Suppose you went to the doctor with a health issue. He tells you about a drug he suggests for this issue. You inquire about the evidence for this treatment. He gives you a 62 year old study (!) of 123 persons. You go home and read it. Why not a newer study? And why is it so small? You then find out that there are lots of modern studies on this drug or very similar ones, some with more than 10 times larger sample sizes. Next week you go back to the doctor. You ask the doctor why he likes that one study so much? He tells you it found very impressive results. You are on your way out of the door, when the doctor says, wait, there’s a new study too. You ask how many people they sampled this time? Oh it’s the same 123 people. Actually, there was a drop-out of 17% because the usual reasons (“2% were not surveyed because they were deceased, and 5% were not surveyed for other reasons”), so now there’s 102 people left. You go home and read it anyway. The main results look like this:
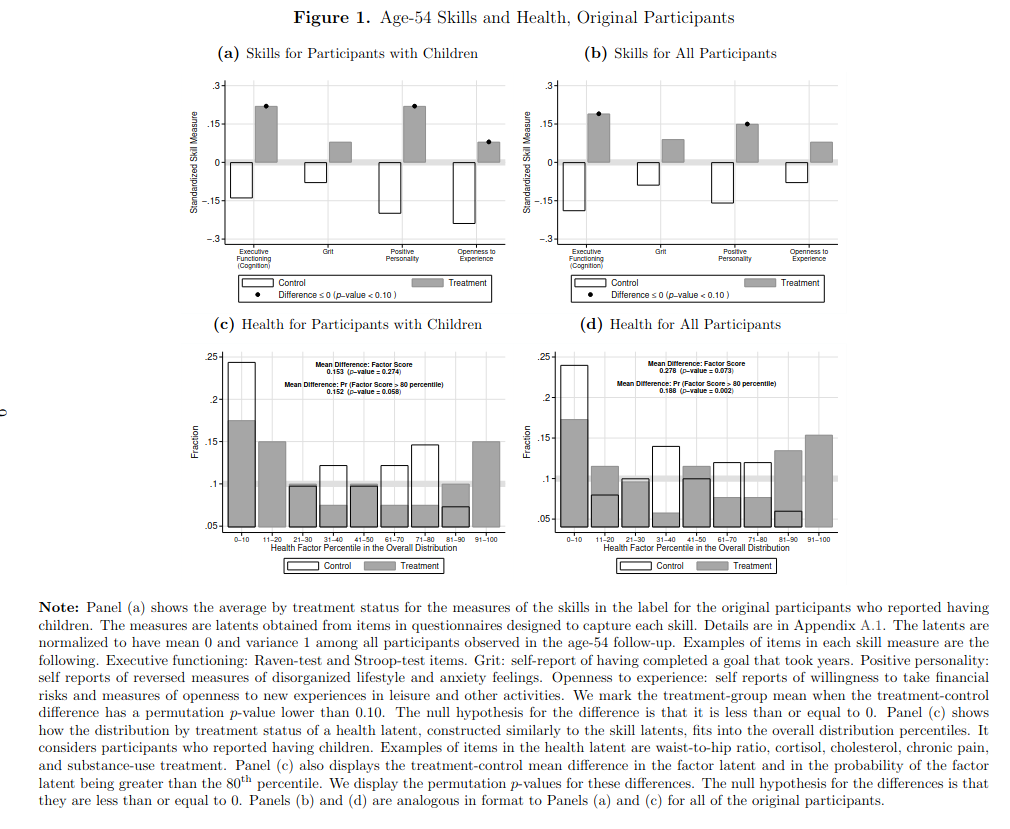
They are using p < .10 as their level of evidence. They come up an ad hoc new test variant (probability being above 80th centile), and yet they only achieve p values of .27, .06, .07, and .002 for their 5 tests. The only convincing result is the one for their odd test, the normal tests are not impressive. And the next plot:
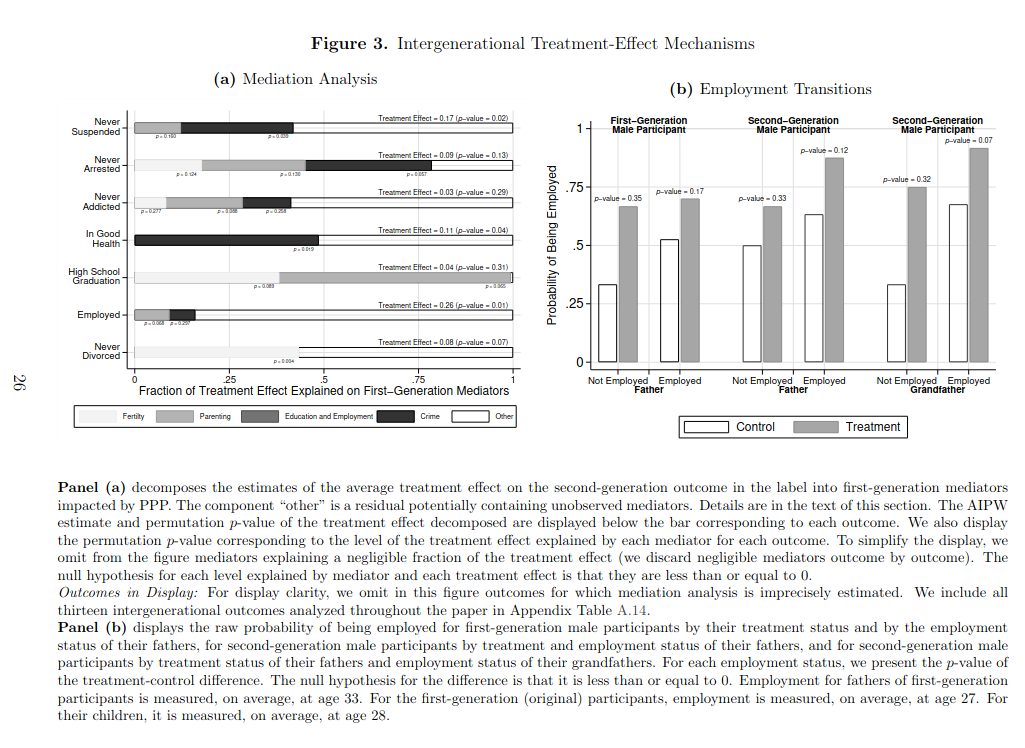
We can see: p = .02, .13, .29, .04, .31, .01, .07. Not a single p < .01. There’s a reason this guy is called James Hackman.
Time passes, you go back to the doctor. You angrily scold the doctor for wasting your time twice. Obviously, if he wanted to add evidence to his treatment, he would have gathered data from new subjects since this avoids the most likely source of error: sampling error in the original sample.