So the cool kids are talking about vaccine effectiveness, and the problems of estimating this. The simple starting point is to take government statistics about deaths or hospitalized cases or something, and then compare the rates for vaccinated vs. not. If we look at e.g. the American veteran data (SARS-CoV-2 vaccine protection and deaths among US veterans during 2021), we get this finding:
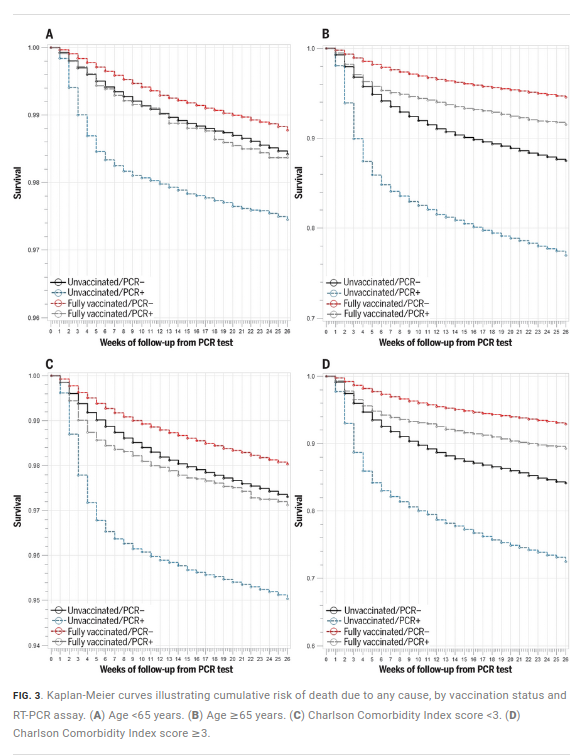
These are survival curves. You want a flat curve since that means immortality. Sadly, we are not there yet. But it’s better to have a flatter curve. Now, pay attention to the colors. Of primary interest here are the vaccinated with COVID and those without vaccination who also got COVID, so that’s grey vs. blue. Clearly the grey line is doing better, that is, staying as horizontal as possible (downwards = death). All seems good and we can estimate some effect of the vaccine against COVID this way, which the authors work out to be like 70-80%. But wait, let’s look at the negative control, the people who didn’t get COVID and differ in vaccine status. These are the black and red lines. Huh, the red line is doing a lot better than the black one. In fact, in several plots, the grey line is doing better than the black line. The vaccinated people who got COVID die less than vaccinated without COVID. 🤔🤔 It seems like vaccines prevent deaths other than COVID.
OK, we aren’t so stupid, we know these are not randomized controlled trial data, these are American veterans that elected to get vaccinated or not, so there’s some self-selection bias insofar as vaccine takers vs. non-takers differ in health (and everything else). This is the healthy vaccinee bias, somehow people who get vaccinated are quite a bit healthier overall. At least, that’s the theory. But the evidence above shows that adjusting for age (plot A vs. B), or other other illnesses (C vs. D) does not seem to affect the results that much. Strange? OK, maybe we need better controls. The plots above didn’t really adjust properly (crude cut-off), we need a full multivariate model adjusting for lots of stuff with continuous predictors. Can we get that? Sure, here’s some data on vaccines in Danish healthcare workers (Association of AZD1222 and BNT162b2 COVID-19 Vaccination With Thromboembolic and Thrombocytopenic Events in Frontline Personnel). The results:
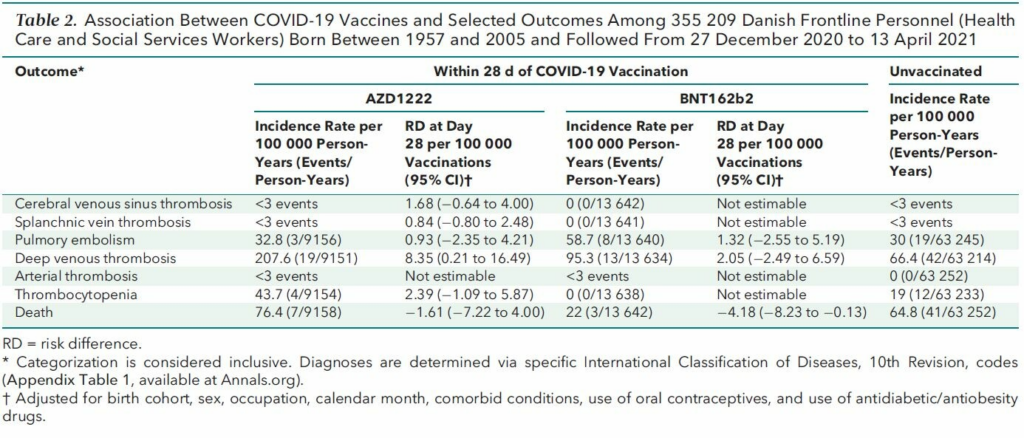
We just care about the last row, death of any cause, though here within 28 days. Not ideal, we want long term, but bear with me. The RD column is the one with adjusted results, and these are negative, though not convincingly so (first one is p > .05, last one is close to .05). Got something better? Yep, there’s a full population study of Denmark and Norway too (Arterial events, venous thromboembolism, thrombocytopenia, and bleeding after vaccination with Oxford-AstraZeneca ChAdOx1-S in Denmark and Norway: population based cohort study):
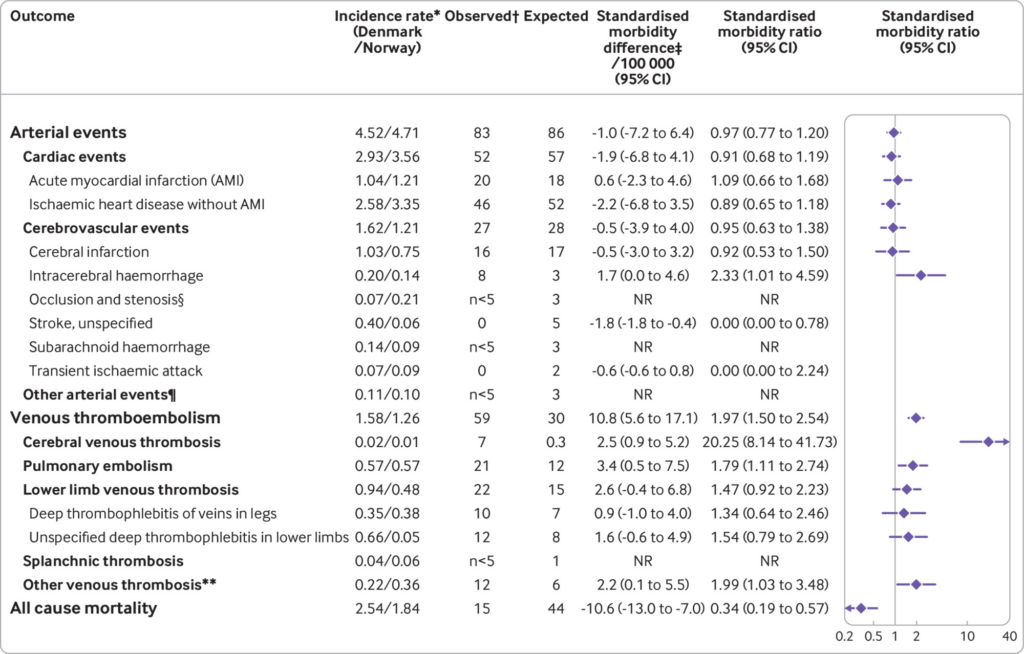
Here we see the pattern even clearer. In the large groups here, we expected some 44 deaths in the follow-up period, but we only see 15, making for about 2/3 decline in mortality rate (SMR = 0.34). Kinda amazing right? This is already adjusted for age and sex, so we can’t just be looking at some obvious age confound. In fact, going back at the healthcare worker study, we can compare the demographics:
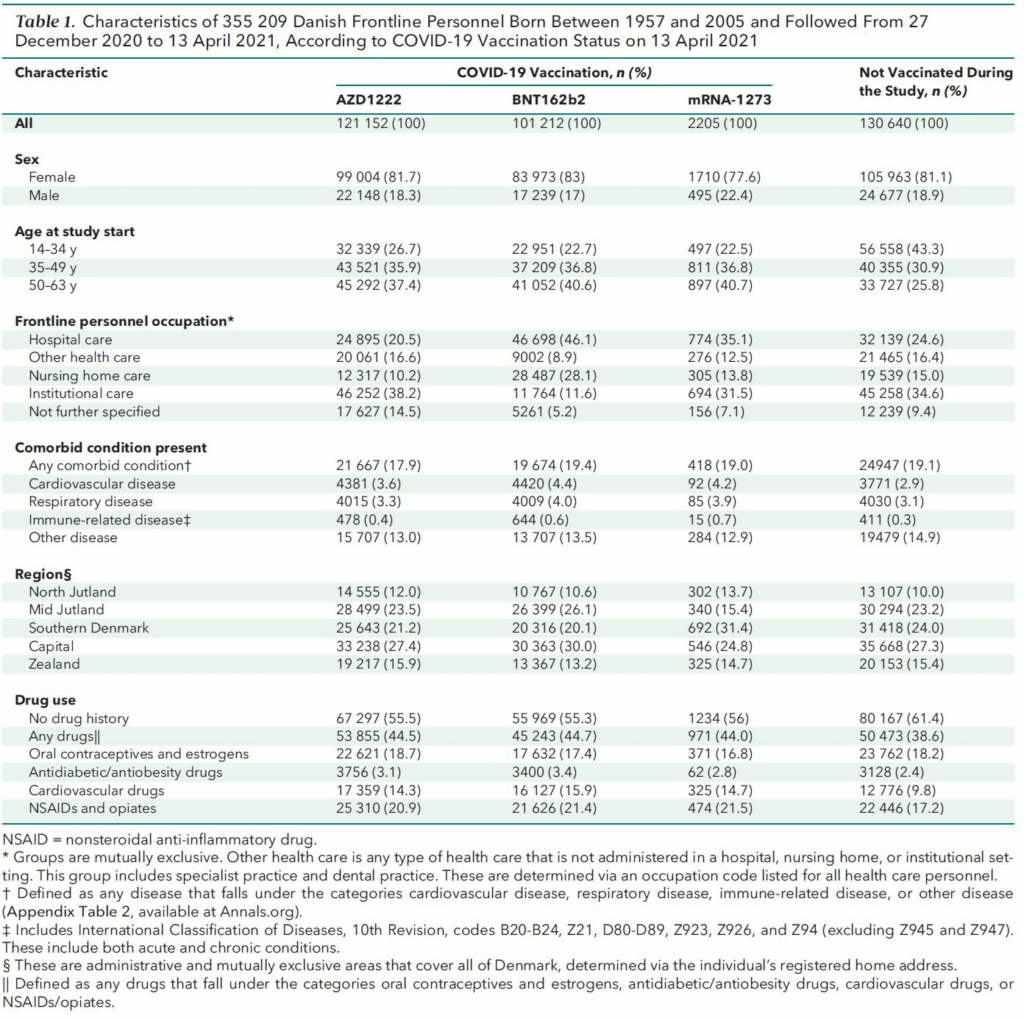
So the people who got vaccinated first are actually younger and thus more healthy. This bias would be in the wrong direction to explain the results.
What about specifically looking at COVID vs. non-COVID deaths? OK, the doctor/coroner diagnosis of death are maybe not entirely accurate, but they are somewhere between somewhat and pretty accurate. Fortunately, the UK supplies such data, and we see:
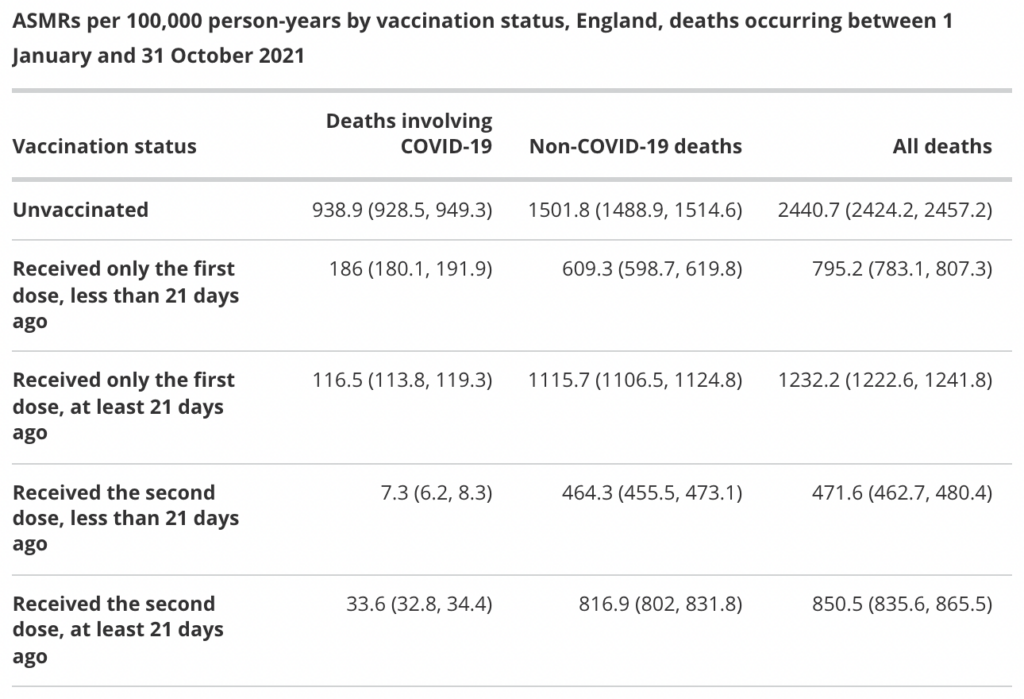
So we look first at the COVID vaccine effectiveness first. In left column, the rate of COVID deaths are some 940 vs. 34, which makes for about 96% effectiveness. Very good! As before, we check the negative control in the right non-COVID column: and it’s 1502 vs. 817, or about 45% effective against non-COVID deaths. So, what is up? I can think of some theories:
- Healthy vaccinee bias theory: People who avoid vaccines are somehow quite more unhealthy and our controls somehow can’t capture this properly.
- Medical records of deaths and COVID are totally messed up theory: this might cause weird results.
- Magic vaccine theory: Vaccines really do reduce death from other causes.
The last one is pretty interesting. Can we validate this idea somewhere else? Yes, we can, because there’s another vaccine we often collect data about effectiveness of and also rely on not randomized controlled trials: yearly influenza vaccines. And there are studies of selection bias there too. Actually so many one can do a systemic review/meta-analysis (Frequency and impact of confounding by indication and healthy vaccinee bias in observational studies assessing influenza vaccine effectiveness: a systematic review, 2015):
Background Evidence on influenza vaccine effectiveness (VE) is commonly derived from observational studies. However, these studies are prone to confounding by indication and healthy vaccinee bias. We aimed to systematically investigate these two forms of confounding/bias.
Methods Systematic review of observational studies reporting influenza VE and indicators for bias and confounding. We assessed risk of confounding by indication and healthy vaccinee bias for each study and calculated ratios of odds ratios (crude/adjusted) to quantify the effect of confounder adjustment. VE-estimates during and outside influenza seasons were compared to assess residual confounding by healthy vaccinee effects.
Results We identified 23 studies reporting on 11 outcomes. Of these, 19 (83 %) showed high risk of bias: Fourteen due to confounding by indication, two for healthy vaccinee bias, and three studies showed both forms of confounding/bias. Adjustment for confounders increased VE on average by 12 % (95 % CI: 7–17 %; all-cause mortality), 9 % (95 % CI: 4–14 %; all-cause hospitalization) and 7 % (95 % CI: 4–10 %; influenza-like illness). Despite adjustment, nine studies showed residual confounding as indicated by significant off-season VE-estimates. These were observed for five outcomes, but more frequently for all-cause mortality as compared to other outcomes (p = 0.03) and in studies which indicated healthy vaccinee bias at baseline (p = 0.01).
Conclusions Both confounding by indication and healthy vaccinee bias are likely to operate simultaneously in observational studies on influenza VE. Although adjustment can correct for confounding by indication to some extent, the resulting estimates are still prone to healthy vaccinee bias, at least as long as unspecific outcomes like all-cause mortality are used. Therefore, cohort studies using administrative data bases with unspecific outcomes should no longer be used to measure the effects of influenza vaccination.
So uh, according to Healthy vaccinee bias theory, when we adjust for selection bias, vaccine effectiveness should decrease, but they actually find that it goes up! I don’t know what magic vaccine theory predicts, since it is not much of a theory, BUT it at least doesn’t predict the wrong result, which is always a good start.
Concluding thoughts
“OK, so be serious Emil, what is really up?” No idea, but it seems like we cannot rule out that vaccines just in general induce mildly to amazingly positive effects, perhaps by training the immune system in unexpected ways, or causing beneficial stress on the system á la radiation hormesis, and the various postulated anti-aging effects of thermotherapy and what not. The good news is that it seems really easy to get some mice and inject them with a bunch of mouse vaccines for whatever, and see if this makes them live longer even though they didn’t actually get infected by whatever the vaccines protect against. Moving back to the human situation, it seems we cannot avoid having to claim some overestimation of vaccine effectiveness to make the country data fit the vaccination data. Overestimation of vaccine effectiveness must imply some kind of issue, most likely selection bias (i.e. healthy vaccinee bias) but then how do we make that fit with the results above? It’s all very curious.