Readers may recall that about 12 years ago, Ron Unz (of Unz.com) posted an article The Myth of Hispanic Crime. In this article he tried to show that Hispanics were not actually elevated in crime rate. His method was:
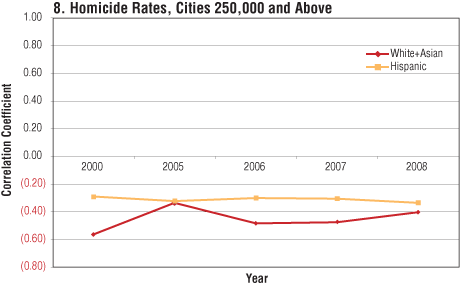
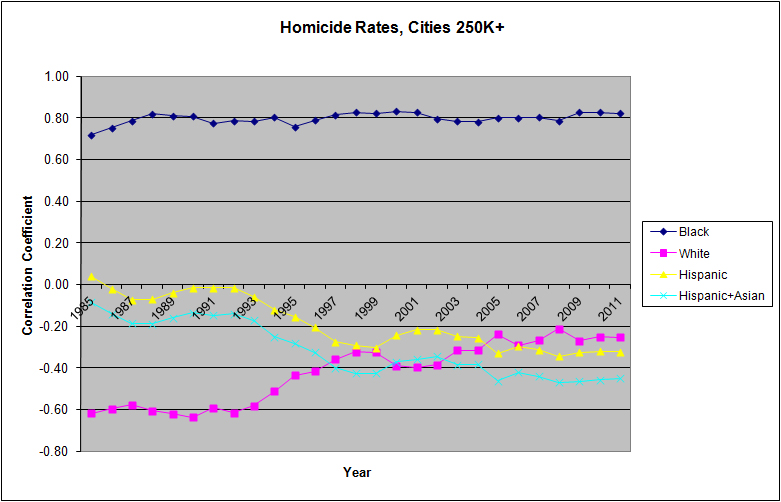
These individual city comparisons may be quantitatively extended to urban crime rates in general by calculating the weighted-average correlation coefficient between the Hispanic percentage of a city and its various crime rates and performing the same calculation for the white-plus-Asian percentage as well. (Asians are a very small population in most cities, so it is convenient to combine them with whites; since all studies show Asians tend to have much lower crime rates than whites, this will tend to reduce the apparent white crime rate.) Whereas all the previous urban crime figures quoted were from 2008, the latest year available, we can obtain the separate correlations for the last several years in order to consider trends over time.
As Charts 8-13 indicate, the Hispanic and white-plus-Asian crime correlation rates are usually quite close and in many cases have converged to almost identical values, at least since 2005. Moreover, we must remember that all these ethnic percentage rates refer to the total population rather than the percentage of young males in the high-crime years for each group, and as mentioned earlier, the age distributions for Hispanics and whites are very different. In fact, if we repeat these same correlation calculations for the population of males aged 18-29, the Hispanic and white rates substantially diverge, with young Hispanics usually being associated with significantly lower urban crime rates.
This gets him to plots like this:
And later in 2013, he posted another piece titled Race and Crime in America also with results like these:
To the statistically savvy reader familiar with compositional data analysis, the error is probably obvious. However, I searched the 700+ comments on these posts, and it wasn’t mentioned anywhere I could see. We can show the error by redoing the analysis in part. First we download the city crime rates from Wikipedia. These are based on 2019 numbers from FBI. There’s 100 cities on this list which is probably fine for our purposes. It includes every city with a population of 216k or more (you can download the full dataset on the FBI website). [now comes the torture part] The racial demographics for US cities are harder to find. Wikipedia has some pages, but they don’t have data for all the 100 cities. This website has a lot of nice data. Unfortunately, after downloading and analyzing it, I found that data they coded Hispanics as special category that can combine with the others, so the percentages don’t sum to 100% but instead some larger value. (At some point someone will have to explain to me the bizarre American habit of treating Hispanics as a different kind of category than the other ones.) The government has this website where one can look up statistics, but who is going to input each combination for the 100 cities? The government also has this site where one can find the non-Hispanic White %, but not the ones for Blacks (why?). Having exhausted the easy options, I looked at the US census data files. You probably guessed it: they are absurdly complicated and poorly documented (what is in csv_hak.csv? Not explained anywhere!). So I didn’t give up, I downloaded all the 106 files. And then looked at the documentation for the variables. Naturally, the government refuses to give you just a city ID, or even a county ID. They give you something else, a PUMA ID. A what? A very nicely chosen word you can’t Google due to search pollution from animals and shoes named after animals. Something something privacy rules. It’s another unit of intermediate size between counties and states, and there seems to be ~2400 of them. Anyway, there is a list where you can convert PUMA codes into names of areas (like “Salt Lake County–West Jordan (East), South Jordan (East) & Riverton Cities PUMA”), but they are again not quite what we want. Suppose you want data for the first city in the Wikipedia list, St. Louis in Missouri. You find the Missouri list, and it has split the city in 2 (and there’s also a number of St. Louis County areas). It seems to get these data to work, one would have to check every state to find the codes for each city, then combine the PUMAs covering the city. And only then finally can one do a population count using the Race and Hispanic variables (RAC1P, HISP). Anyway, after downloading the 106 data files (6 GB), and I used the well known heuristic of trying the smallest and largest files first. It wasn’t the smallest file. Oh, yeah, and the largest file is actually split in 4, and when you tell R to read the zipped CSV, it only reads the first file in the zip and doesn’t tell you there’s 3 more, so you get no results for some areas and wonder if they just totally forgot to sample anyone from Detroit. ANYWAY, so I computed all the proportions and merged the data, and you can download them here to save you the pain. [end torture part]
We first examine the correlations among the population proportions:
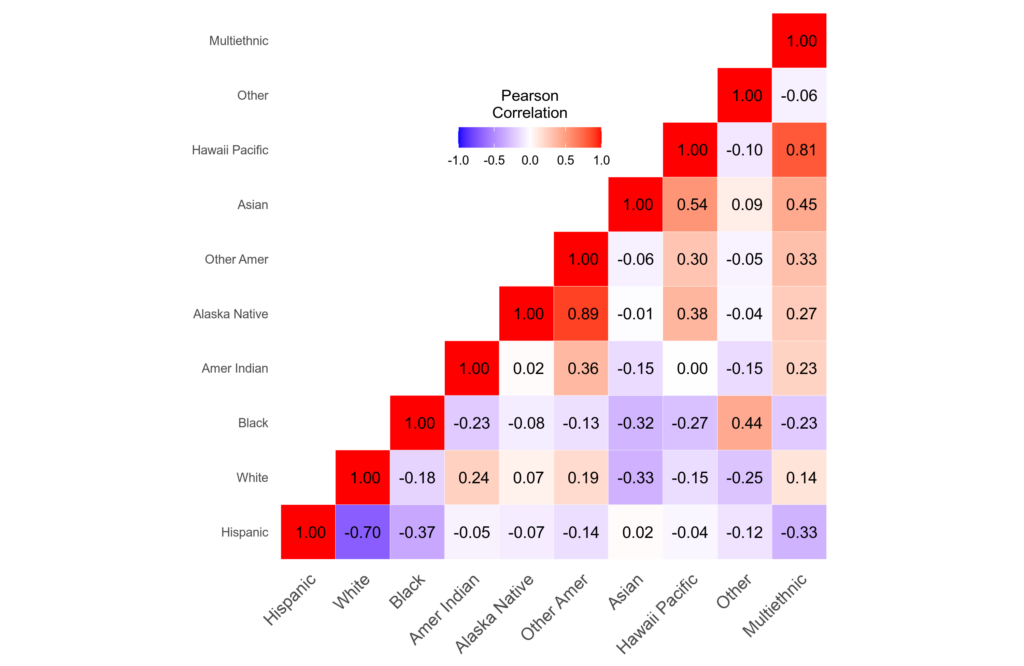
OK, they are mostly negative. This is of course because when there’s a larger proportion of one group, there will have to a smaller proportion of another group. Due to the non-random distribution of groups across the units of analysis, you can end up with areas with high proportions of groups A and B, and so groups A and B can have a positive correlation despite the fixed-sum nature of the data. We see this in an extreme case for Alaskan Natives and Other Amerindians (these are different tribes of American Natives, and they generally live in the same areas). For the larger groups, though, we see the negative correlations: Hispanic% is correlated at White% at -.70, -.37 with Black%, and -.33 with multiethnic.
Finally, let’s look at the crime rate correlations with these racial proportions:
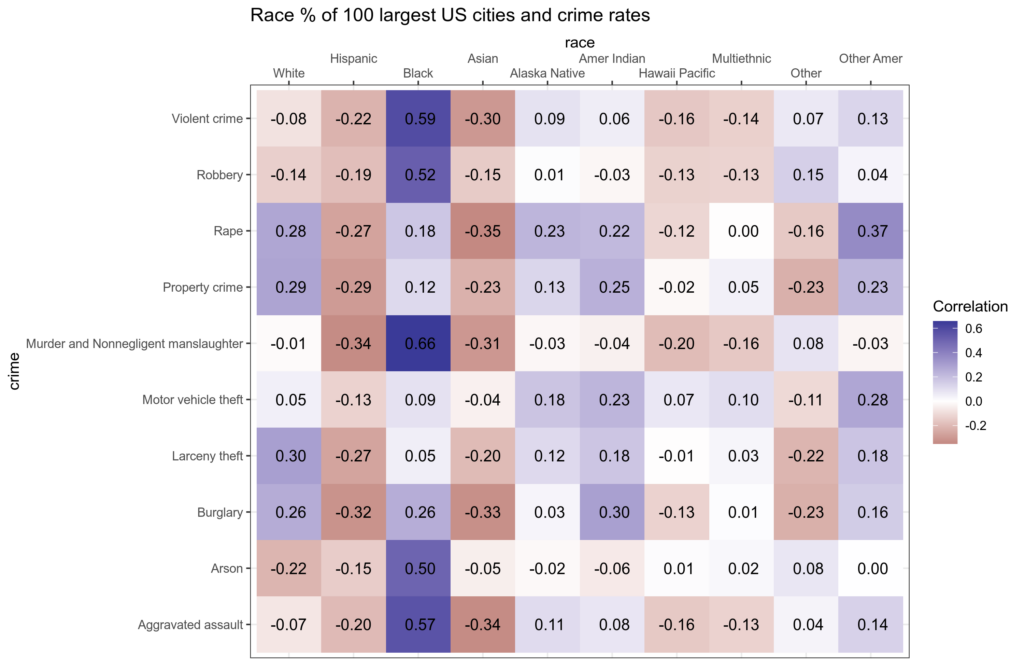
The second column replicates the results Unz reported: Hispanic% is weakly negatively related to crime rates across types. So are Hispanics less criminal than average? Well, maybe, but we also see something more obvious in the data: Black% is the only group with large positive correlations. It seems that Blacks’ role in crime is so large that they deflate the correlations to other group proportions even though they may also be above average criminal. There is of course an easy way to tackle this problem: multiple regression. Here’s how the models looks like:
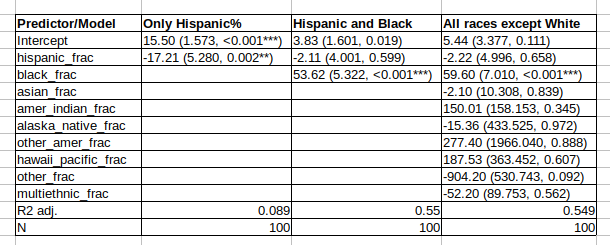
The outcome variable is the murder/homicide rate, which I used because the total violent crime rate was missing for a few cities. The first model shows issues because we can see that a … PUMA with 100% Hispanics is predicted to have a crime rate of -1.30 (add the intercept and slope). Linear regression does not understand that the outcome cannot be negative. Anyway, in the second model, we add the most important variable, Black%. Now the model is a lot better, R2 went from 9% to 55%. Hispanic% still has a negative coefficient, but it is p = .599, and close to 0. If we add the remaining variables, this changes essentially nothing, and the model doesn’t even improve, probably because we have too few cases for this modeling (n=100). We cannot add White% here because we are using it as a baseline group for comparison. Anyway, we see that there is now no evidence of Hispanic% being negatively associated with crime rate. That conclusion was a mistake based on the confounding factor of Black%. The strong dominance of Black% is also seen in Unz’ figures, so it is rather strange he didn’t think to try a regression model. Maybe because it cannot be done in Excel.
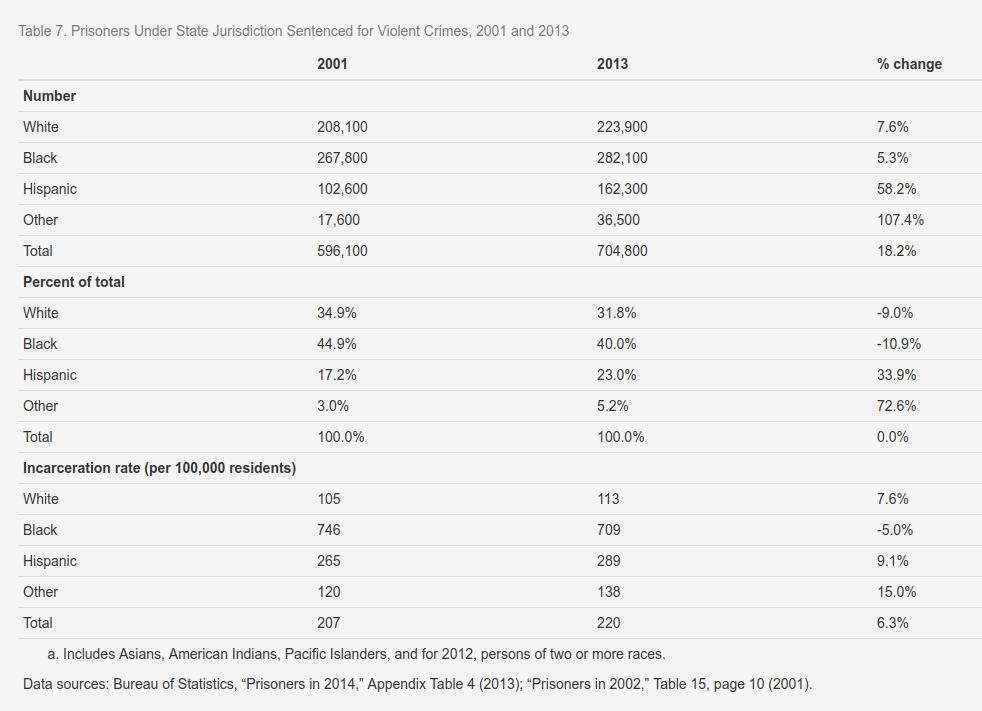
Of course, there is no particular reason to examine the question at the aggregate level. If we want to know whether Hispanics are more criminal than Whites, we can just look up statistics based on persons. While the FBI etc. did not previously distinguish between Hispanics and Whites properly, they do so now a days. The go-to report for race and crime from a realist perspective is The Color of Crime report by American Renaissance. There’s a 2016 version here. We can look at e.g. incarceration rate for violent crime:
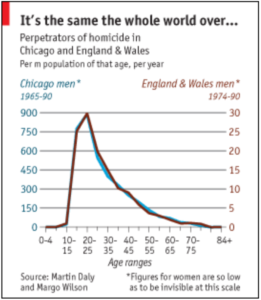
These data are not age adjusted, and Unz points out that age is a confounder since Hispanics are younger and younger people are more criminal. True, so we can look at some model results, say, based on longitudinal studies like the NLSY’s. NLSY1979 is too old, there weren’t a lot of Hispanics back then. The follow-up NLSY97 has about 1,900. The subjects in the survey are all born around the same time, so there’s negligible sex and age differences in these data. They asked the subjects how many times they had been arrested. The distributions look like this:
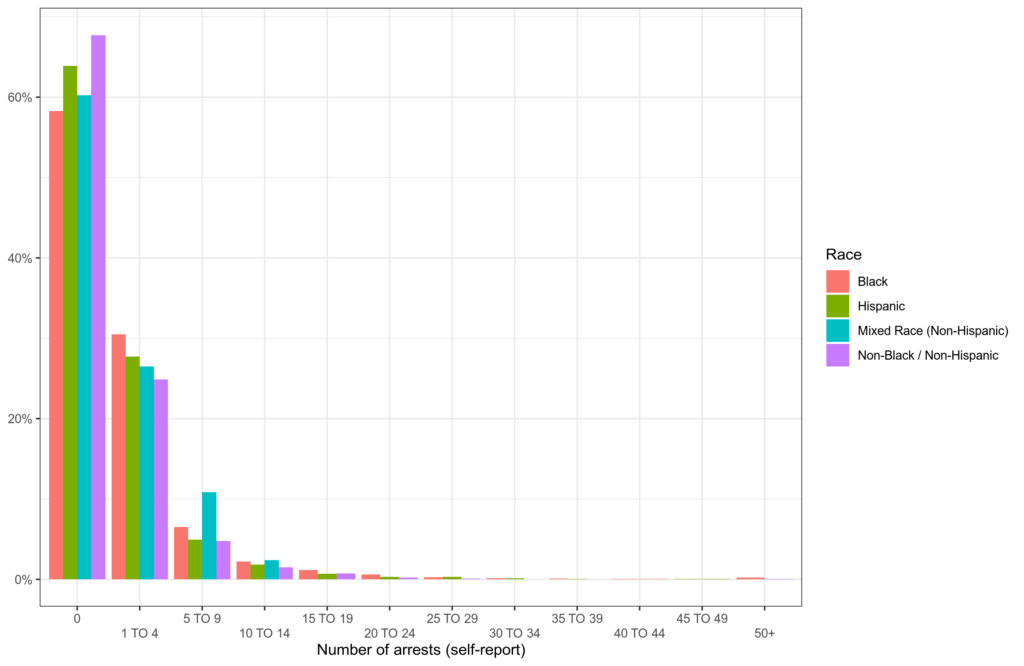
The White-Asian-other group is the purple, Hispanics in green. They are getting arrested somewhat more even by self-report standards. As we already know self-report standards for criminals aren’t too good, these are probably underestimates of true differences.
Ron Unz is needlessly bombastic. The elevated Hispanic crime rate is well documented. His use of correlations with compositional data was the key mistake instead of the more obvious and an standard multiple regression. Various government data and independent data show clearly that Hispanics are elevated in crime. There is no myth here. There is however, a true mystery with Hispanics, namely that they live longer than Whites. This is puzzling because of their generally worse social status (income, education, occupation etc.) and intelligence, and obesity rates, which create an expectation of shorter lifespan. Wikipedia has a decent page on this one — for now.