Back in April, I posted the results of my predictive model about Marine Le Pen’s winning chances. The model produced a much higher chance of victory than most other people were giving her. Given my equally bold prior success at predicting Brexit, I had somewhat more trust in this model than was perhaps wise. Still in the end of my post I wrote:
So I am pretty cautious about being too far from the consensus here. My Metaculus as seen above is about 33%, already about twice the median. Still, this feels a bit like a repeat of Brexit polling. Everybody had access to the same data, but somehow they are very confident what the data shows is likely will not happen. What extra knowledge do the others have? There doesn’t seem to be much of any they could have. For this reason, I am going to go halfway between the prior from the betting odds/Metaculus of 18%, and my model forecast of 93%, and give Le Pen 55.5% chance.
So, giving half weight to the prior from other sources and the model. In the end, she didn’t win. This of course did not surprise me considering that my prediction was a 56% chance — a coin flip. Still, it is interesting to look back at the model and see how later polls turned out compared to what the model predicted. Here’s the prediction from the model from the last post:

Not too easy to see, we need to get closer. Here’s a redone plot, changing nothing but the zoom, which I set to 2022 data only:
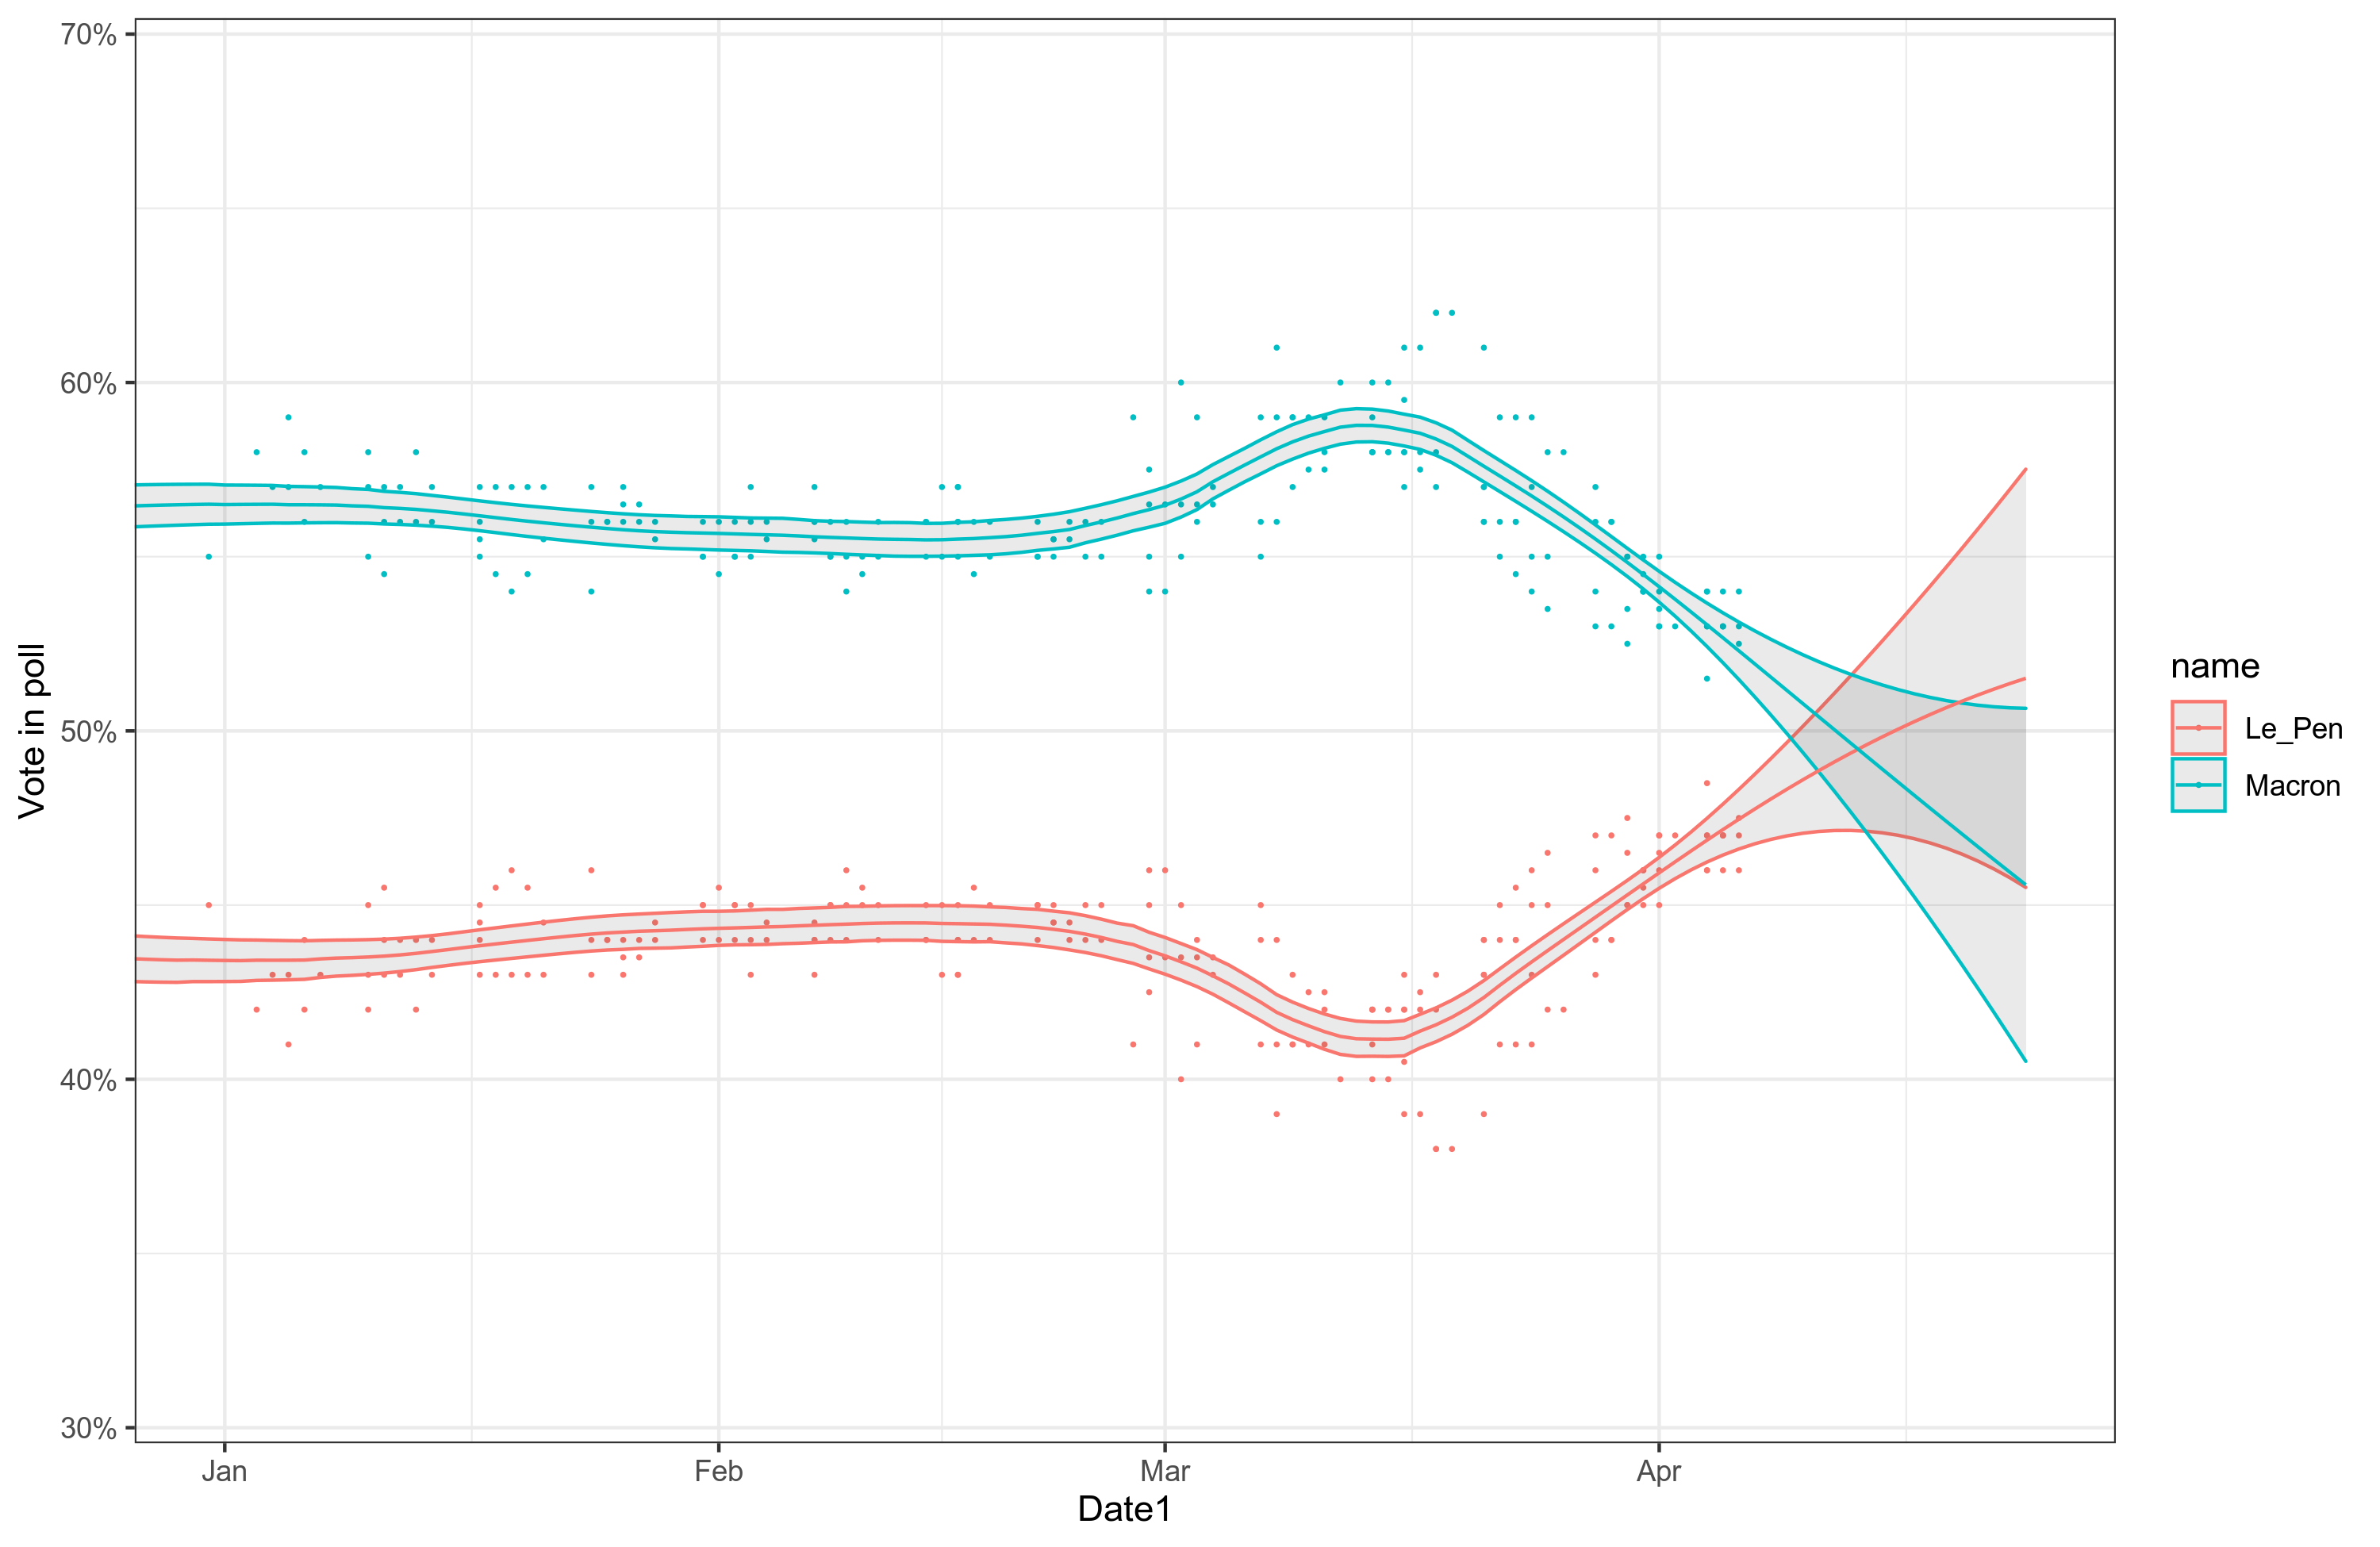
Now it’s a lot easier to see what is modeling forecasting and what is actual data. It looked pretty good! But alas, it went like this:
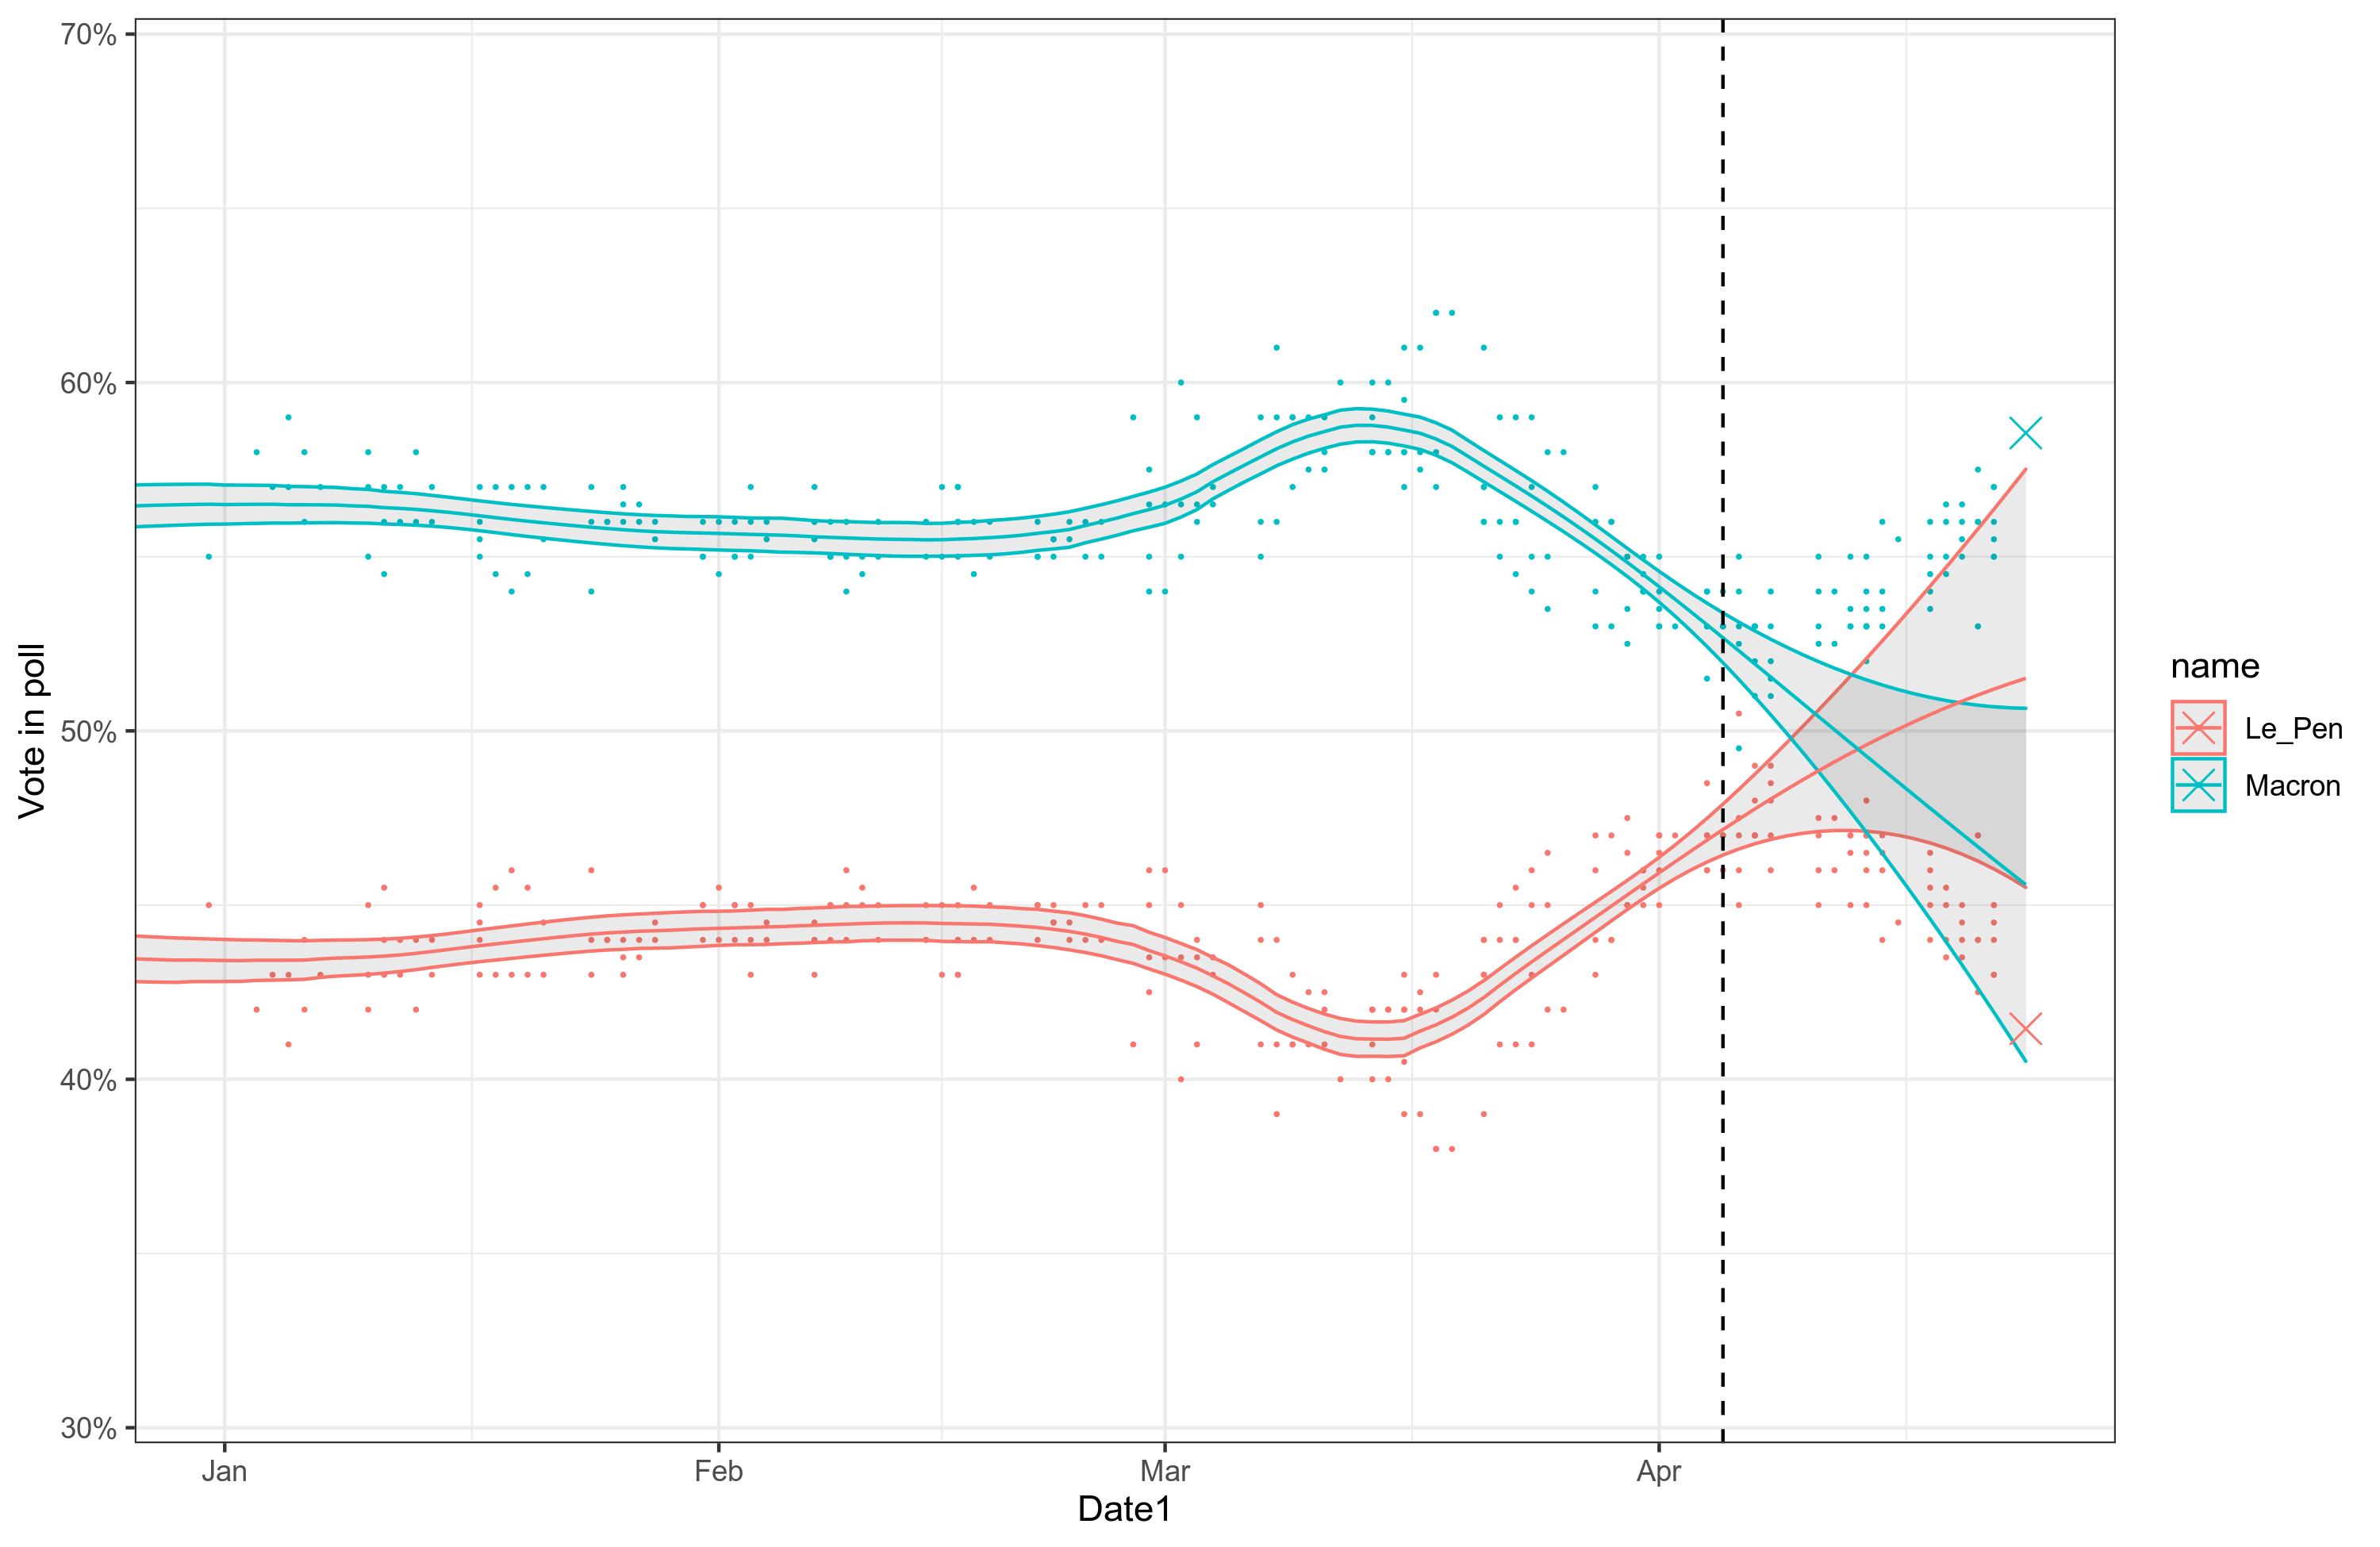
The black line shows the data of last data used for the line. The dots afterwards are the new polls that were made published afterwards but unknown to the model. The big crosses at the end are the election results. The model was way off! The results are not even in the 95% confidence intervals. We can also see why. Immediately after my model was made, the pattern in the polls turned. This was presumably due in part to a scandal about EU funding misuse. As far as I can tell from my limited French, the first news of that was from 16th April, so the timing doesn’t fit entirely as her decline started sooner, but it partially fits as she continued her decline after it was announced.

One probably doesn’t have to be very conspiratorial to think that the EU agency deliberately waited to release this news until shortly before the election, in the same way Big Pharma delayed their vaccines in order to not give Trump good news to use for re-election. (Naturally, the usual people deboooonk this claim with typical lies about ‘no evidence’.) Anyway, so all in all, I am not too sad about my prediction going mildly wrong, as I didn’t trust it that much above the prior.
One interesting thing to note from the plot is that Le Pen actually did worse than the polls showed, even taking into account the predicted movement the last 2 days. She got only 41.45% whereas the last polls had her at about 44%. Polls seem bias in favor of Le Pen. Curiously, this was also true for the 2017 French election run-off, also with Macron and Le Pen. Here’s Wikipedia’s plot:
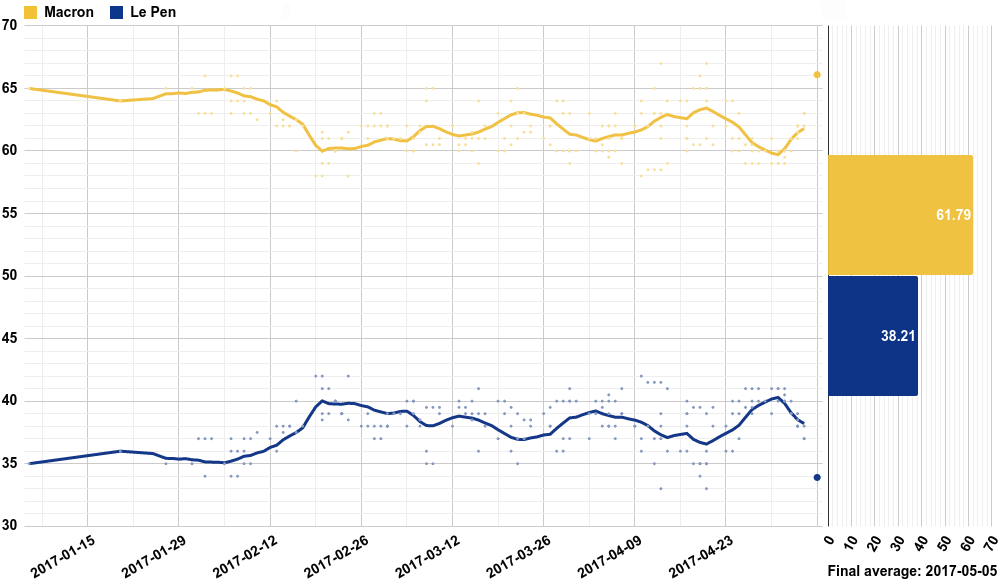
This is pretty interesting because it contrasts with the usual poll bias against nationalist candidates. When this shows up in the UK, they call it the shy Tory effect. In France, it appears they have the opposite bias, and quite strong! I should have checked the 2017 data to check for this. That’s a lesson to learn.