Anon asks:
Dear Emil Kirkegaard,
I just read your article about the intelligence quotient being very arbitrary and not being able to divide or multiply with it, what about raw scores on the WAIS for example?
Can someone claim for example that he has 60% better memory than someone based on raw points?
The question is actually very deep and important to psychology. But let’s backtrack a little first. Back in the dark middle ages, humans had concepts of warm and cold, but no real way to measure these precisely. During the renaissance, various simple thermometers were invented that could capture some level of temperature variation in a nonsensical unit (mercury level, invented in 1714 by Fahrenheit). Mercury’s level inside a tube is not really what temperature is about, but it works as a way to tell whether it is relatively warmer in one place or another, and by how much. Later yet, physics and chemistry developed the theory of thermodynamics. We now understand that what we feel as temperature is really about the average movement of (to us) invisible molecules. The more they move, the higher the temperature. If they don’t move at all, that’s zero temperature (0 Kelvin). A mercury thermometer cannot measure this, nor can any other household thermometer, but science eventually devised methods for measuring temperature at the full range. Importantly, since 0 Kelvin is really 0 temperature (unlike 0 Fahrenheit or 0 Celsius), one can do any mathematical operation with the temperature data in Kelvin, as it’s a ratio scale (i.e., with a true zero, and with true intervals). Importantly, concepts like multiplication don’t make sense when a given scale has no true zero. Suppose it’s 10 Celsius outside, and 20 C inside. Is it twice as warm inside? Some might say yes. But what if it’s -10 C outside and 10 inside, is it -1 times warmer inside? Clearly, the math doesn’t work out this way.
Into the Flynn effect
Our psychology measures are usually not like the Kelvin scale at all. In 1987, James Flynn famously reviewed the evidence on what we now call Flynn effects, and he noted:
Clearly much the same is true of the Ravens and intelligence. The Ravens test measures a correlate of intelligence that ranks people sensibly for both 1952 and 1982, but whose causal link is too weak to rank generations over time. This poses an important question: If a test cannot rank generations because of the cultural distance they travel over a few years, can it rank races or groups separated by a similar cultural distance? The problem is not that the Ravens measures a correlate rather than intelligence itself, rather it is their weak causal link. When measuring the real-world phenomenon we call a hot day, we use the height of a column of mercury in a thermometer as a correlate, but note that this correlate has a strong causal link that allows it to give sensible readings over time. A thermometer not only tells us the hottest day of 1952 and the hottest day of 1982, it also gives a sensible measure of whether the summer of 1952 was hotter than the summer of 1982.
The problem is more general than just the Raven’s tests or intelligence tests, nearly all psychological tests have this problem. But first, let’s clarify a few things The Standard Raven Progressive Matrix test (SRPM) has 60 questions (called items in psychometrics). Thus, when a person is scored on the test, they get a raw score from 0 to 60. That raw score is a ratio scale, but it doesn’t map unto intelligence as a concept as a ratio scale. 0 items correct on the Raven test does not mean zero intelligence. Many animals and some people will fail even the first item, but they have some level of intelligence, so the 0 on the Raven is not really zero intelligence, but rather some low indefinite amount. In a similar vein, if we made a new Very Hard Matrices test, where the first item is very difficult, then the scores of 0 on this test would also not correspond to zero intelligence, as even many average intelligence humans would fail them. The lesson here is that since making a test like a Raven test involves picking out/inventing some items, and our choice for picking these is arbitrary with regards to the true zero of the concept, the test cannot be measuring a true zero of intelligence. This is why it doesn’t make much sense to talk about how much smarter one person is than another in percentages. If you got 50 items right on the Very hard Matrices test, and I got 25, you aren’t twice as smart as me, since a score of 0 doesn’t correspond to zero intelligence. If we had both taken the colored Raven’s test instead (a children’s test), both of us would probably get a score of close to the maximum, making the percentage difference go away. The test is quite easy and moderately smart people will hit the ceiling, like a (poor) thermometer that cannot measure who has the highest fever because it cannot measure over 40 degrees Celsius.
But we have some other options available. Digit span is sometimes mentioned as a ratio scale of sorts. Here we ask the subject to listen (or read) some numbers, and they have to repeat them back to the test administrator. We can keep adding numbers and see how many they can do at most. Here again, one can obtain a score of 0, and in some sense, this is somewhat less arbitrary than the score on the Raven tests. But still, a digit span score of 0 does not really correspond to zero intelligence. Rather, it it could reflect some kind of problem with the subject, say, we tested a deaf person, someone who speaks another language, or who was asleep etc., or maybe we were testing a baby too young to understand the task. Of course, we can stipulate that the testing session must be under certain conditions to be valid (the subject must be awake, speaking the right language, must be able to hear and speak, at least 3 years of age etc.), in the same way that a mercury thermometer doesn’t work under arbitrary conditions either. Allowing all of these still doesn’t mean that a score of 0 on digit span corresponds to zero intelligence in the way that 0 Kelvin is really zero temperature. The problem here is that we have no mathematical theory of intelligence in itself. This is true not just for intelligence, but for every psychological trait that we usually talk about. No one knows how these can be defined in the same way as we define temperature in physics/chemistry.
Another more basic attempt at a ratio scale of intelligence is summarized in Arthur Jensen’s final book Clocking the mind (2006):
Mental chronometry is the measurement of cognitive speed. It is the actual time taken to process information of different types and degrees of complexity. The basic measurement is an individual’s response time (RT) to a visual or auditory stimulus that calls for a particular response, choice, or decision. The elementary cognitive tasks used in chronometric research are typically very simple, seldom eliciting RTs greater than one or two seconds in the normal population.
Just another methodology for psychology? Mental chronometry undeniably has its own methodology. But it is also much more than just another method of what psychologists know as data analysis. Chronometric methods generate a generically different order of measurement than do any of our psychometric tests.
Scientific research and analysis are rightfully more than just data, numbers, mathematics, and statistical hypothesis testing, yet contemporary psychology has more than its share of these appurtenances. More than in most other scientific fields, research psychologists, especially differential psychologists, confront a plethora of journals, textbooks, and specialized courses on innumerable quantitative methods and statistical techniques. These all are offered wholly without specific reference to any of the field’s substantive topics, empirical or theoretical. In the physical and biological sciences typically the methodological aspects and analytic methods are more intrinsically inseparable from the particular phenomena and the theoretical questions that are more or less unique to the special field of study. Why?
A likely explanation of this condition can be stated as a general rule: The lower the grade of measurement used to represent the variables of interest, the more their quantitative description and analysis must depend upon complex statistical methods. Even then, the kinds of questions that can be answered by applying the most sophisticated statistical methods to lower grades of measurement are importantly limited. Quantitative research in virtually all of the behavioral and social sciences is based almost entirely on the lowest grade of measurement that can still qualify as being quantitative, that is, ordinal or rank-order scales. Chronometry, on the other hand, allows us to jump up to the highest grade of measurement, that is, a true ratio scale. Its crucial advantages, though mainly scientific, also have aesthetic appeal. The discovery of the form of a functional relationship between variables when measured on a ratio scale represents a scientific truth, a physical reality, not just an artifice of merely ordinal measurement or of any possible mathematical transformation to which an ordinal scale may be subjected. Measurements can always be transformed from a ratio scale to an ordinal scale, but never the reverse. One derives something akin to aesthetic pleasure in discovering a fact of nature that is afforded only by true measurement. Many relationships between different behavioral phenomena that we may accept as true by casual observation or from only ordinal measurement could, in principle, be illusory. Chronometric measurement, however, can in principle confirm or disconfirm beyond question their validity as scientific fact, of course, always within certain explicit boundary conditions. Hence, a graphic presentation of chronometric data represents a true relationship, a fact of nature.
An example of this is demonstrated by what I have called the first two laws of individual differences. They just happen to have important implications for interpreting the effects of education: (1) individual differences in learning and performance increase as task complexity increases; (2) individual differences in performance increase with continuing practice and experience, unless the task itself imposes an artificially low ceiling on proficiency. These lawful phenomena are amply demonstrated by a variety of reaction time paradigms. But they could not be demonstrated definitively with any form of measurement lower than a ratio scale. Because it has a true or natural zero point, it is the only type of scale that permits fully meaningful comparison of the relative differences between means and standard deviations, or the variance ratio, σ /μ.
It is also of significant importance that chronometric variables are related to psychometric measures of cognitive ability and especially to psychometric g. There is also a chronometric g factor, derived from a battery of various chronometric tasks, which is closely related to psychometric g. But chronometric data also reflect a more profoundly biological basis than do psychometric test scores. For example, it is a fact that IQ, and psychometric g even more, measured relatively early in the life span are positively correlated with individual differences in longevity. It was recently shown in a convincingly large sample that persons’ age of death is even more closely related to quite elementary chronometric measures, such as simple and four-choice RT, than it is to IQ (Deary & Der, 2005b). In fact, the RT measures are the primary basis of the psychometric correlations, as there was no significant relationship between IQ and longevity when the effect of RT was statistically removed. Also, statistically controlling several social background variables showed no significant effect on this result.
Individual differences in cognitive abilities must ultimately be explained in terms of the physical structures and functions of the brain. Much of the research and theorizing in the field of cognitive psychology has helped in describing more precisely the mental characteristics of variation in psychometric g and other psychometric factors than has been possible within the field of psychometrics. But the theoretical formulations of cognitive psychology are strictly mentalistic, and as such they afford no hooks or handles or leverage of any kind for discovering the physical brain processes that accomplish cognitive behavior or cause individual differences therein. The purely cognitive theories in vogue today posit an increasing number of metaphorical homunculi each performing some specific functions in a fictional mental realm that has no points of contact with the actual physical activities of the brain. It is psychology’s modern version of Cartesian mind–body dualism. Individual differences in the speed of information processing, for example, are either overlooked or attributed to the individual’s control of “attention,” which along with “cognitive resources” is one of the hard-worked homunculi in the metaphorical system. But this approach will not advance us to the promised land, as described by Spearman in his major work, The Abilities of Man (1927), in which he concluded that the final understanding of variation in cognitive abilities “… must come from the most profound and detailed direct study of the human brain in its purely physical and chemical aspects” (p. 403).
At present, explanations of individual differences in terms of actual brain processes are largely confined to studies of the anatomical localization of specific functions. This is now possible by brain-scan techniques, such as functional magnetic resonance imaging (fMRI). It is a most important step in the right direction. As this research advances to more fine-grained analyses of individual differences, it will become increasingly necessary to use simpler but more precise tests of some particular cognitive behavior in order to discover the brain processes involved . This is where chronometry is best suited to make its contribution to brain–behavior research. Chronometry provides the closest noninvasive interface between brain and behavior. Neither the brain nor the behavior can be properly studied in isolation from each other. The common coin for the measurement of both brain activity and overt behavior is real time itself, ergo the importance of mental chronometry for research aimed at understanding the brain–behavior relationship. In a few years perhaps enough research of this kind will have been published to warrant a full-scale review, possibly another book.
A bit of a mouth-full, but chronometry at least offers us data that is truly ratio scale because we measure time. The problem here, though, is that zero time corresponds to maximum intelligence, not zero intelligence! It’s an inverted scale of measurement. If a brain can process incoming information at infinite speed, it can respond with no delay, thus giving a reaction time of 0. A very slow brain would take roughly forever to process information — like an old computer trying to load a modern game — and it would never finish.
How far can we get with chronometry with regards to measuring intelligence? Quite far actually. The basic apparatus might look something like this:
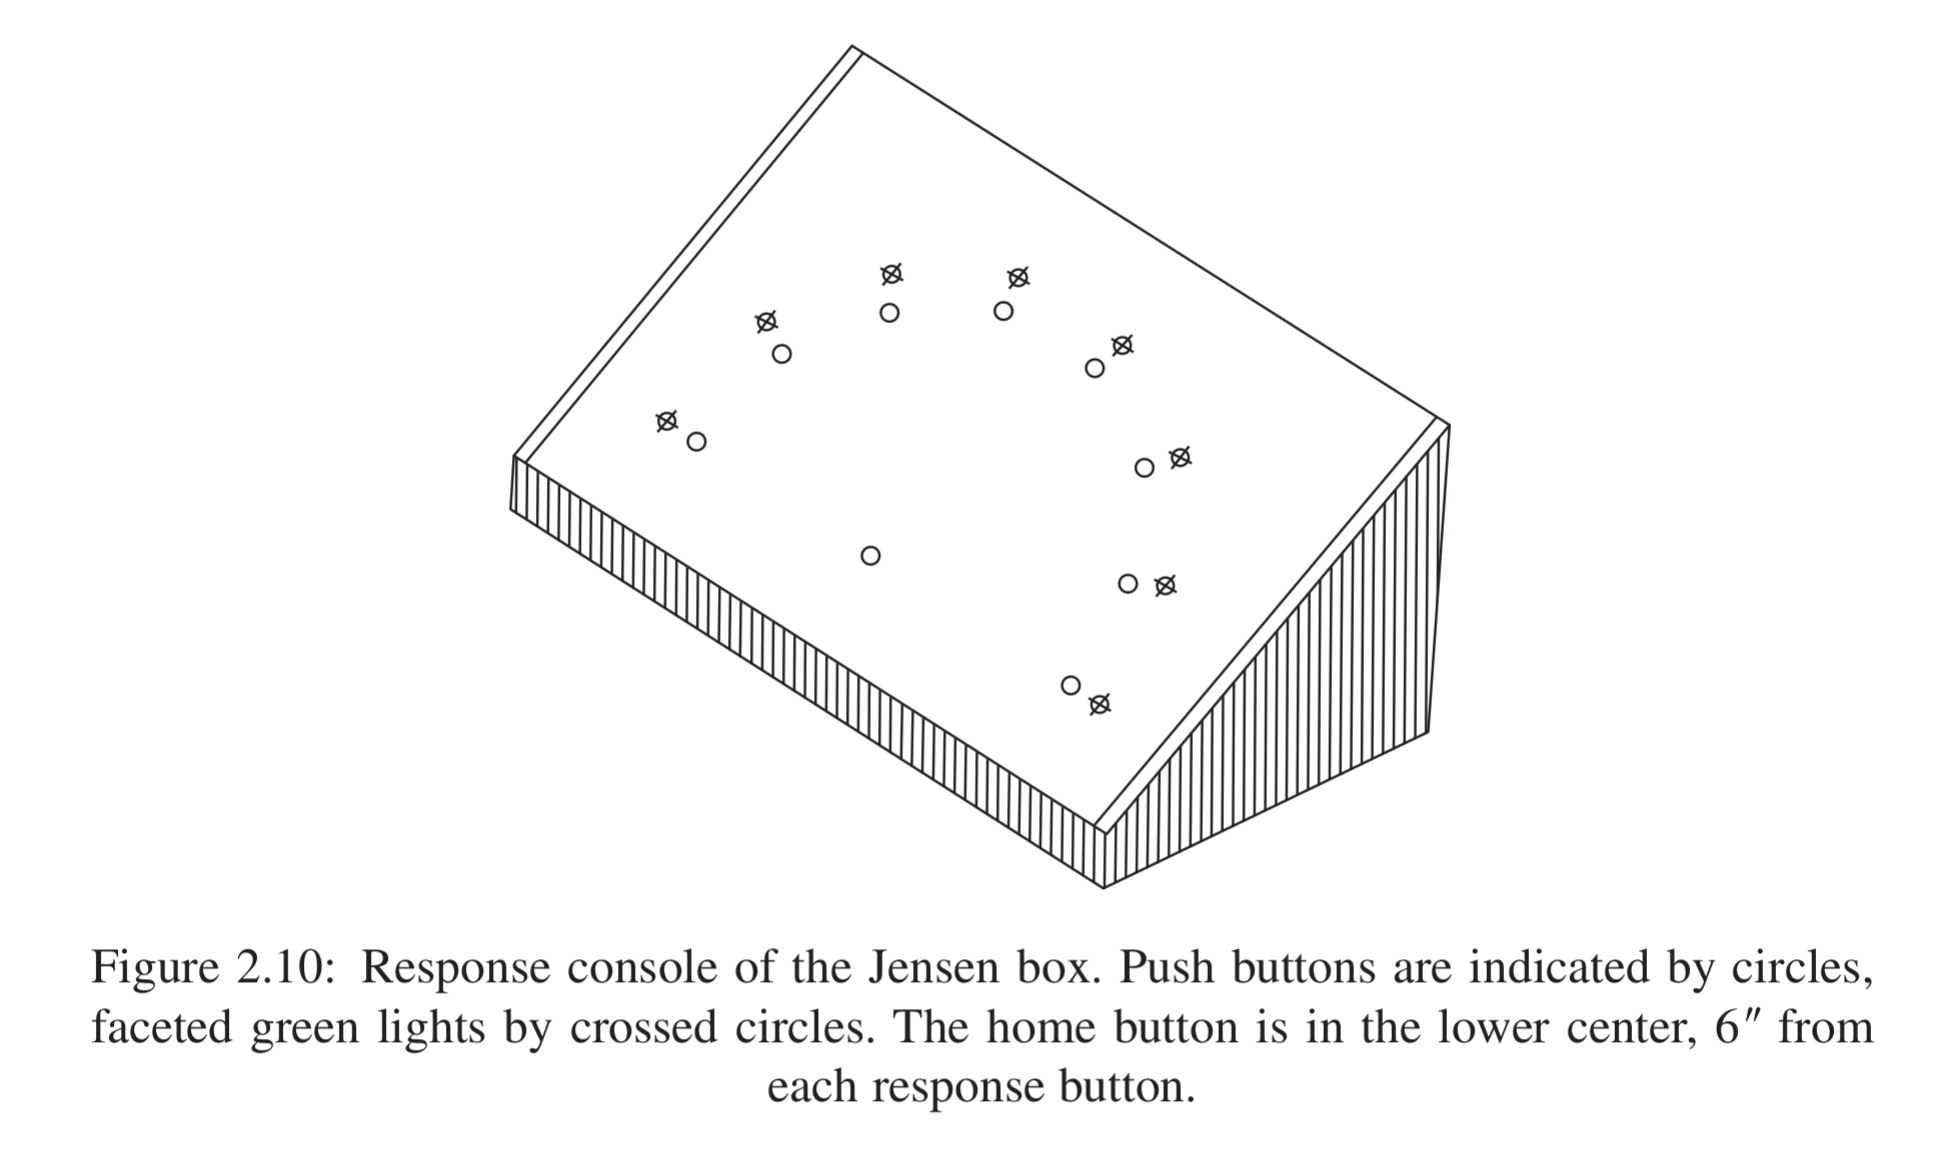
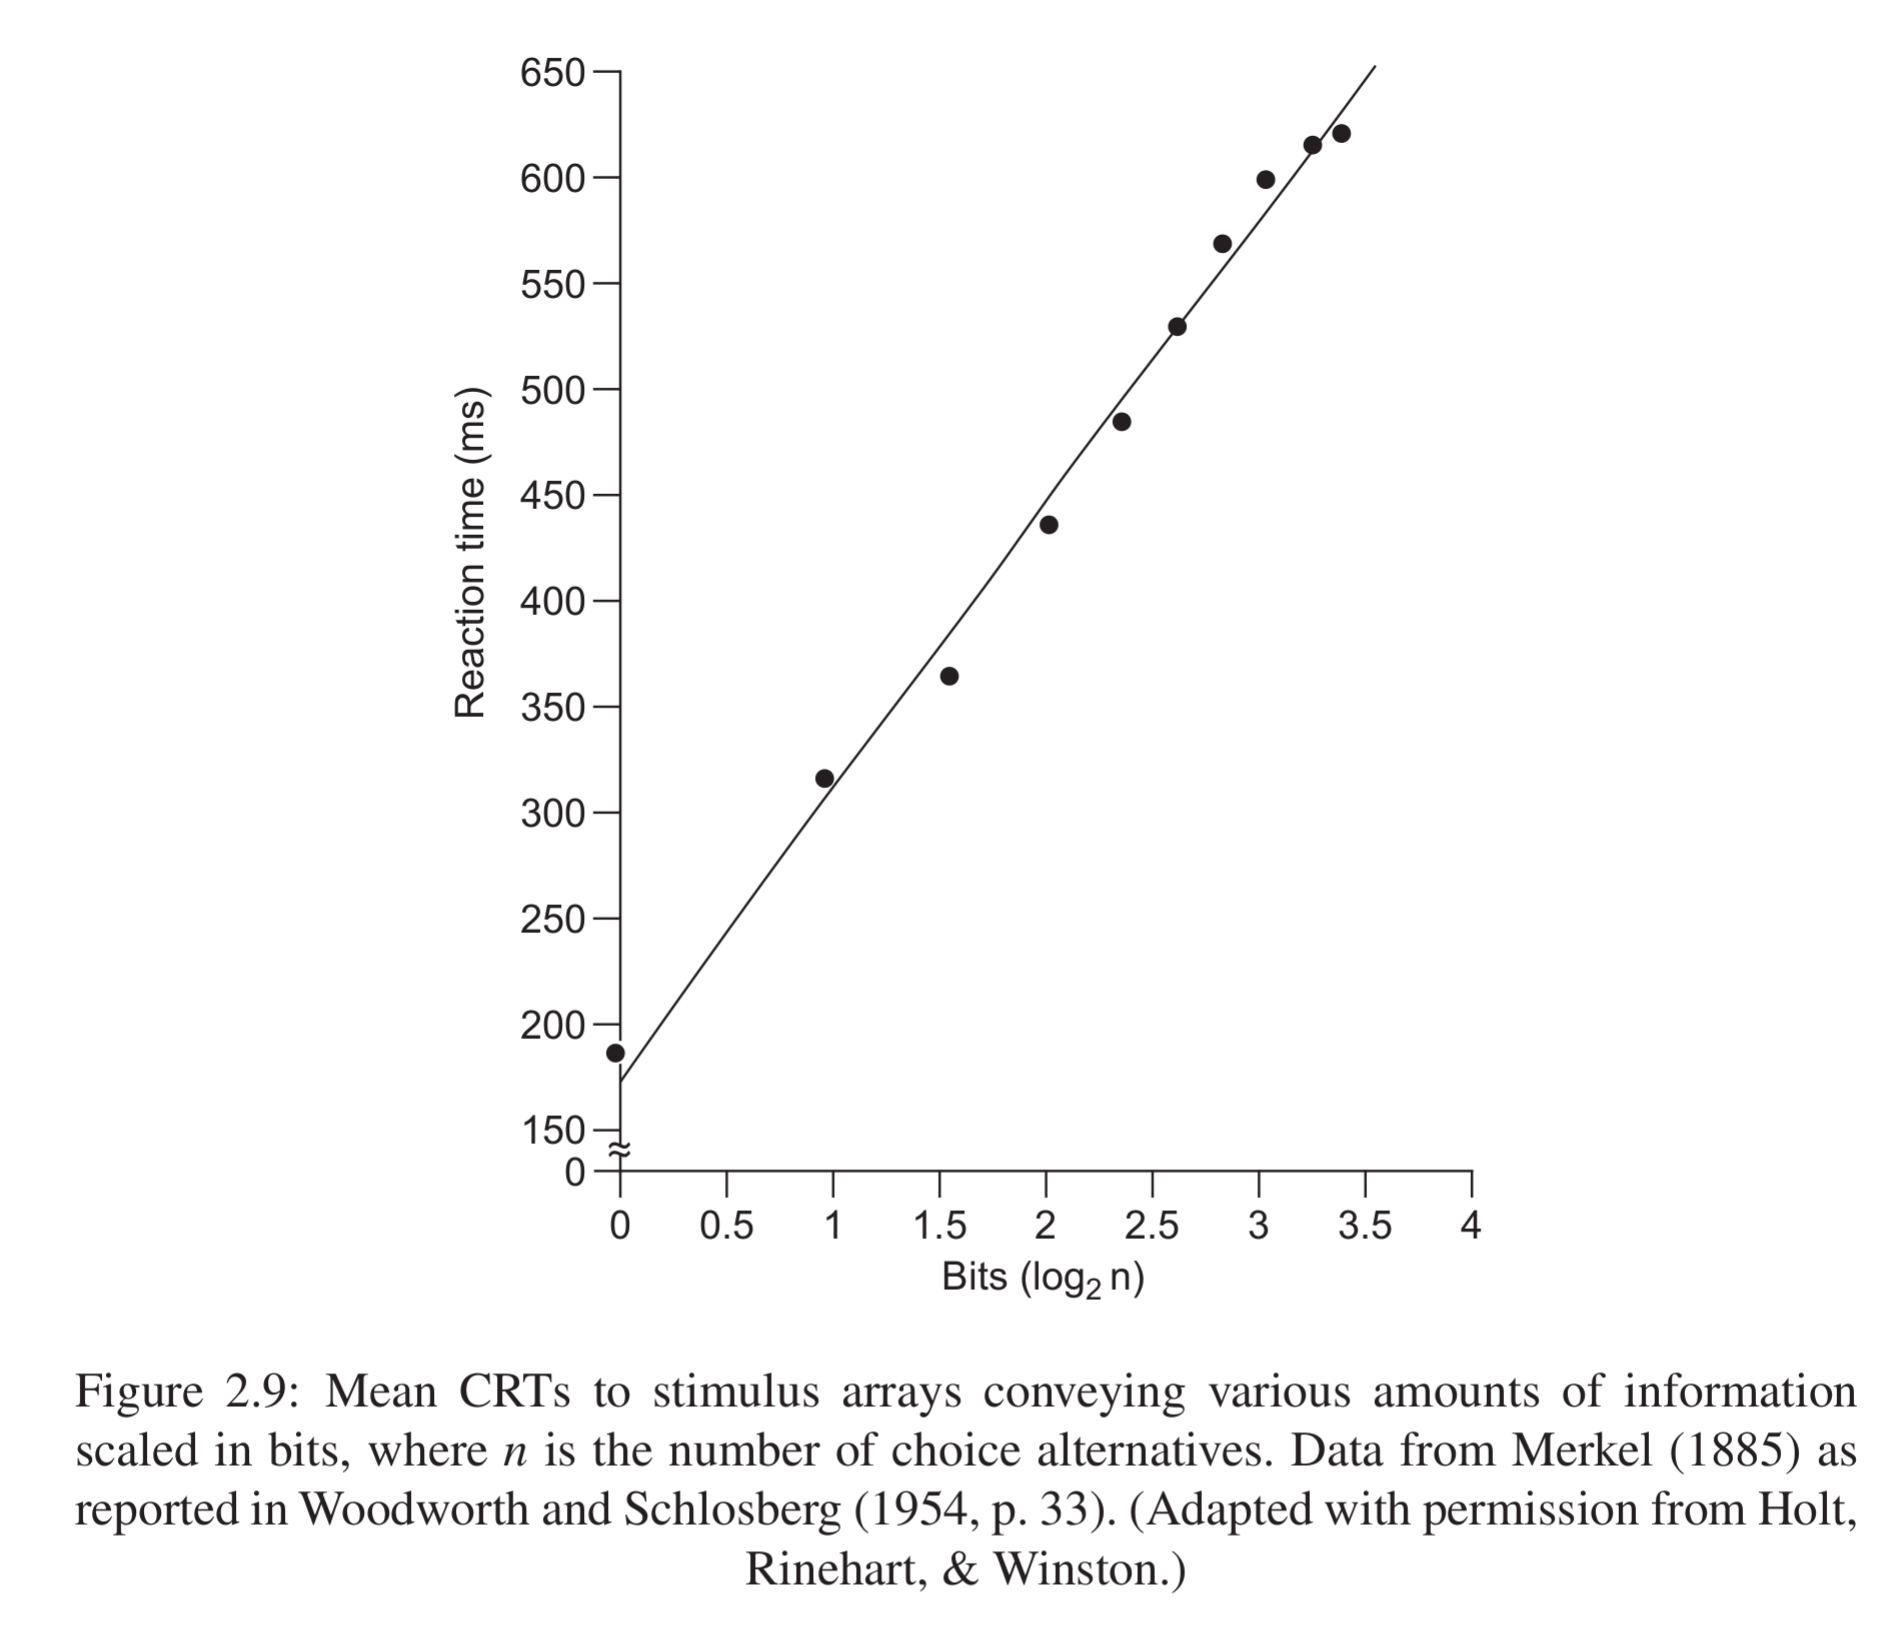
This is the 8-button variant of the Jensen box. You hold your finger at the middle button (the start or home button). At some point, a light is shown for one of the smaller buttons and you press it as fast as you can. The measurement can be varied by how many buttons you need to choose between. It turns out that this is quite important. The more buttons and lights to keep track of, the slower the reaction time.
It might seem very simple and possibly not very important to measure, but it turns out that this works well as an intelligence test when you combine a few variants of this task.
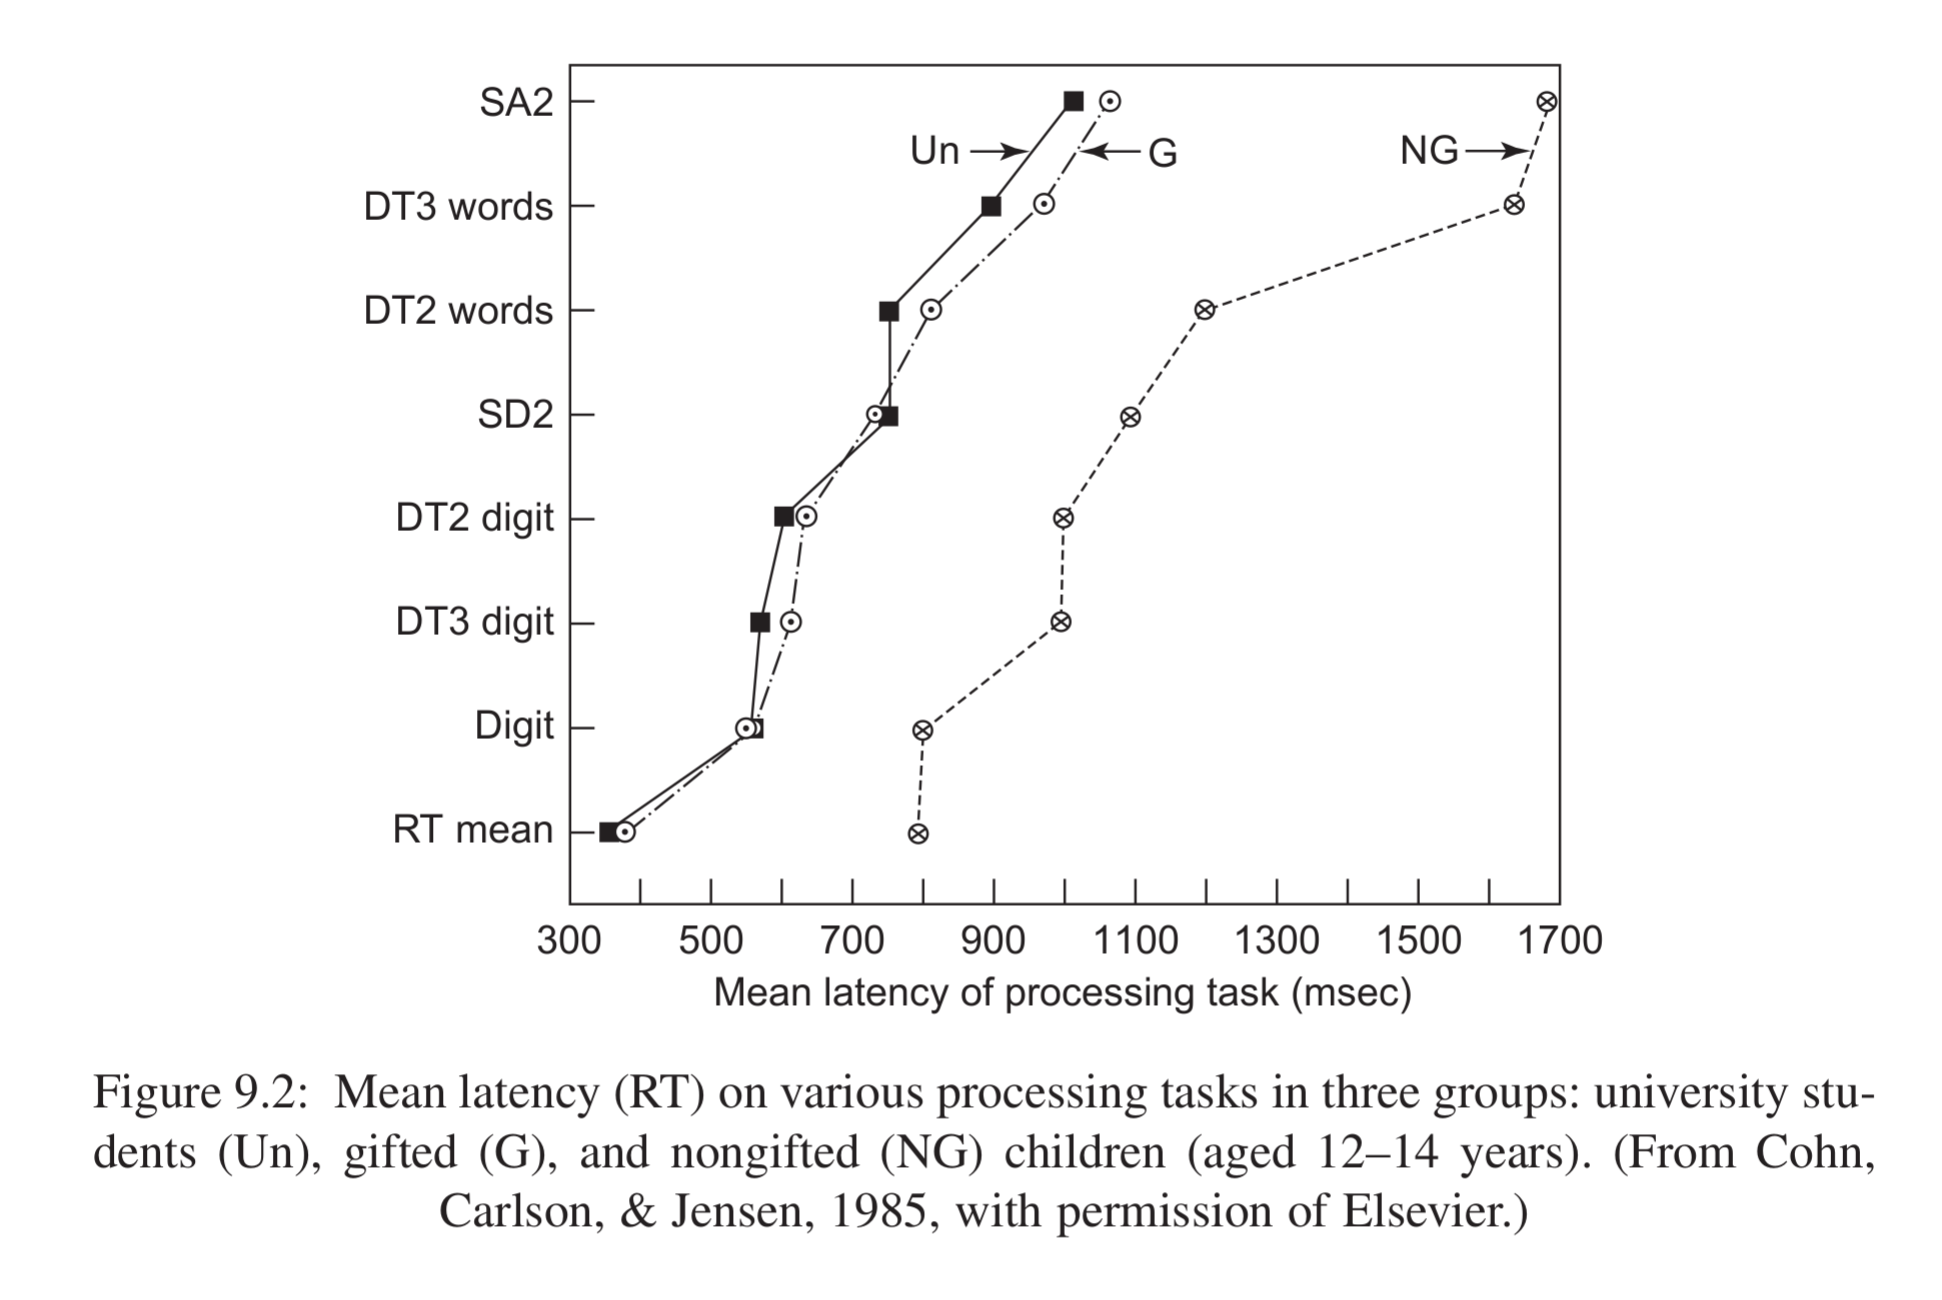
In this study, 8 variants of reaction time were measured, and three groups compared: 1) university students, 2) gifted children, and 3) average children (ages 12-14). It can be seen that the gifted children perform about as well on reaction time as the university students. Perhaps in some sense, then, they are about equally smart despite the age difference.
If one combines a bunch of different reaction time measures, together they can predict grades just about as well as a standard battery of intelligence tests. Here’s a complicated looking model from Lou et al 2003:
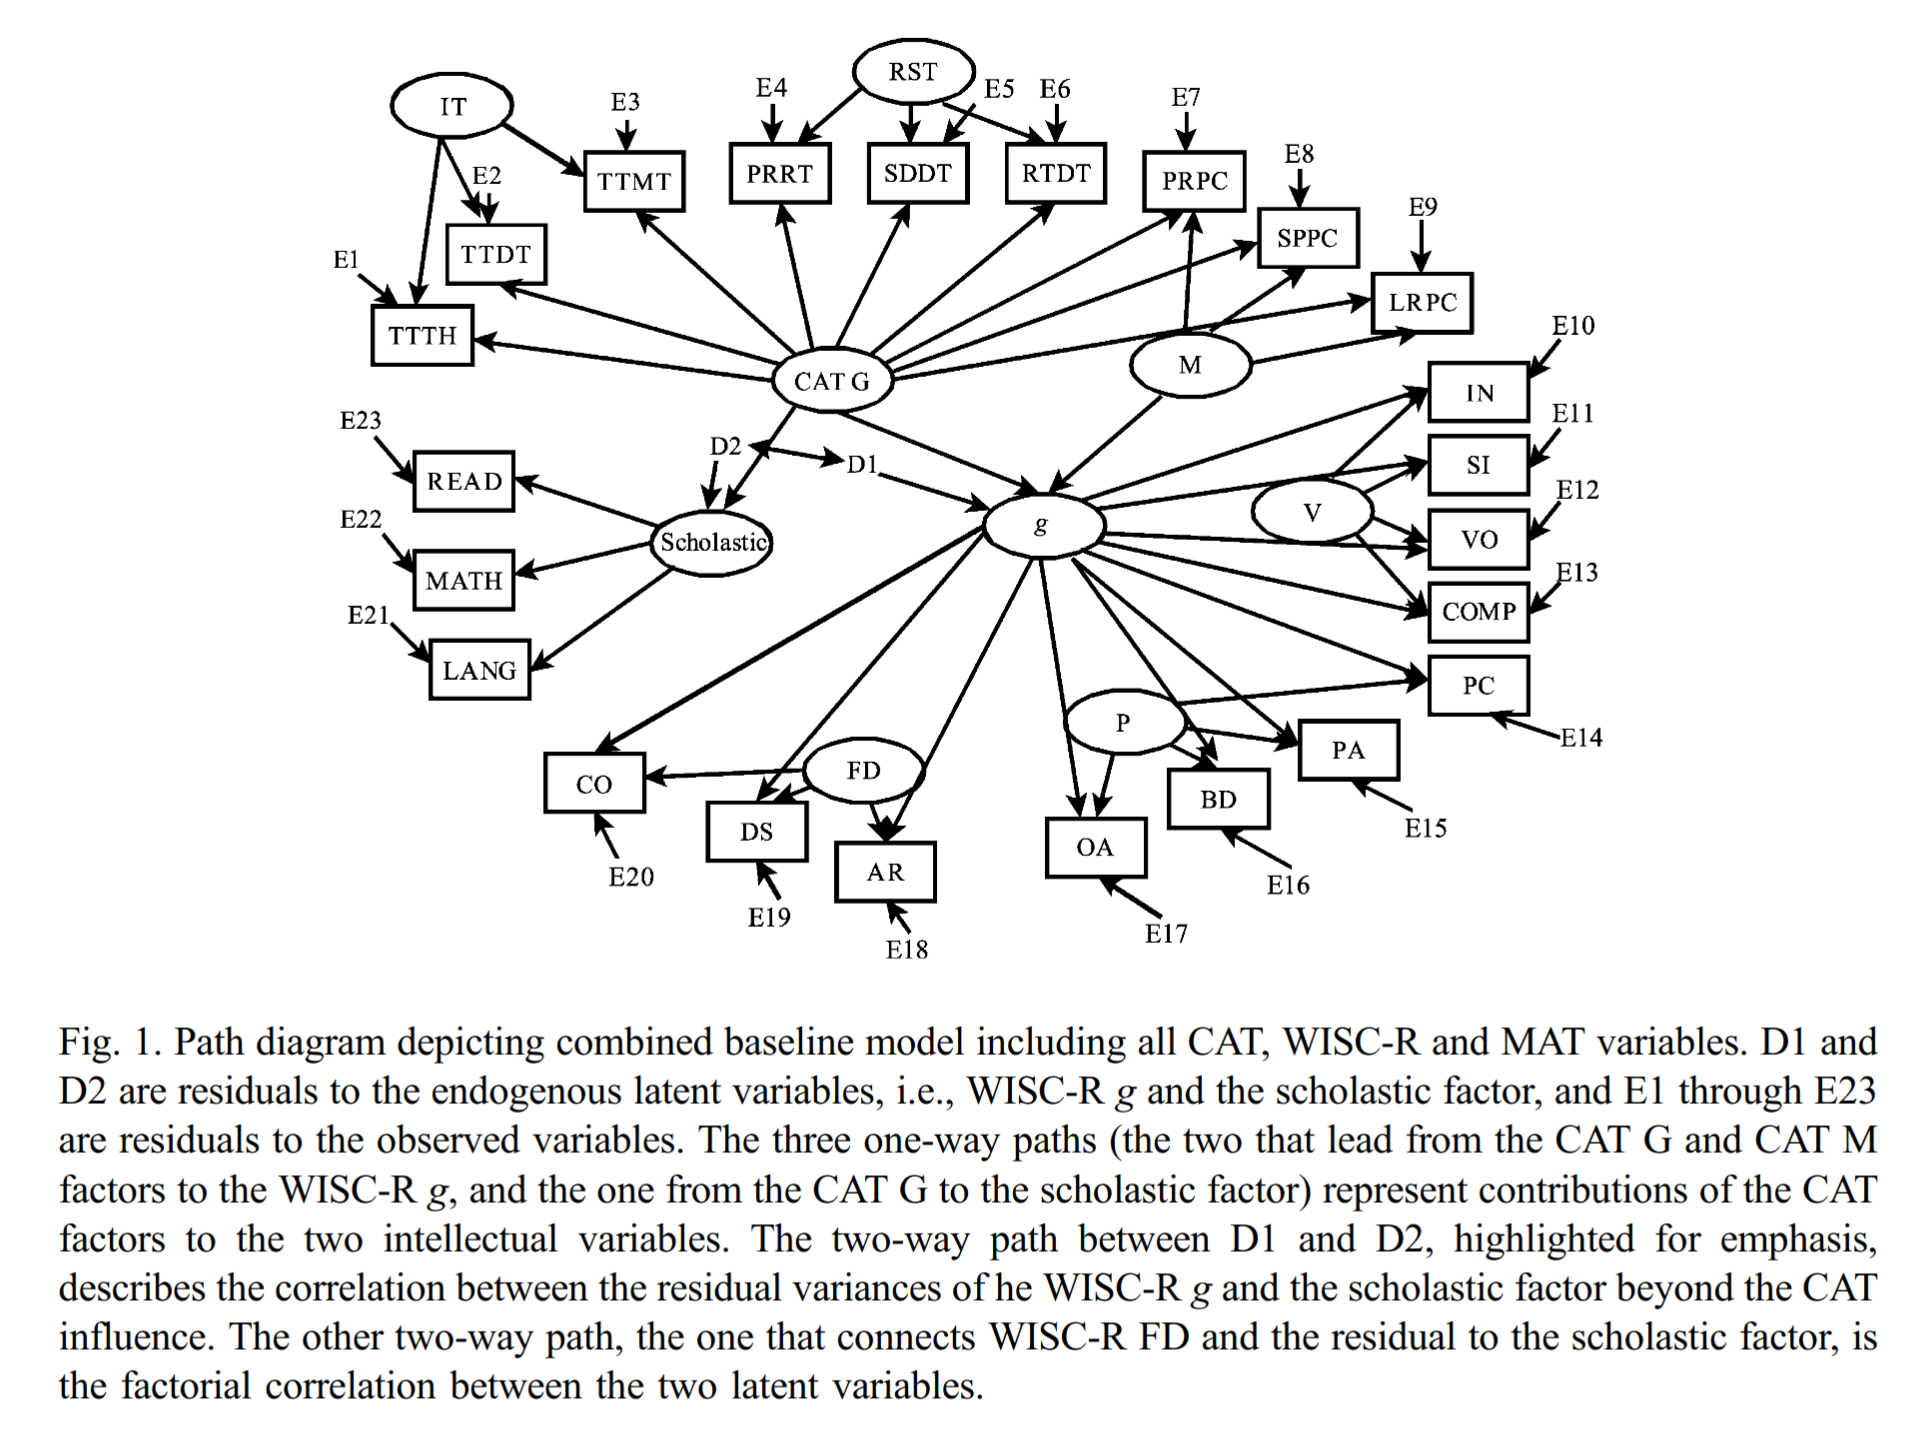
They studied “532 primary school children”, who were given the full WISC (Wechsler test for children, 11 test battery, as well as some reaction-time type tests (these are generally called ECTs = elementary cognitive tests, in this case, from a battery called CAT). Thus, one can define a g factor from the reaction time tests (CAT G) and one from the regular psychometric WISC tests (g), and see how well they correlate:
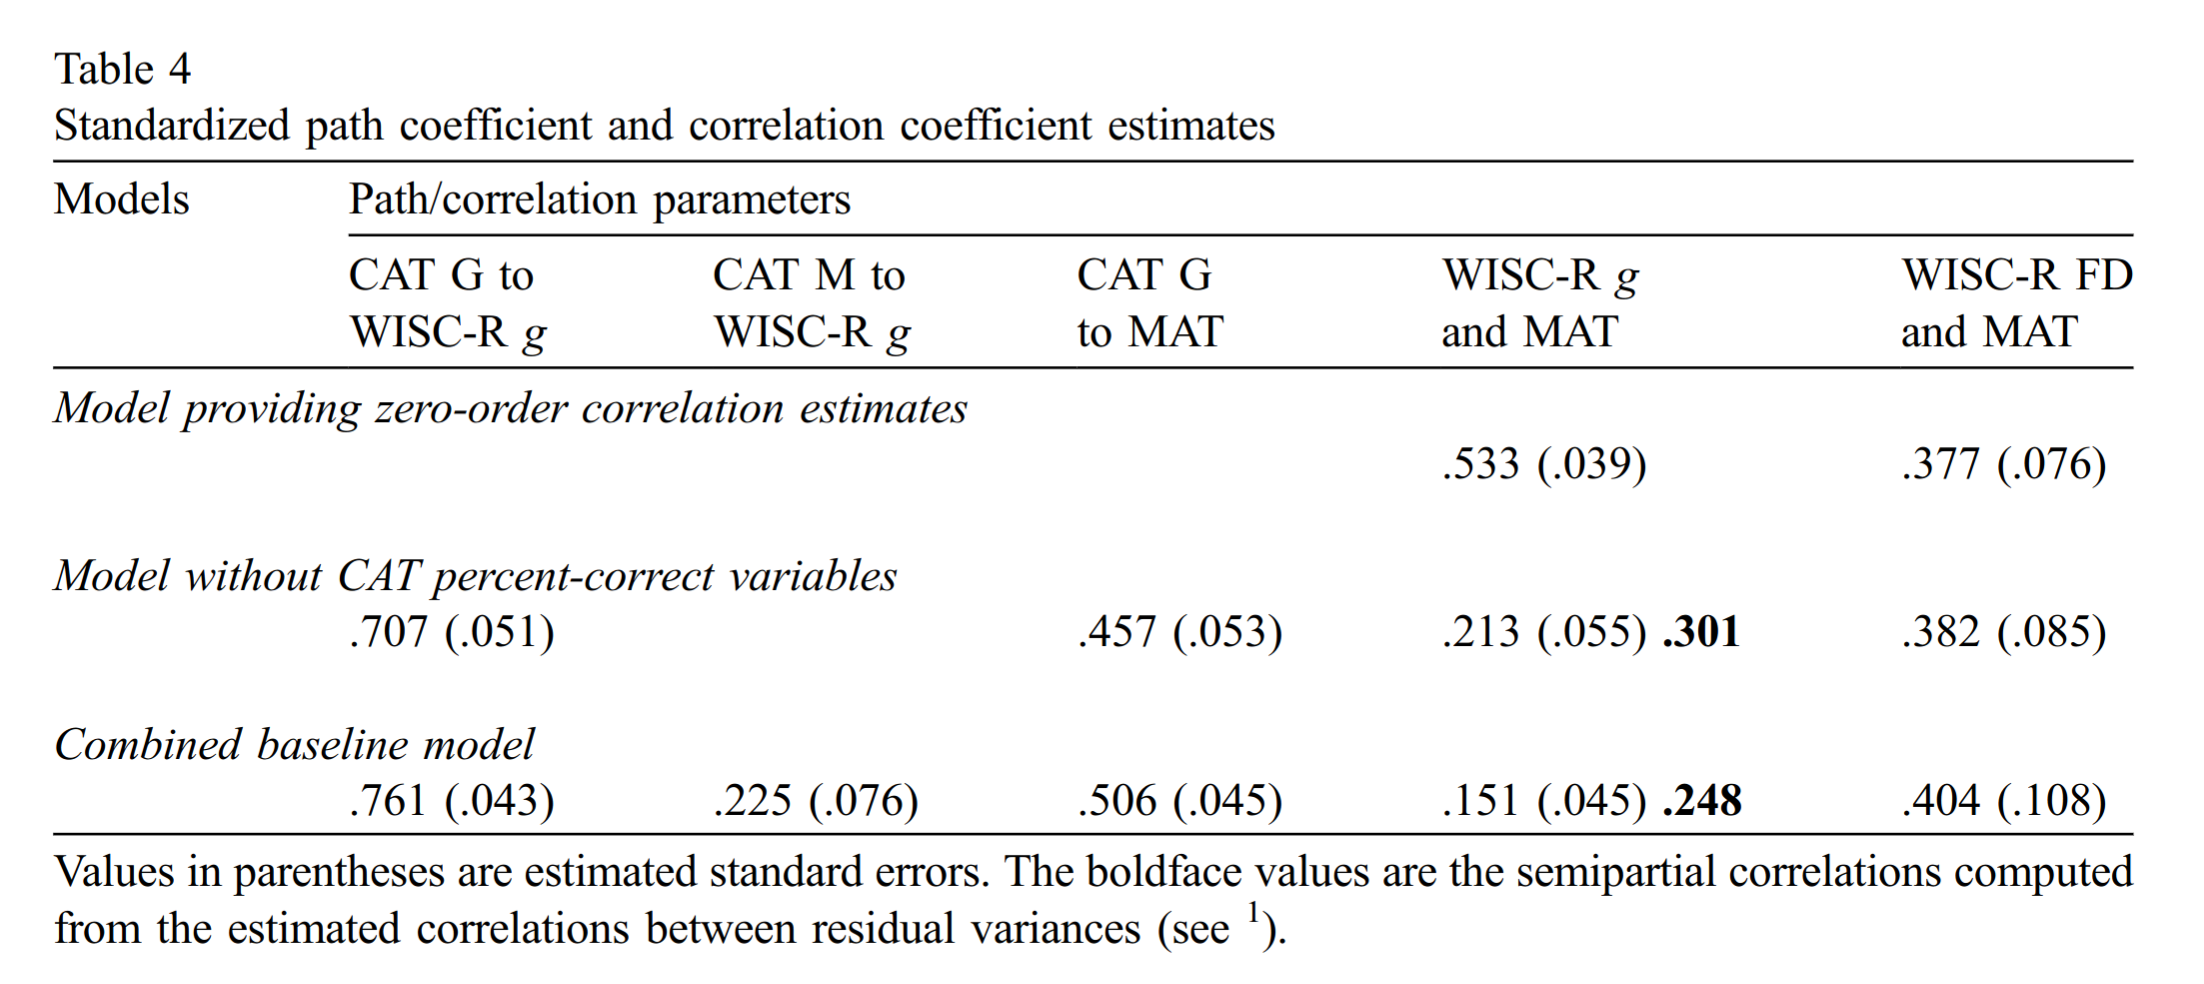
The answer is .761. Not bad at all. Thus, if one had used a more variants of reaction time tests, probably one could get a higher value in the 0.8 to 0.9 range. Near-unity between traditionally measured g and g from reaction time-like tests. Indifference of the indicator.
But how do we really get a mathematical theory though?
The reaction time data shows that one can get ratio scale data for intelligence in some sense or another, and that this can be used to measure intelligence almost as well as with traditional testing. But still, a g score from a bunch of reaction time tests is not a ratio scale measurement of intelligence either. The factor analysis or structural equation modeling transforms the data to z-scores internally, so it degrades the data in the way that Jensen was talking about (from ratio to interval). If there was a working, mathematical theory of intelligence, one would instead plug the numbers into some kind of equation or model that would provide an estimate of intelligence on a scale that would be the same for humans of any age, dogs, cats, or fish. No one has the slightest idea of how to construct such a mathematical model.
This is not criticism that is specific to intelligence research. I am not aware of personality psychologists even discussing this issue at all. Whoever heard of a mathematical theory of extroversion? If extroversion is a stable trait that one can think of differing between people, and between pets, or rats, then it must be quantifiable on a ratio scale, in theory at least. The best we can say is that this must relate to some property of the brain neural network. Eysenck tried to get at some of these things with his personality constructs. He was too early for the neuroscience revolution in data access and died without making any serious progress. Still, taking the usual psychological theorizing, we might say that extroversion must be related in some sense, to properties of a neural network that make it seek out external stimuli. Intelligence, on the other hand, will be related to whatever properties of the neural network that make it faster and more capable of processing complicated information. But stating things like this is merely restating our usual verbal definitions of intelligence with “in the neural network” added-in. True, but not exactly helpful, except telling us where to look.
The fact that we don’t have a ratio scale measurement of intelligence is why we get all the Flynn effect problems. As Flynn noted, as quoted above, Raven’s tests work as a measure of the output of intelligence. We find that under certain conditions, this works fairly well to measure the differences in intelligence of people born the same time. It doesn’t work to measure differences across cohorts. It is as if we had a thermometer, but every 10 years, manufacturers had to subtract an arbitrary value on the reading to keep them consistent because of some cosmic force that changes the way the shown value relates to real temperature. That’s how tests like Raven’s work. The various tests we have of intelligence show different cohort changes, and why that is the case is a big mystery. Here’s data from children’s testing (WISC) by Flynn & Weiss 2007:
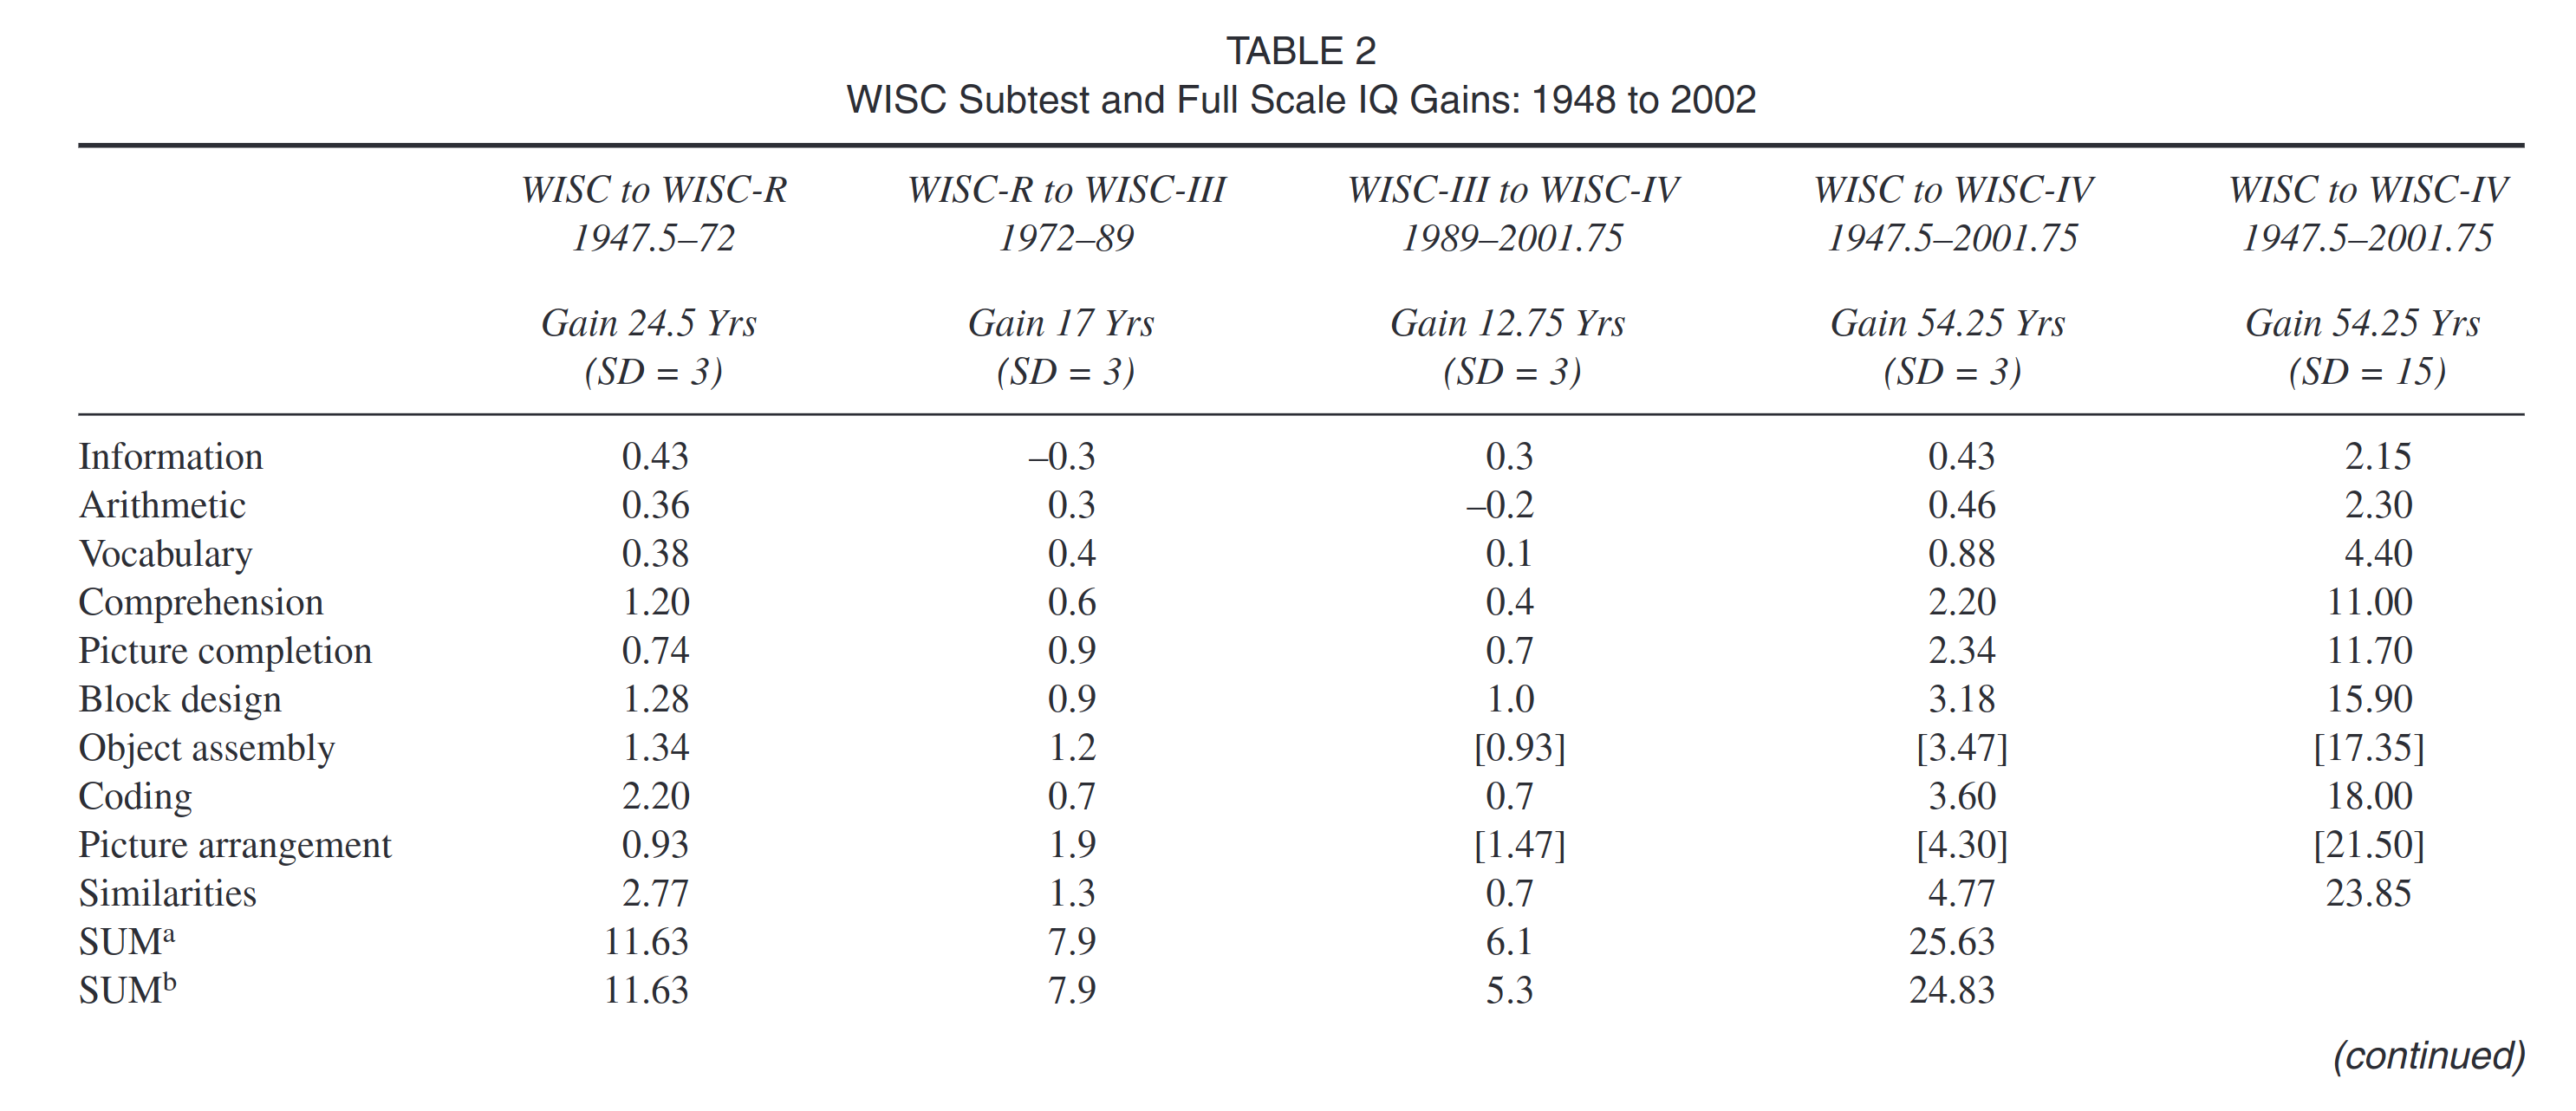
The numbers in brackets can be ignored, as these are estimates of gains, not measured gains. The tests weren’t given at every version of WISC, so there isn’t data to compute them with. Those aside, we see that there are some stark differences. Similarities gained about 24 IQ points over 54 years, but Information (general knowledge) and arithmetic gained only 2 IQ! How can these tests measure the same thing? We know they measure the same thing fairly well within a cohort of same aged people, but we also know that they don’t measure the same thing between cohorts or age groups. Raven’s test also shows huge gains, similar to the Similarities test, but Raven’s test doesn’t appear to have much in common with Similarities. Raven’s is a non-verbal test involving figures and abstract patterns, whereas Similarities is explicitly verbal and about grouping or finding a relationship between two things. Why the connection? Arithmetic is about applying basic rules of math to solve problems, and somehow these didn’t increase despite a huge increase in the time children are taught basic math. Any kind of school-based explanation will fail because neither Arithmetic nor Vocabulary increased much and these are explicitly the target of schooling. The mysteries of the Flynn effect show us why it is we need a proper mathematical theory of intelligence to dissolve these apparent paradoxes.
Stranger yet, while all the tests in the WISC battery increase, at least a little bit, over time. The simple reaction time test shows a decline:
The Victorian era was marked by an explosion of innovation and genius, per capita rates of which appear to have declined subsequently. The presence of dysgenic fertility for IQ amongst Western nations, starting in the 19th century, suggests that these trends might be related to declining IQ. This is because high-IQ people are more productive and more creative. We tested the hypothesis that the Victorians were cleverer than modern populations, using high-quality instruments, namely measures of simple visual reaction time in a meta-analytic study. Simple reaction time measures correlate substantially with measures of general intelligence (g) and are considered elementary measures of cognition. In this study we used the data on the secular slowing of simple reaction time described in a meta-analysis of 14 age-matched studies from Western countries conducted between 1889 and 2004 to estimate the decline in g that may have resulted from the presence of dysgenic fertility. Using psychometric meta-analysis we computed the true correlation between simple reaction time and g, yielding a decline of − 1.16 IQ points per decade or − 13.35 IQ points since Victorian times. These findings strongly indicate that with respect to g the Victorians were substantially cleverer than modern Western populations. [Woodley et al 2013]
There are indications that simple reaction time might have slowed in Western populations, based on both cohort- and multi-study comparisons. A possible limitation of the latter method in particular is measurement error stemming from methods variance, which results from the fact that instruments and experimental conditions change over time and between studies. We therefore set out to measure the simple auditory reaction time (SRT) of 7,081 individuals (2,997 males and 4,084 females) born in Sweden 1959–1985 (subjects were aged between 27 and 54 years at time of measurement). Depending on age cut-offs and adjustment for aging related slowing of SRT, the data indicate that SRT has increased by between 3 and 16 ms in the 27 birth years covered in the present sample. This slowing is unlikely to be explained by attrition, which was evaluated by comparing the general intelligence × birth-year interactions and standard deviations for both male participants and dropouts, utilizing military conscript cognitive ability data. The present result is consistent with previous studies employing alternative methods, and may indicate the operation of several synergistic factors, such as recent micro-evolutionary trends favoring lower g in Sweden and the effects of industrially produced neurotoxic substances on peripheral nerve conduction velocity. [Madison et al 2016]
Imagine you were trying to measure the height of men in population across different cohorts. But instead of using a ruler, I only gave you measurements of shadows of various body parts, without telling you which distance I am measuring them from, or which angle, or even time of time. When you looked at data across the cohorts, some shadows would become longer, some much more so than others, and a few become shorter. Are people getting taller? Maybe people are changing their posture over time? Are the shadows measured at the same time of day for cohort 1 and 2? This is akin to what we are doing for intelligence, as we lack any direct measures. It would appear the only way to get to the bottom of the Flynn effect mystery is to do more neuroscience to come up with a better theory of intelligence. Unfortunately, since we lack detailed neuroscientific measures (MRI, EEG etc.) of most previous cohorts, whatever theory we might come up with may be inapplicable to most of the past. There is no way to obtain high-grade neuroscientific data for people born in 1850. For those questions, we will probably be forced to rely on polygenic scores as a measure of the genetics side of things.
Summary & conclusions
- Almost all psychology scales do not have any true zeros. Scales without true zeros cannot be used for calculations involving multiplication, and thus percentages.
- Most work done on ratio scales in intelligence measurement, and there are some ideas regarding elementary cognitive tests using reaction times, but there is no proposed mathematical theory of intelligence.
- In my view, any mathematical theory of intelligence must be some function of the brain’s neural network, which is inherently complicated. Maybe inventing a mathematical theory of intelligence is beyond human intelligence.
- The lack of a ratio scale of intelligence is why we have the various confusions and apparent paradoxes regarding cohort changes in scores. One can use advanced statistical methods to attack some of these (measurement theory/invariance testing), but these can only go so far.
- Other areas of psychology don’t seem to even think about the ratio scale issue. Intelligence research is the forerunner as usual.