Recently, I wrote about a great study showing the intelligence and crude personality differences between 300+ jobs. There is now a replication of this using a set of 263 occupations in Estonia:
- Wolfram, T. (2023). (Not just) Intelligence stratifies the occupational hierarchy: Ranking 360 professions by IQ and non-cognitive traits. Intelligence, 98, 101755. (PDF)
- Anni, K., Vainik, U., & Mõttus, R. (2023). Personality Profiles of 263 Occupations.
While personality trait assessments are widely used in candidate selection, coaching and occupational counselling, little published research has systematically compared occupations in personality traits. Using a comprehensive personality assessment, we mapped 263 occupations in the self-reported Big Five domains and various personality nuances in a sample of 68,540 individuals, cross-validating the findings in informant-ratings of 19,989 individuals. Controlling for age and gender, occupations accounted for 2% to 7% of the variance in Big Five domains and up to 12% in nuances. Most occupations’ trait rankings were intuitive, aligned with informant ratings, and were consistent with rankings previously obtained with a minimalist personality assessment in a different sociocultural context. Occupations’ average trait profiles tended to cluster along the ISCO’s hierarchical framework, albeit with many (meaningful) exceptions. Finally, occupations with higher average levels of traits typically linked to better job performance tended to be more homogeneous in these traits, suggesting that jobs with higher-performing incumbents are often more selective for the traits. We provide an interactive application for exploring the results and discuss the findings’ theoretical and practical implications. https://apps.psych.ut.ee/JobProfiles/
In comparison with the prior study, the new one has no intelligence measures, but it has much nicer personality measures, including both self and other report. While this still isn’t quite perfect due to the reference group effect (people implicitly use people they know when rating people as a reference group), it is a nice improvement on self-report only which is 99% of personality research.
There are handy tables in the paper showing the highest and lowest scoring groups for each of the Big Five traits (OCEAN). Beginning with neuroticism:
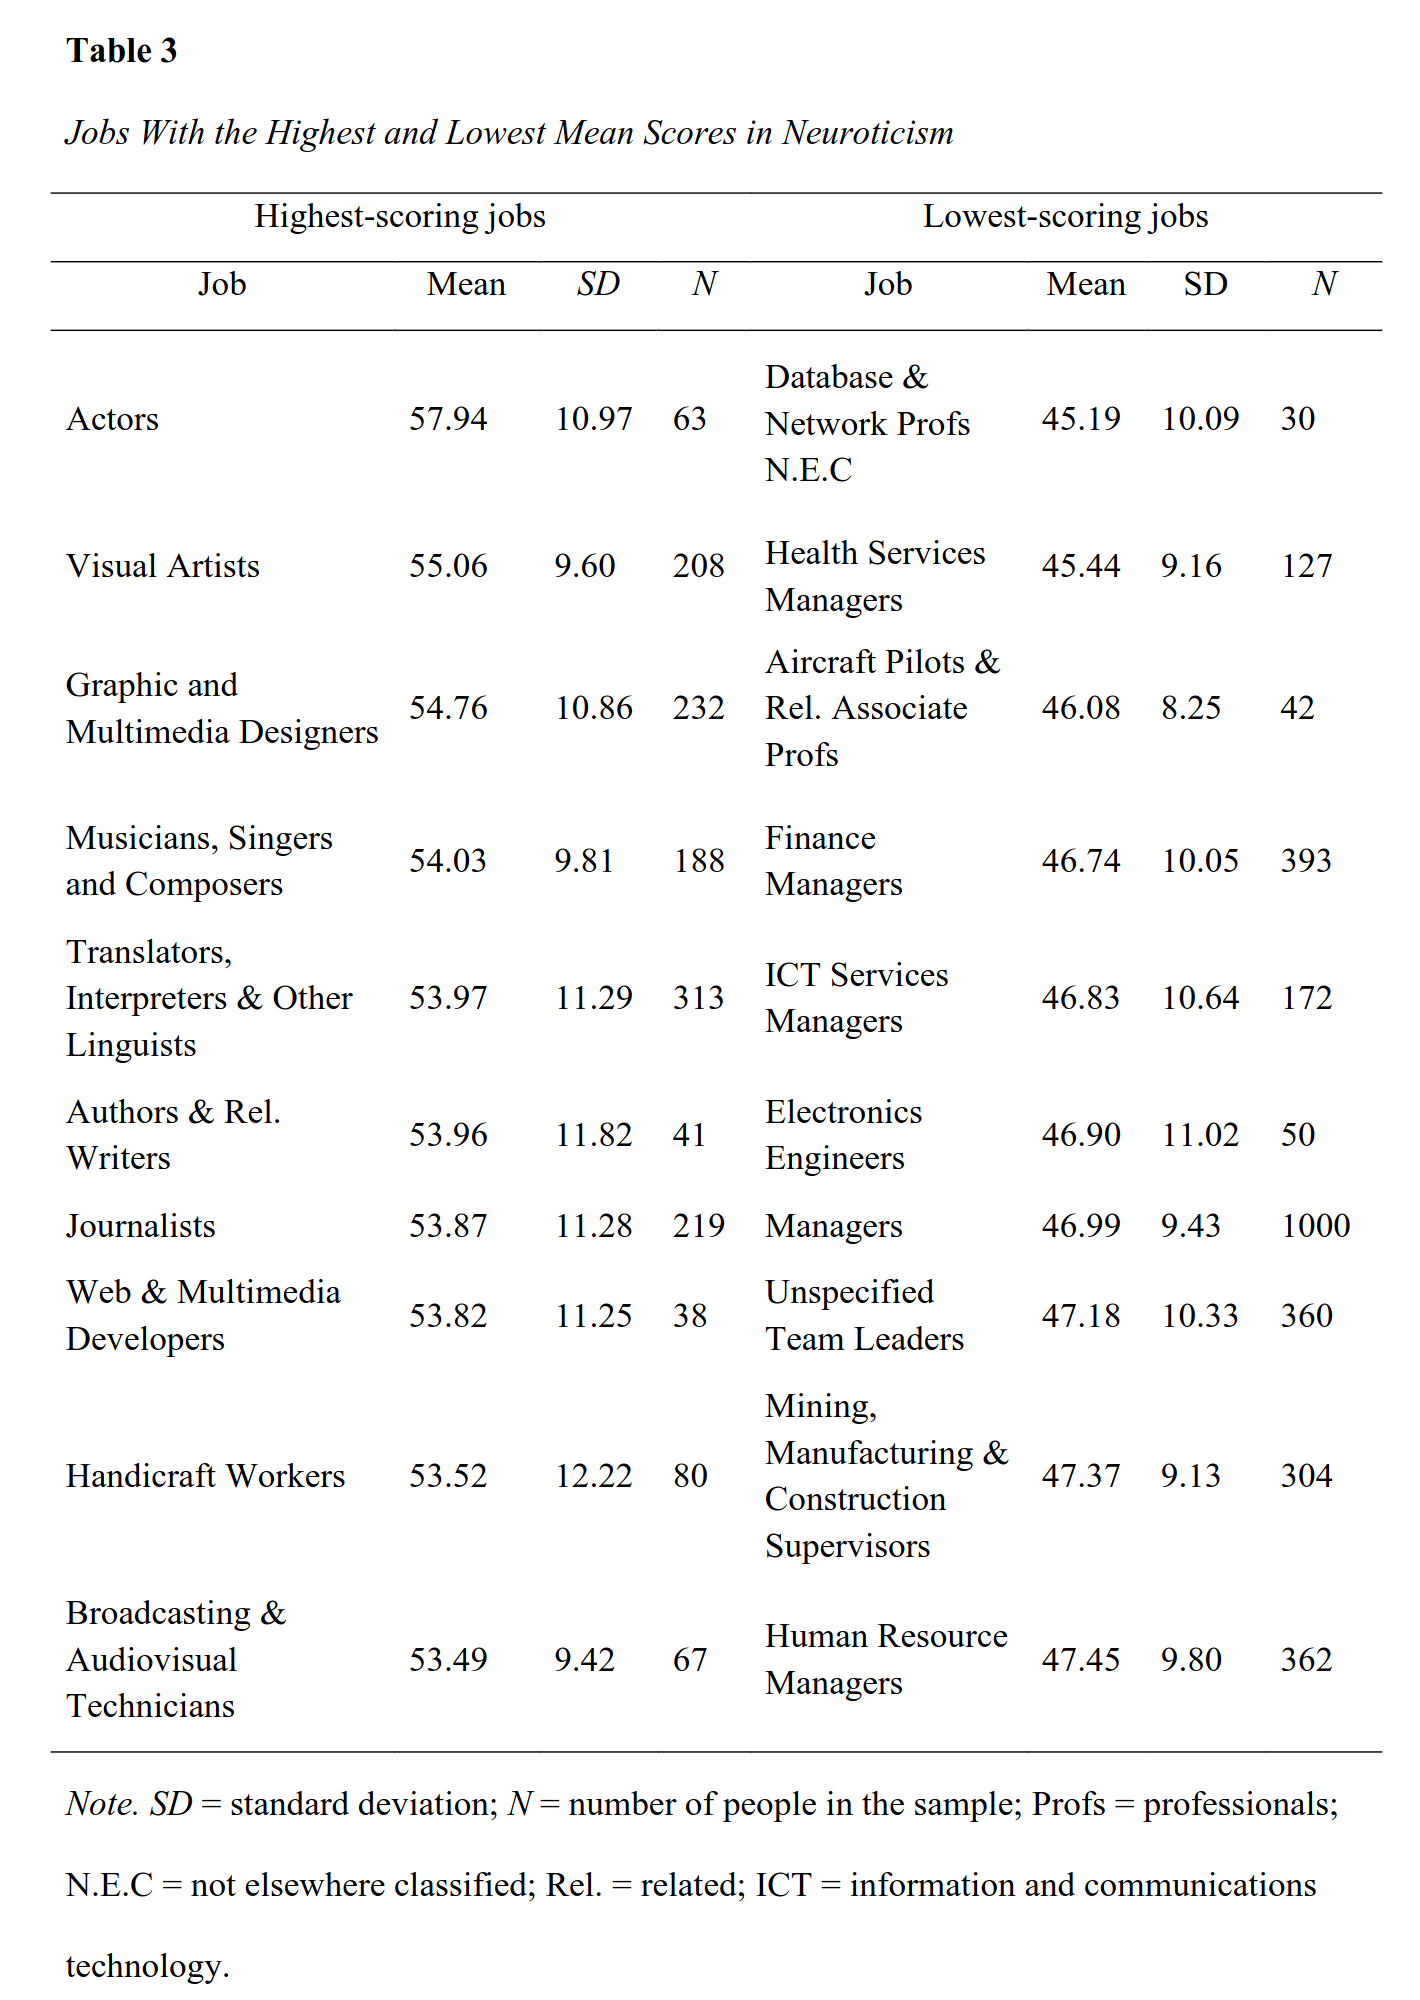
To understand the values, you have to read a part of the methods section explaining T scores:
We residualised personality traits (domains, items) for age and gender for further analyses and converted them to T-scores (M = 50, SD = 10), although we also report estimates for unresidualised traits for reference. [I don’t see this set reported anywhere in full.]
In other words, 10 corresponds to 1 standard deviation. So when we see that actors have a mean of 58, really they are 0.8 d above the mean. This difference is quite large! This is about the same size as Ashkenazis have in intelligence above non-Jewish northwest Europeans (e.g. 112 IQ = +0.8 d). And this is controlling for age and sex, which, as they noted, made the differences smaller. The reason for this is that occupations with more women in them are more neurotic since women are more neurotic than men, and so on for the other personality traits and nuances (items or near-item level traits).
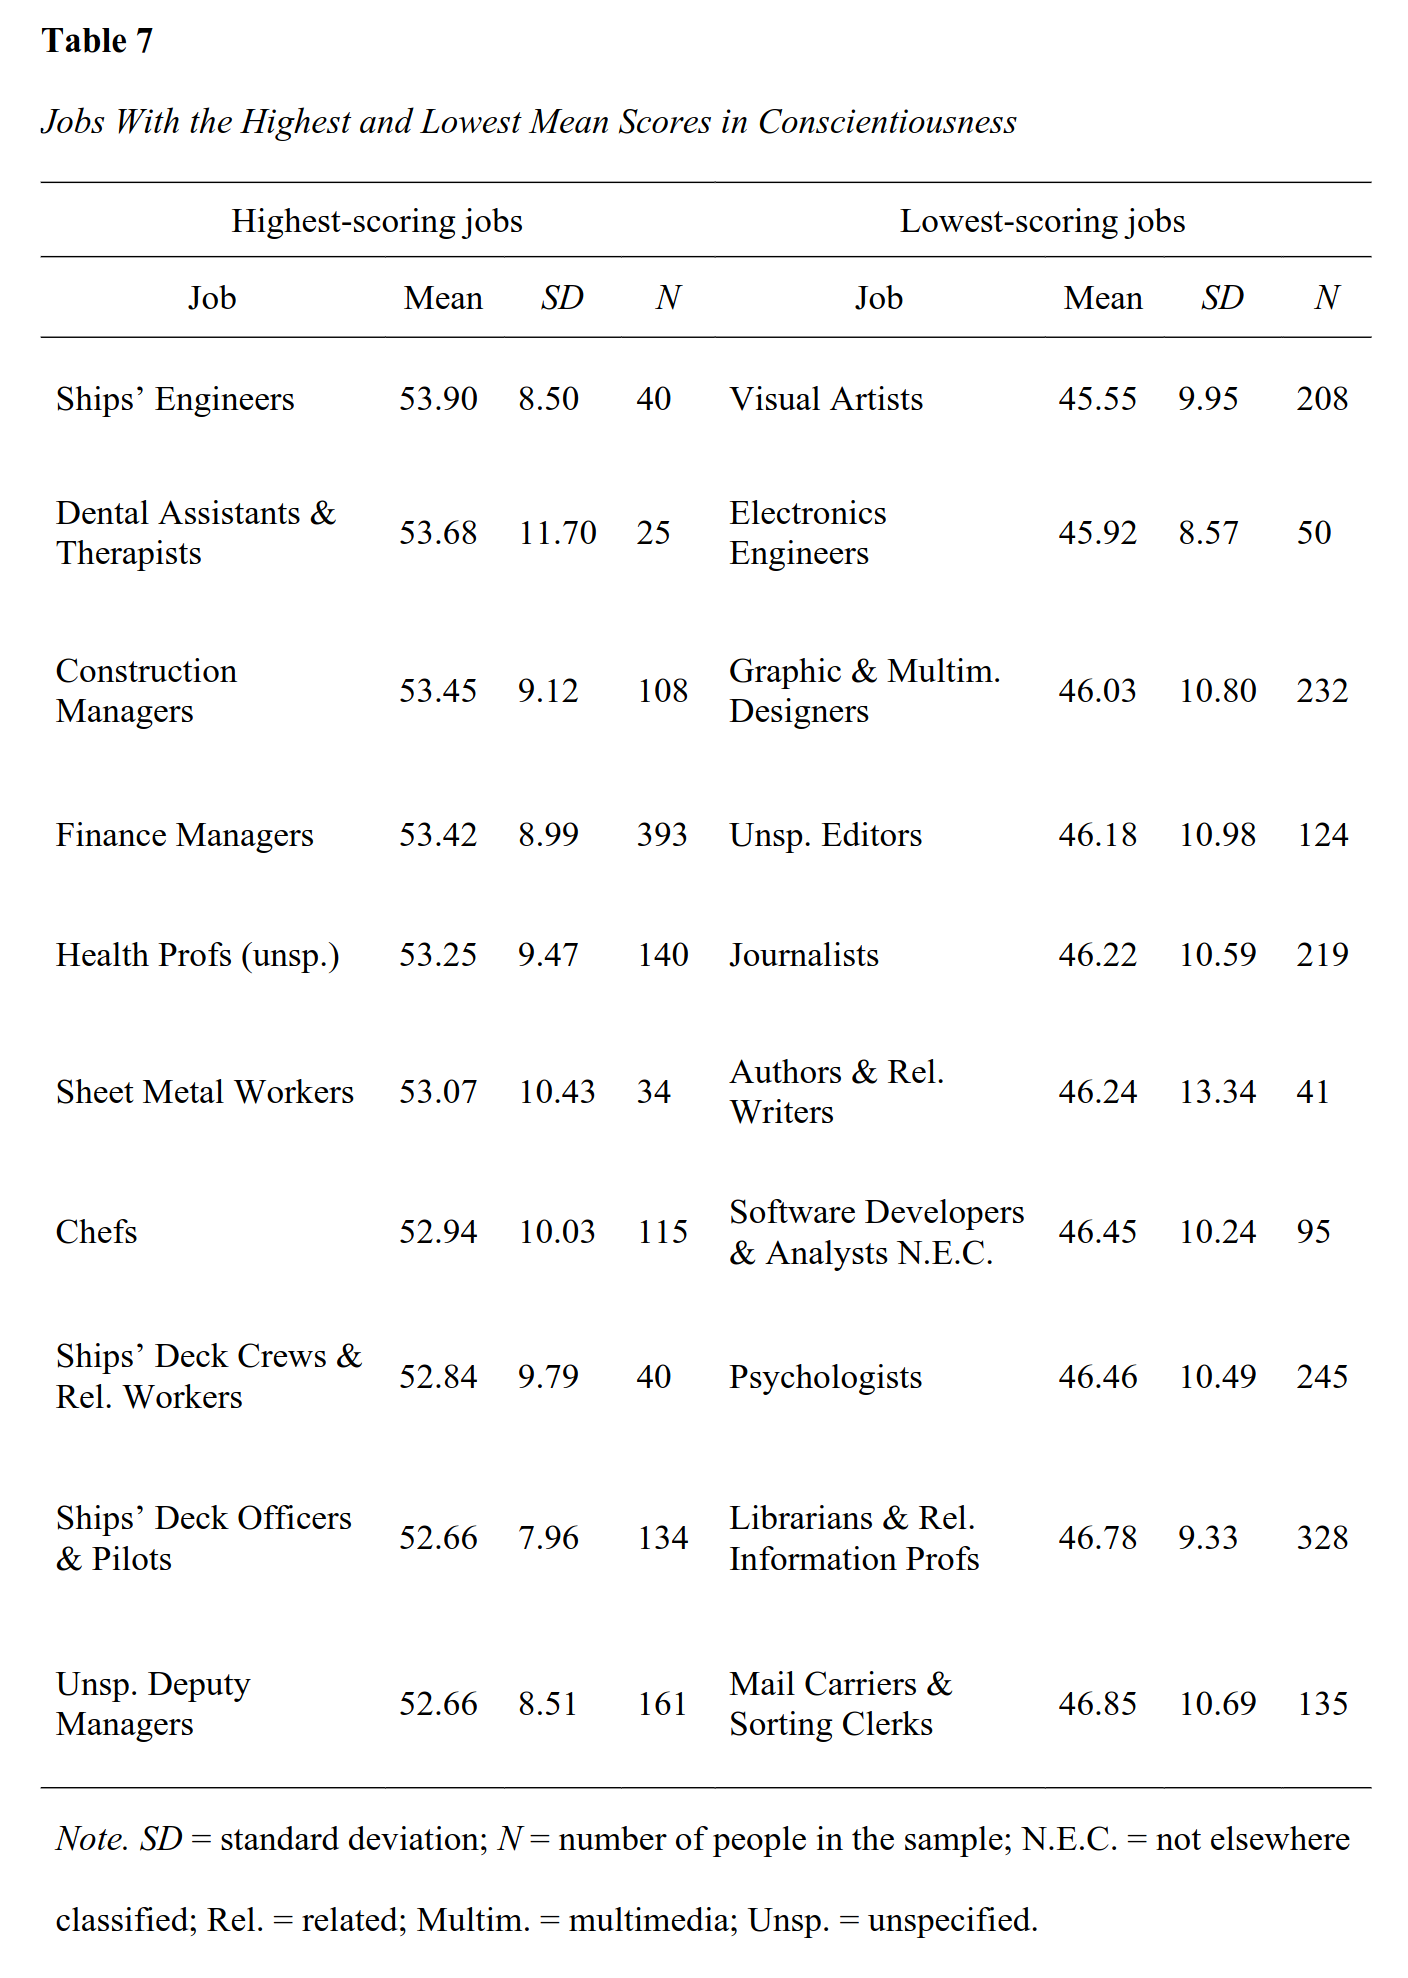
Here’s the top and bottom scores for conscientiousness:
And agreeableness:
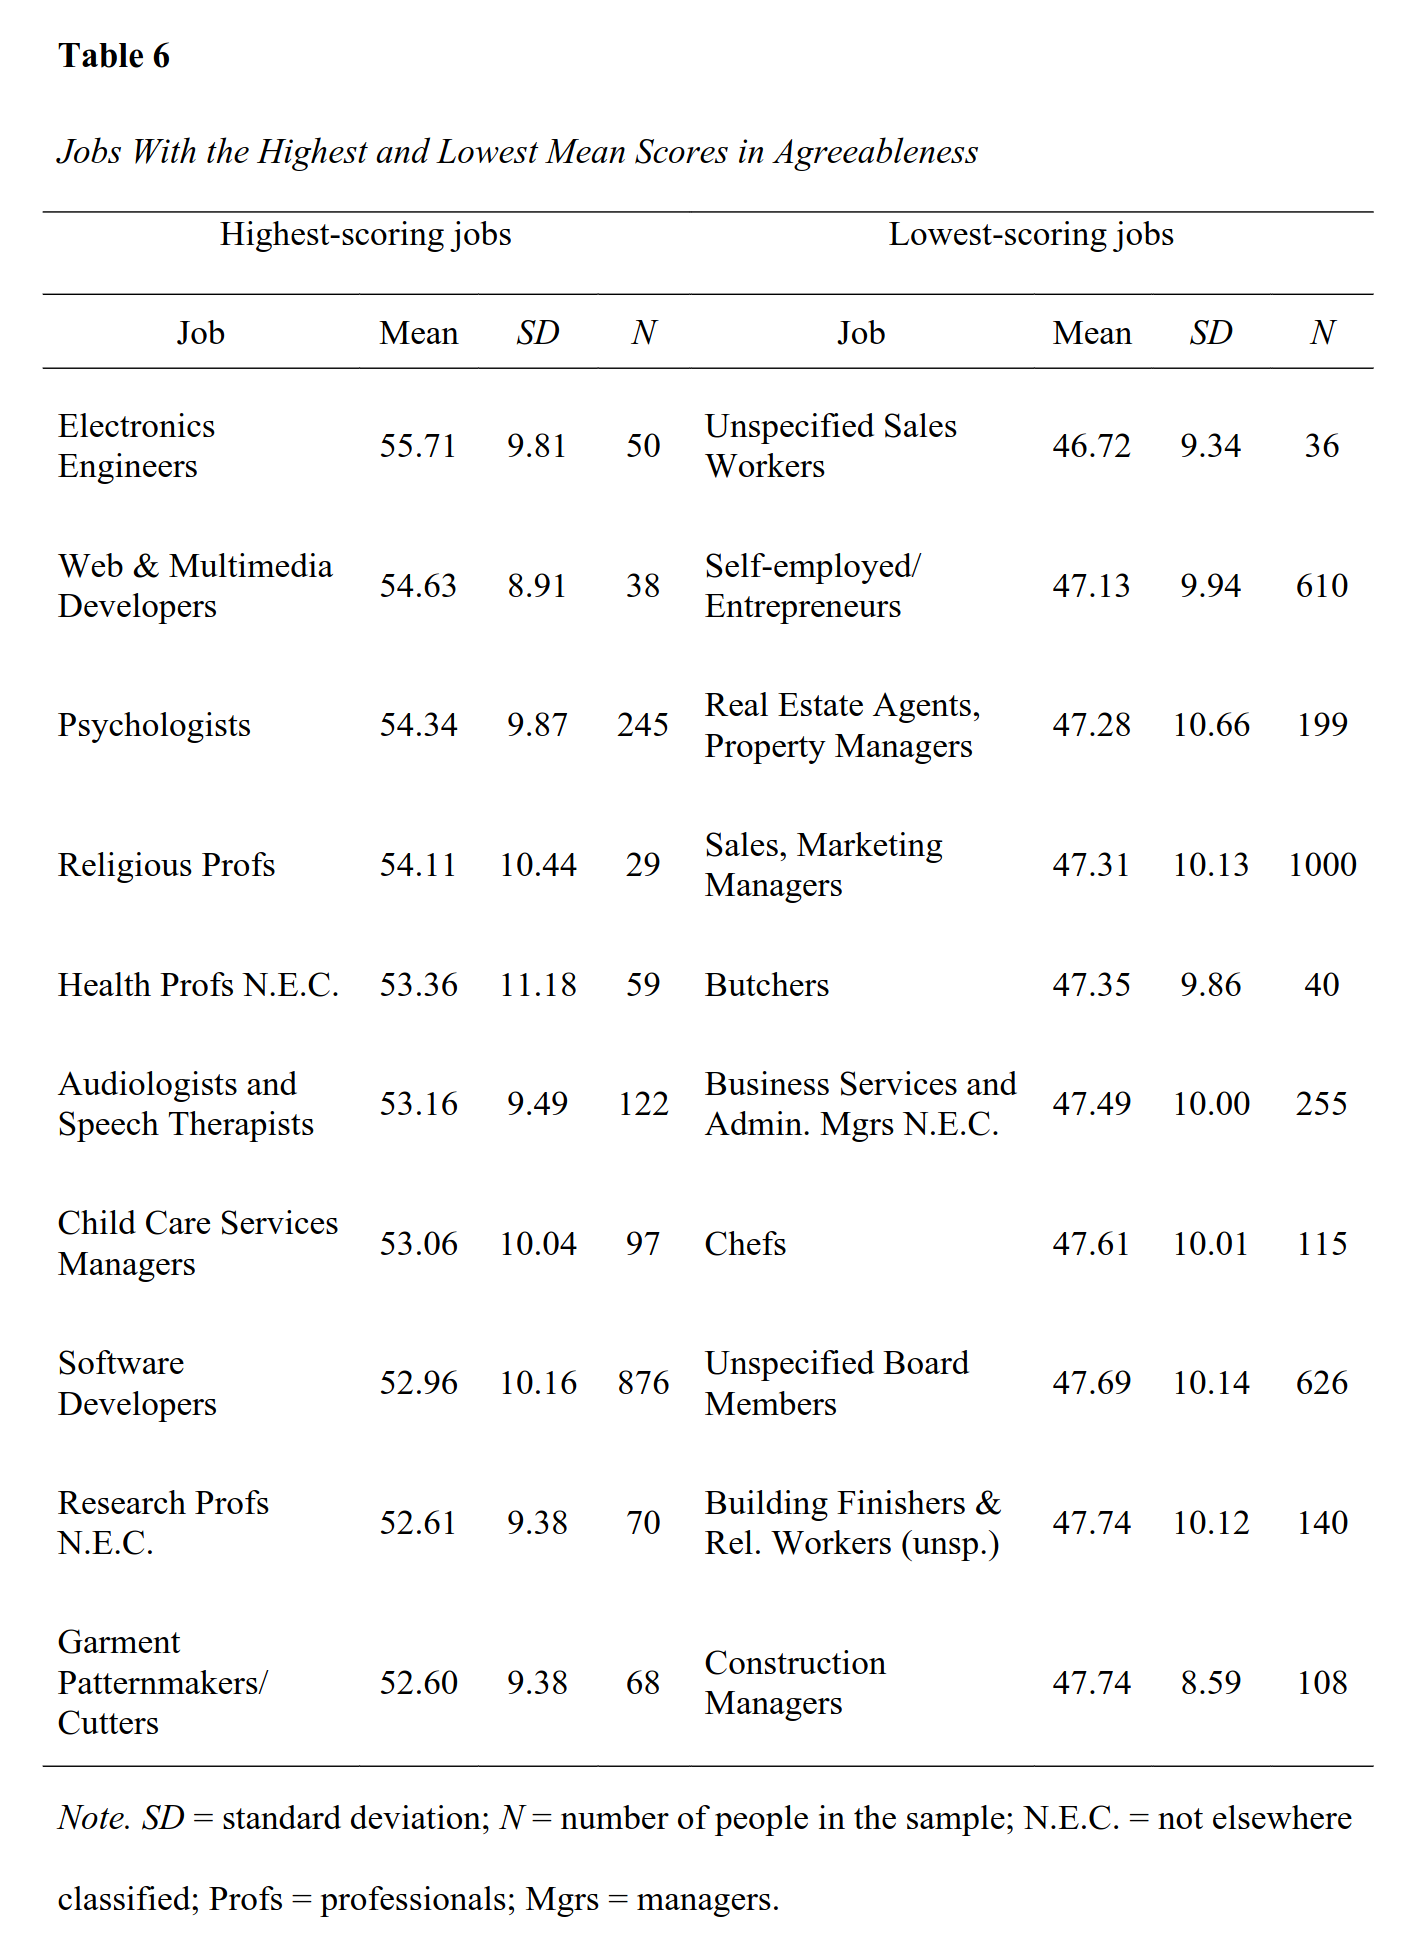
Several of the low scoring occupations are amusing, chefs (think TV cooks), start-up bros (I’m sure you have your own favorite anecdote), sales people (cut-throat), butchers (often used as villains in movies).
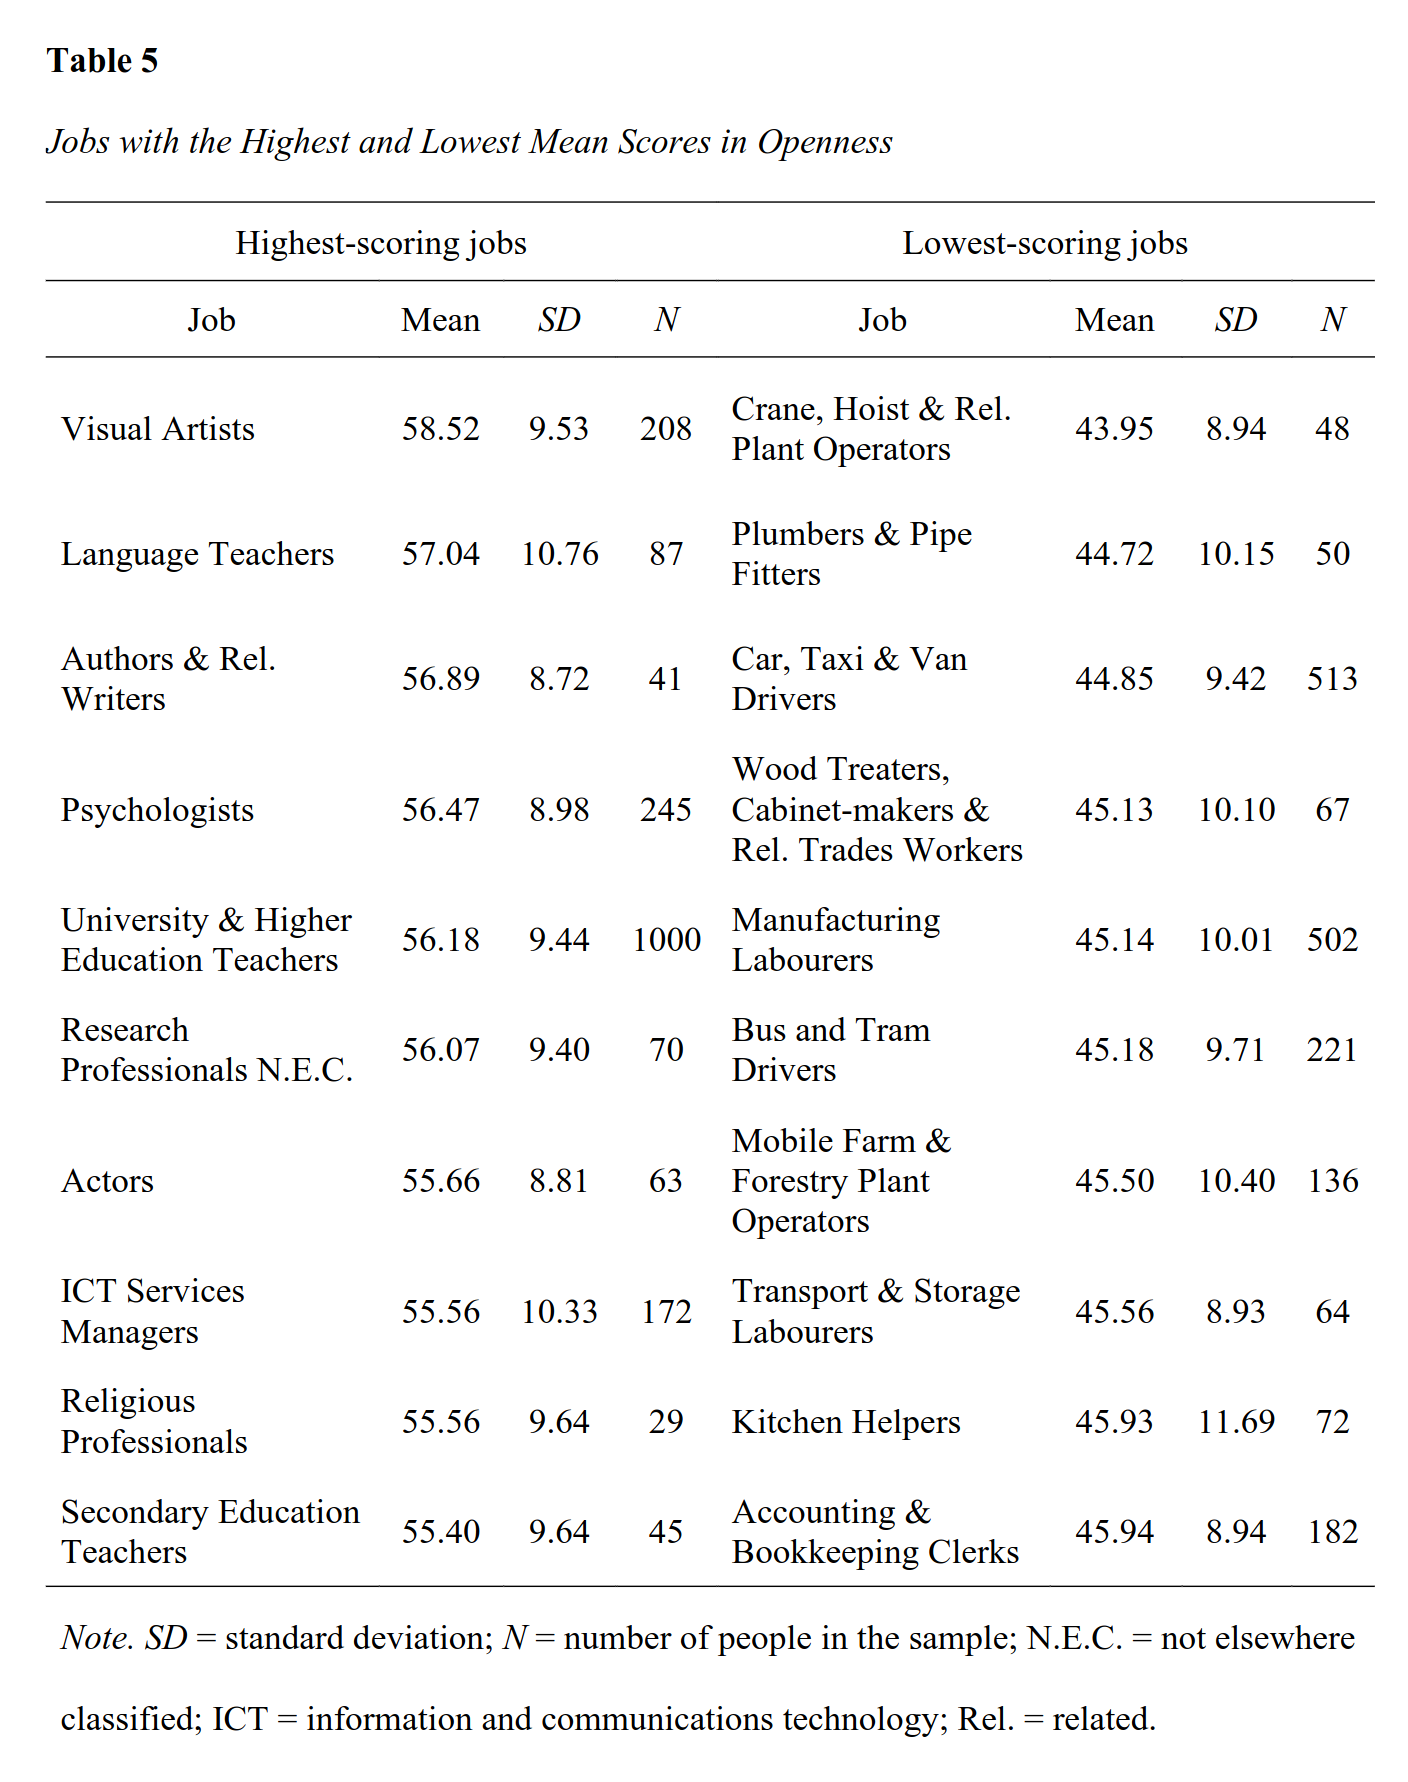
And openness (in this paper mixed with leftism, more on that later):
And finally extroversion:
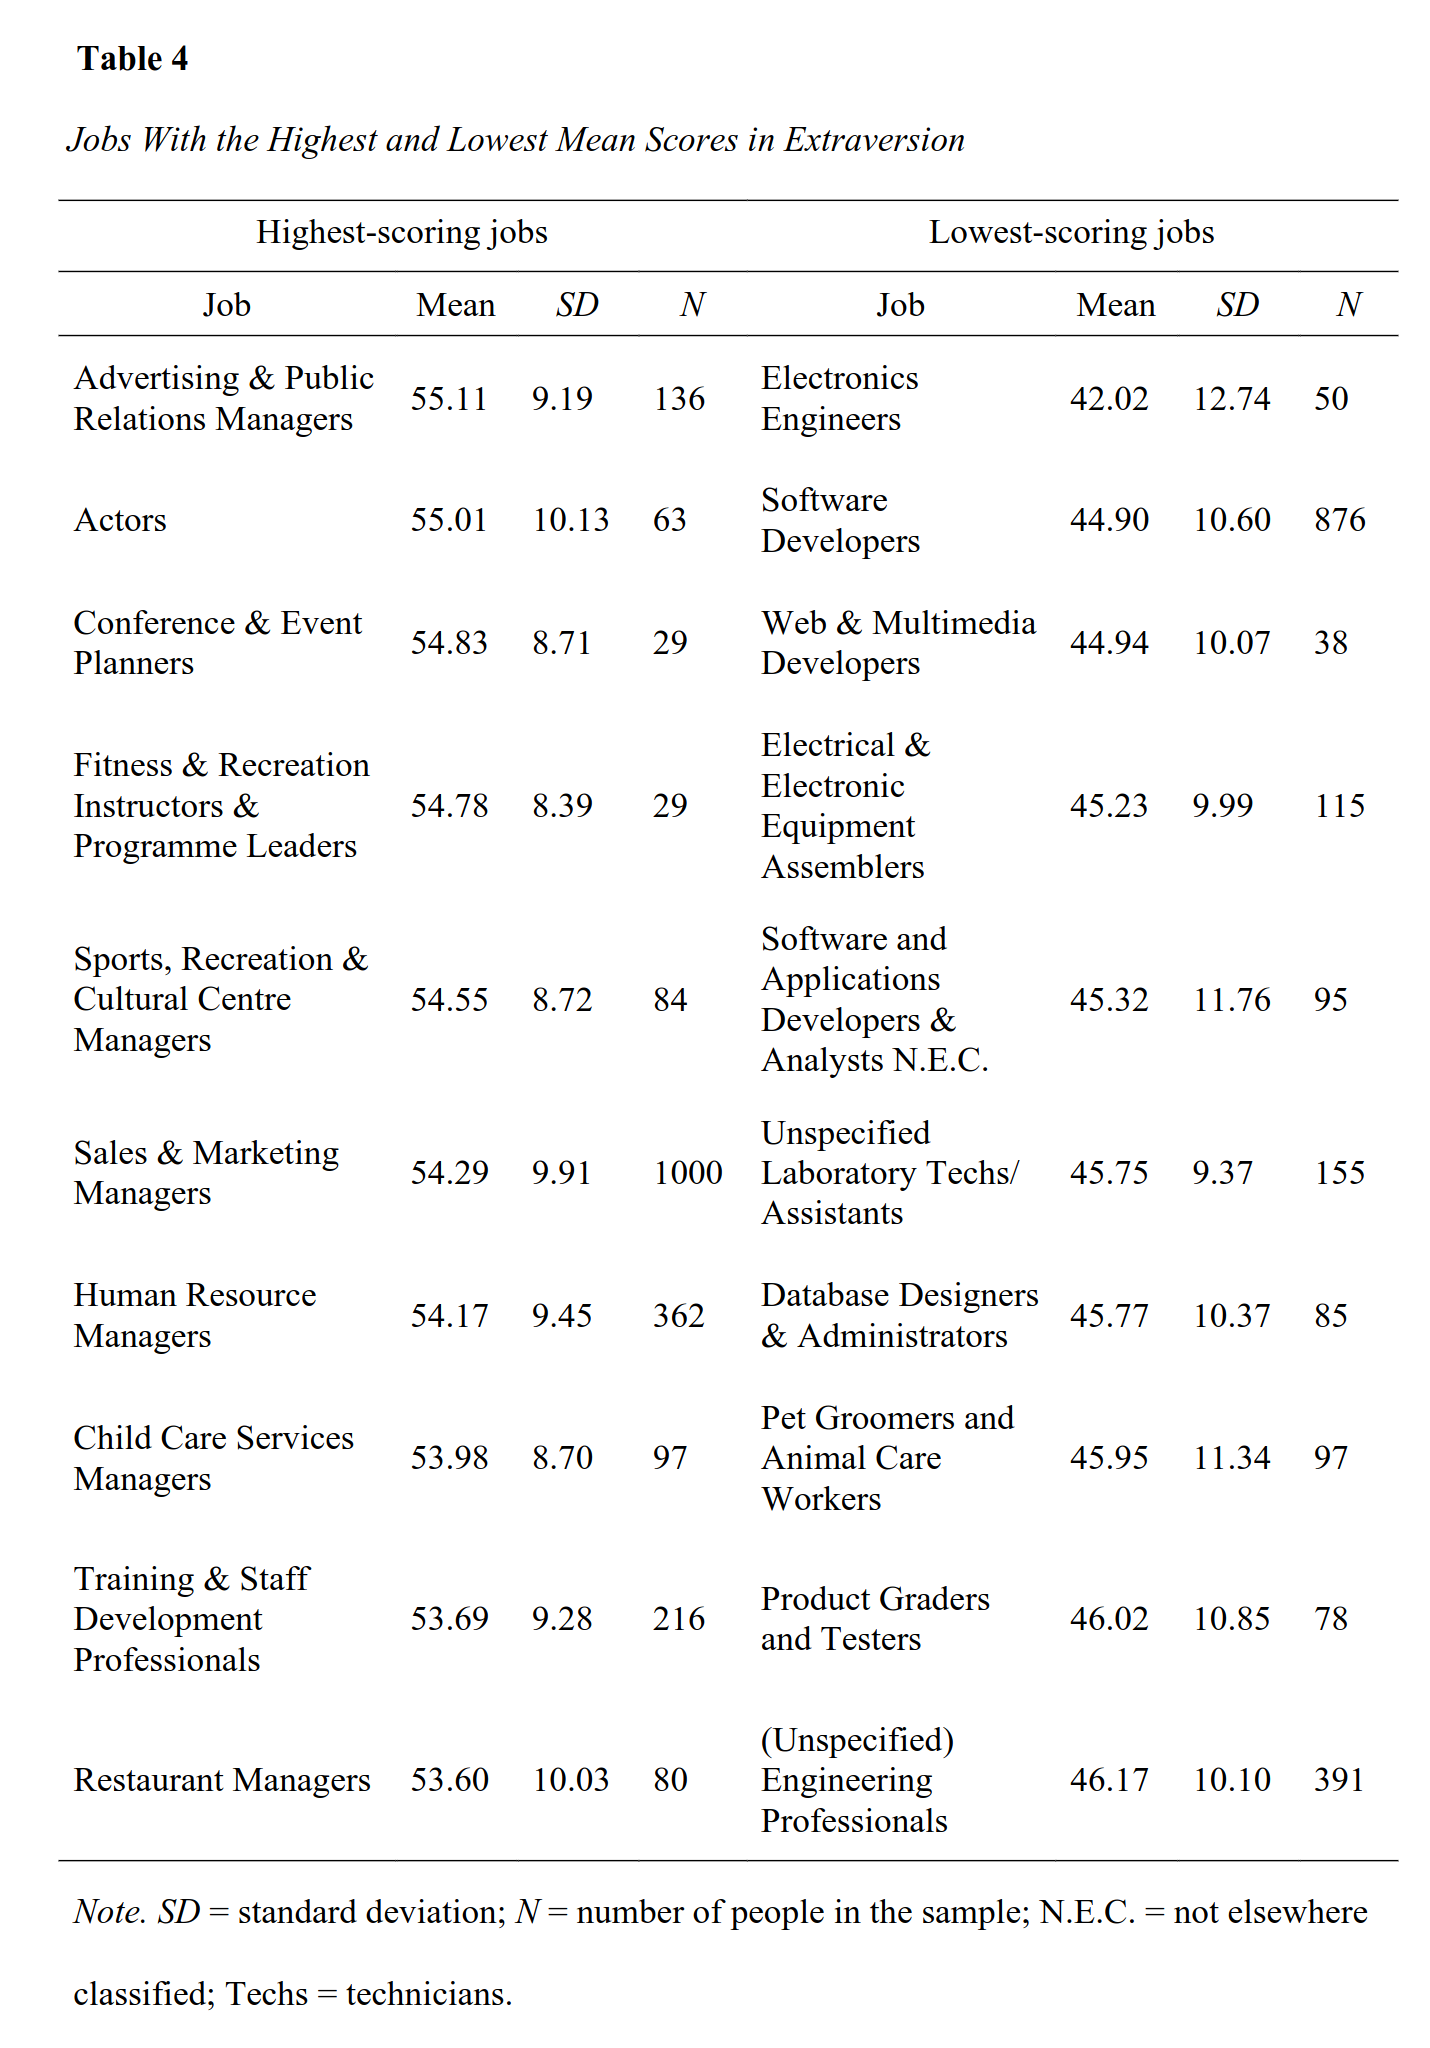
As the authors note, the results were not generally surprising, which is to say, they were mostly in line with stereotypes:
Such distributions of the Big Five domain scores across jobs are generally intuitive and appear to reflect the demands and characteristics of these professions, such as high openness scores among artists and writers and the high conscientiousness among engineers and finance managers
We could call it “generally intuitive”, or we could call it stereotype accuracy and be more honest about it, while of course reducing the chances the paper will make it through peer review. The examples chosen illustrate positive aspects for some occupations, not the presumably negative aspects of high neuroticism or low conscientiousness for others.
Looking at the tables, it appears that several occupations are rather extreme in the personality space, that is, outliers on multiple traits. By downloading the data from their web app, we can measure compute this across the 5 traits to see which occupations have extreme personalities in general:
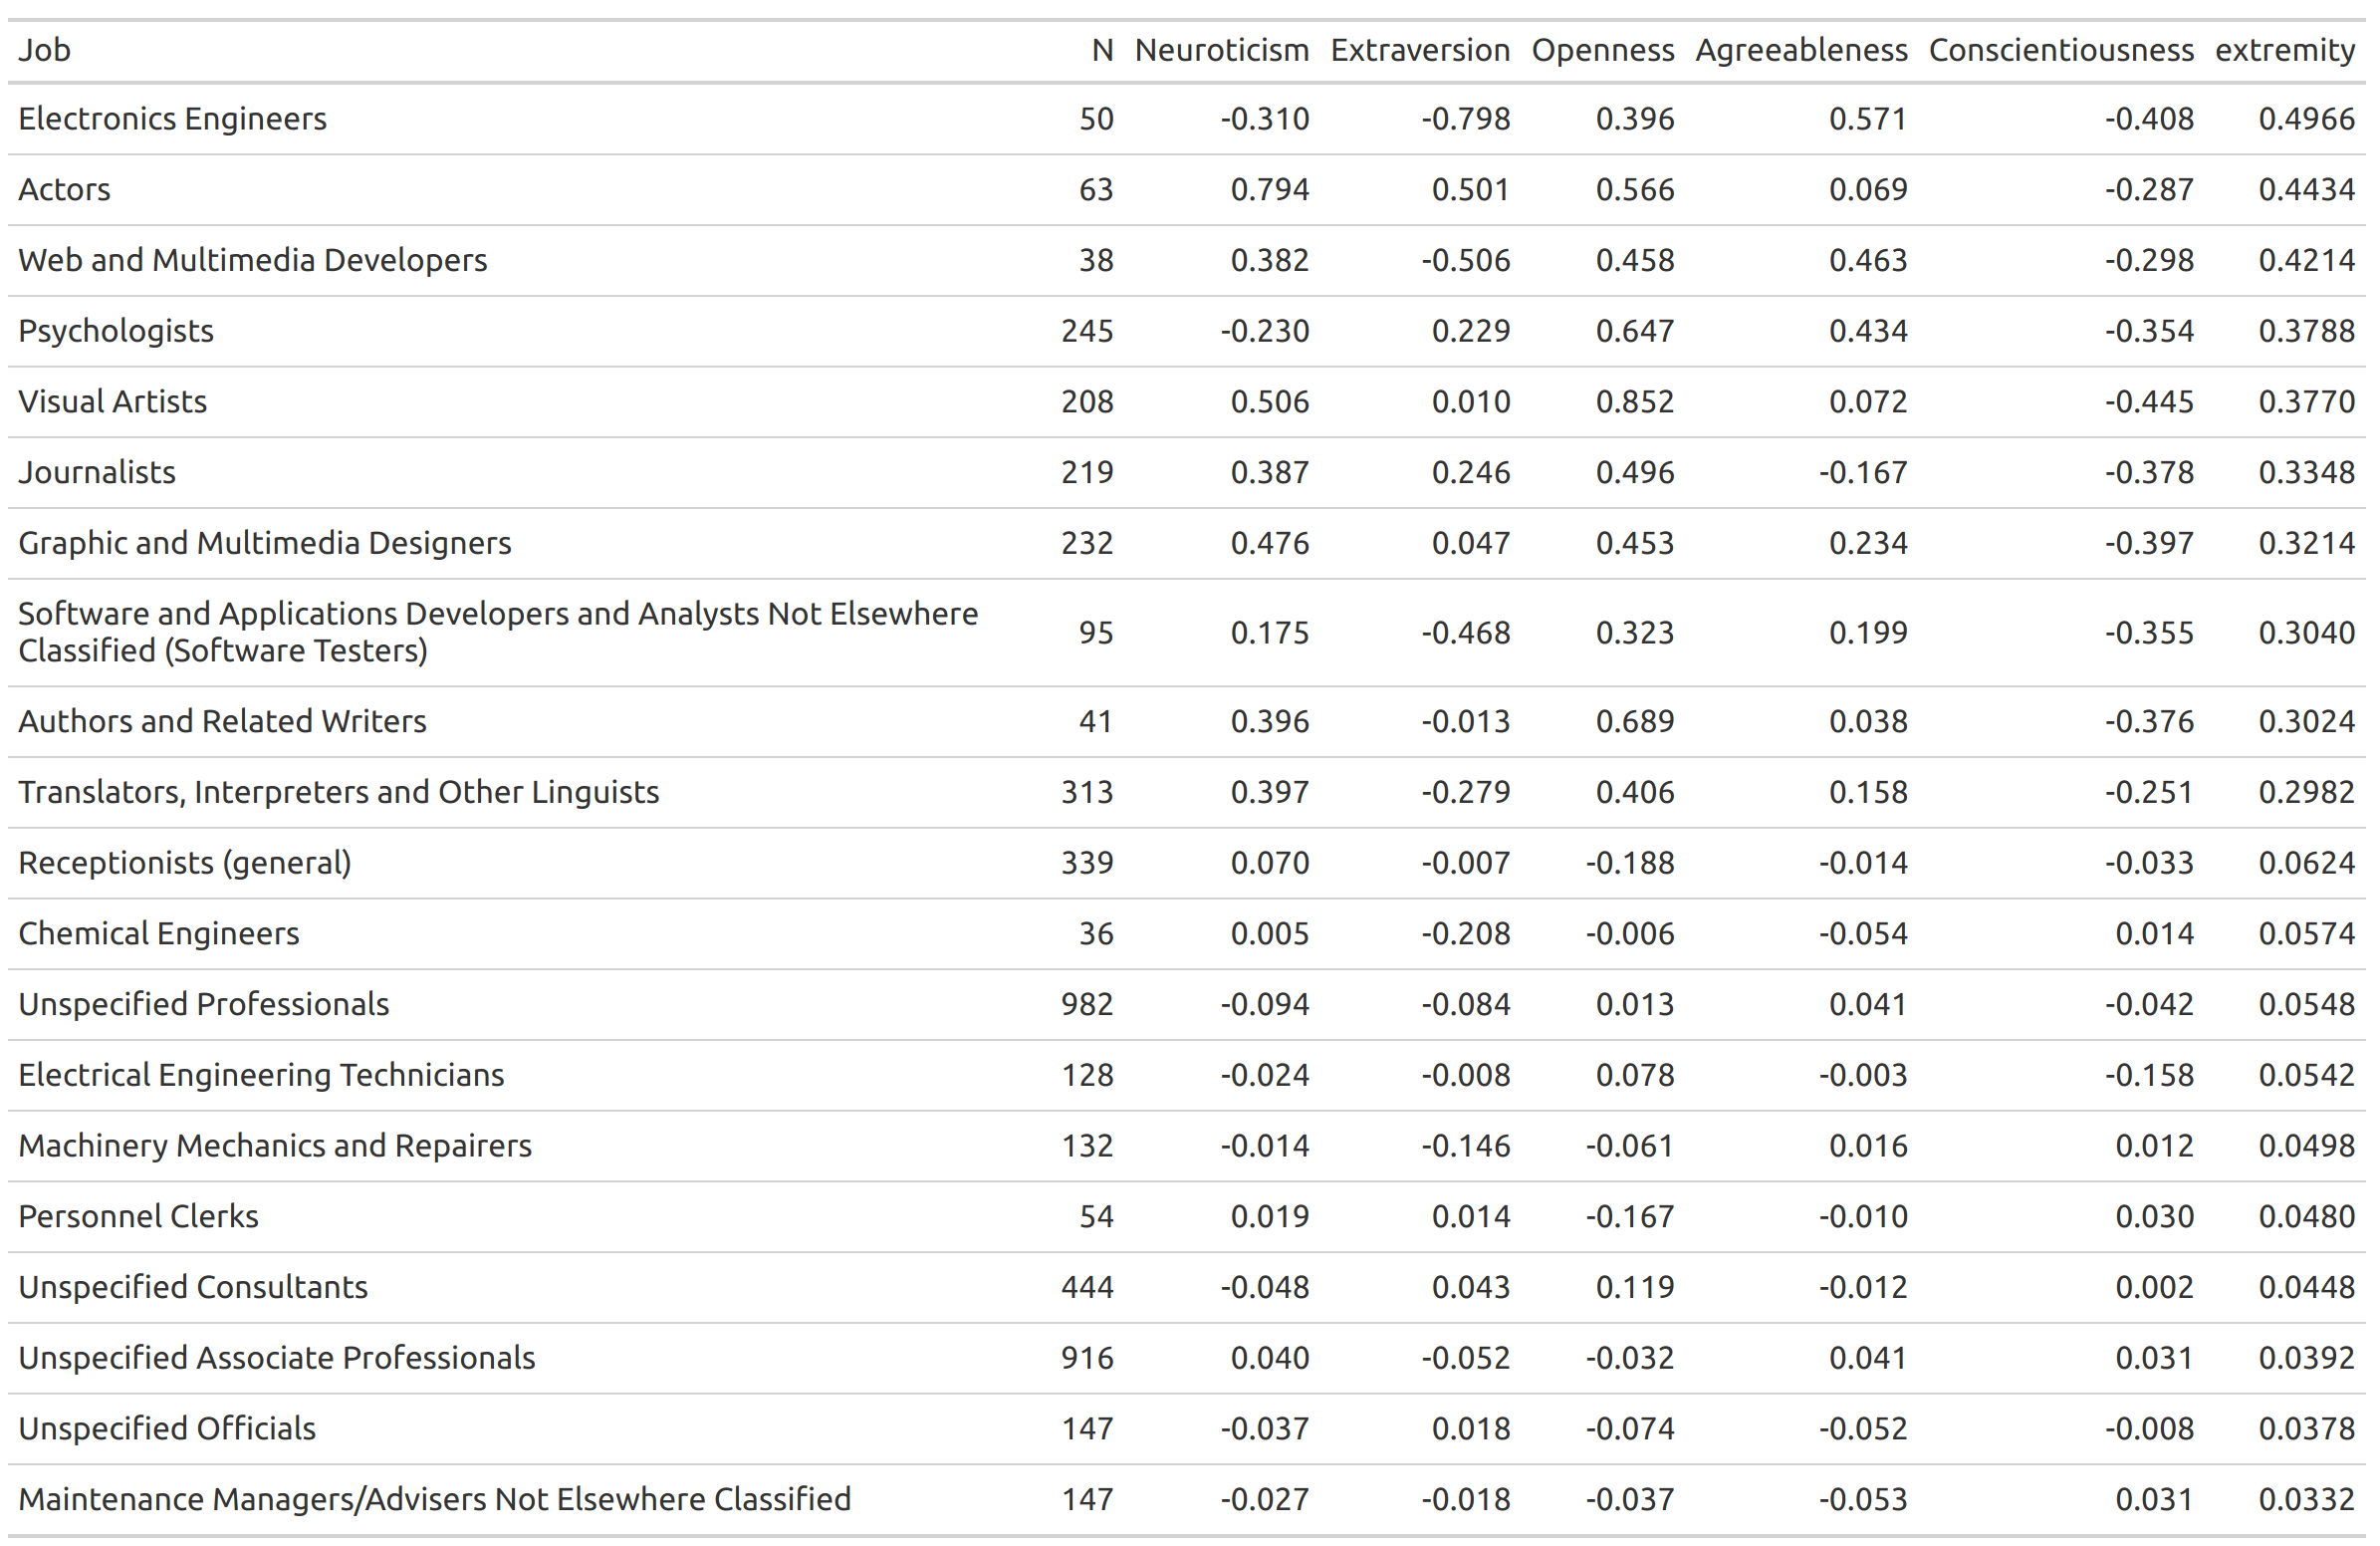
Extremity is here defined as the average absolute z-score for a job across the big 5 (in words, how many standard deviations the occupation average is across the Big 5). The first 10 rows shows the most extreme occupations, the bottom 10 the most normie occupations, in terms of personality differentiation. For whatever reason, electrical engineers appear to be the most odd people as an occupation, especially due to very low extroversion. Other top scorers are actors, journalists, and psychologists. These occupations are interesting because they often tend to generalize from themselves, or otherwise assume they are normal, but the data show they are rather unusual people. The fact that these people often speak on others’ behalf or are considered as role models makes it even more problematic. Additionally, it is rather strange that chemical engineers are so much more normal than electronics engineers, whereas one would probably consider them relatively simple based on clustering of occupations.
Of particular interest is the item in their personality test about politics, “(I tend to) Support liberal political candidates”. While it is certainly true that leftism and openness to experience correlate positively, some of this is also built into this scale by design. But we might also just consider it a nice measure of the political ideology tilt of an occupation, so let’s look at the top and bottom scorers:
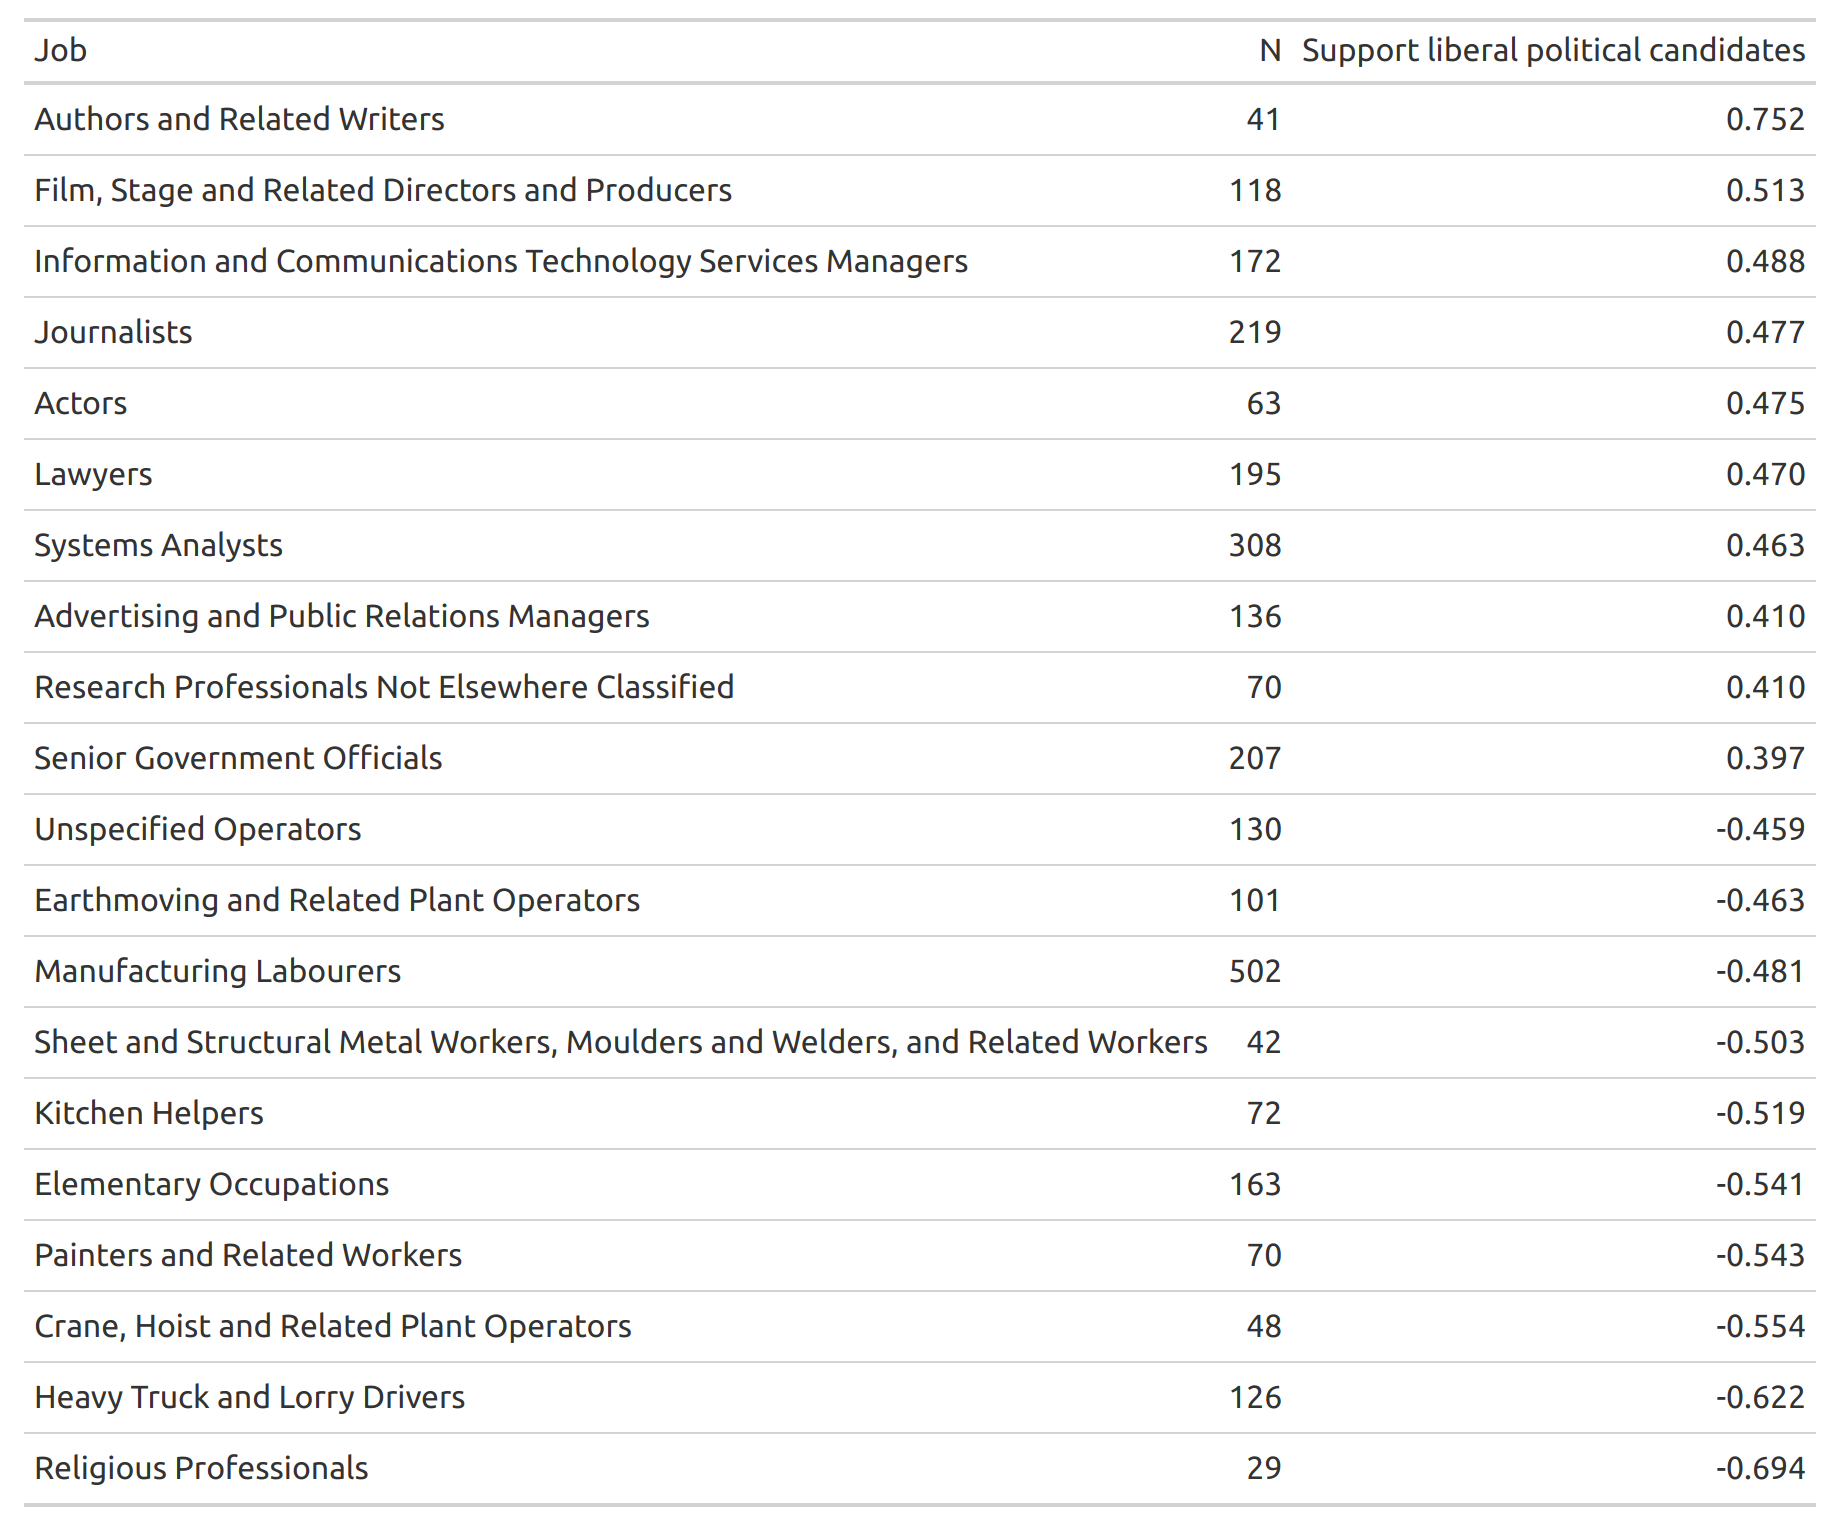
The table doesn’t have any big surprises. The most leftist groups are the familiar ones: actors, journalists, researchers, and tellingly, senior government officials. These are the deep state people, thus confirming the speculation that these people are very left-wing too. Judges, another very important social force, score a respectable 0.382, thus barely missing the inclusion in the top 10 leftist list. Actors, screenwriters/authors and advertisement/PR people produce the majority of content that people pay attention to, and given that the current variant of communism has been particularly extreme in this area, it is not surprising to see these professions in the top.
The most conservative group is not surprisingly religious professionals, though one might not get that impression from listening to the current pope or outspoken “refugees welcome” priests. It would appear this kind of priest is either a loud minority or that things are just different in Estonia compared to elsewhere. The other conservative occupations are the working class roles. As the results are age and sex adjusted, so these results are not just because these occupations have a lot of old grumpy men.
There is some tendency for the jobs with more unusual average personalities to be more leftist:
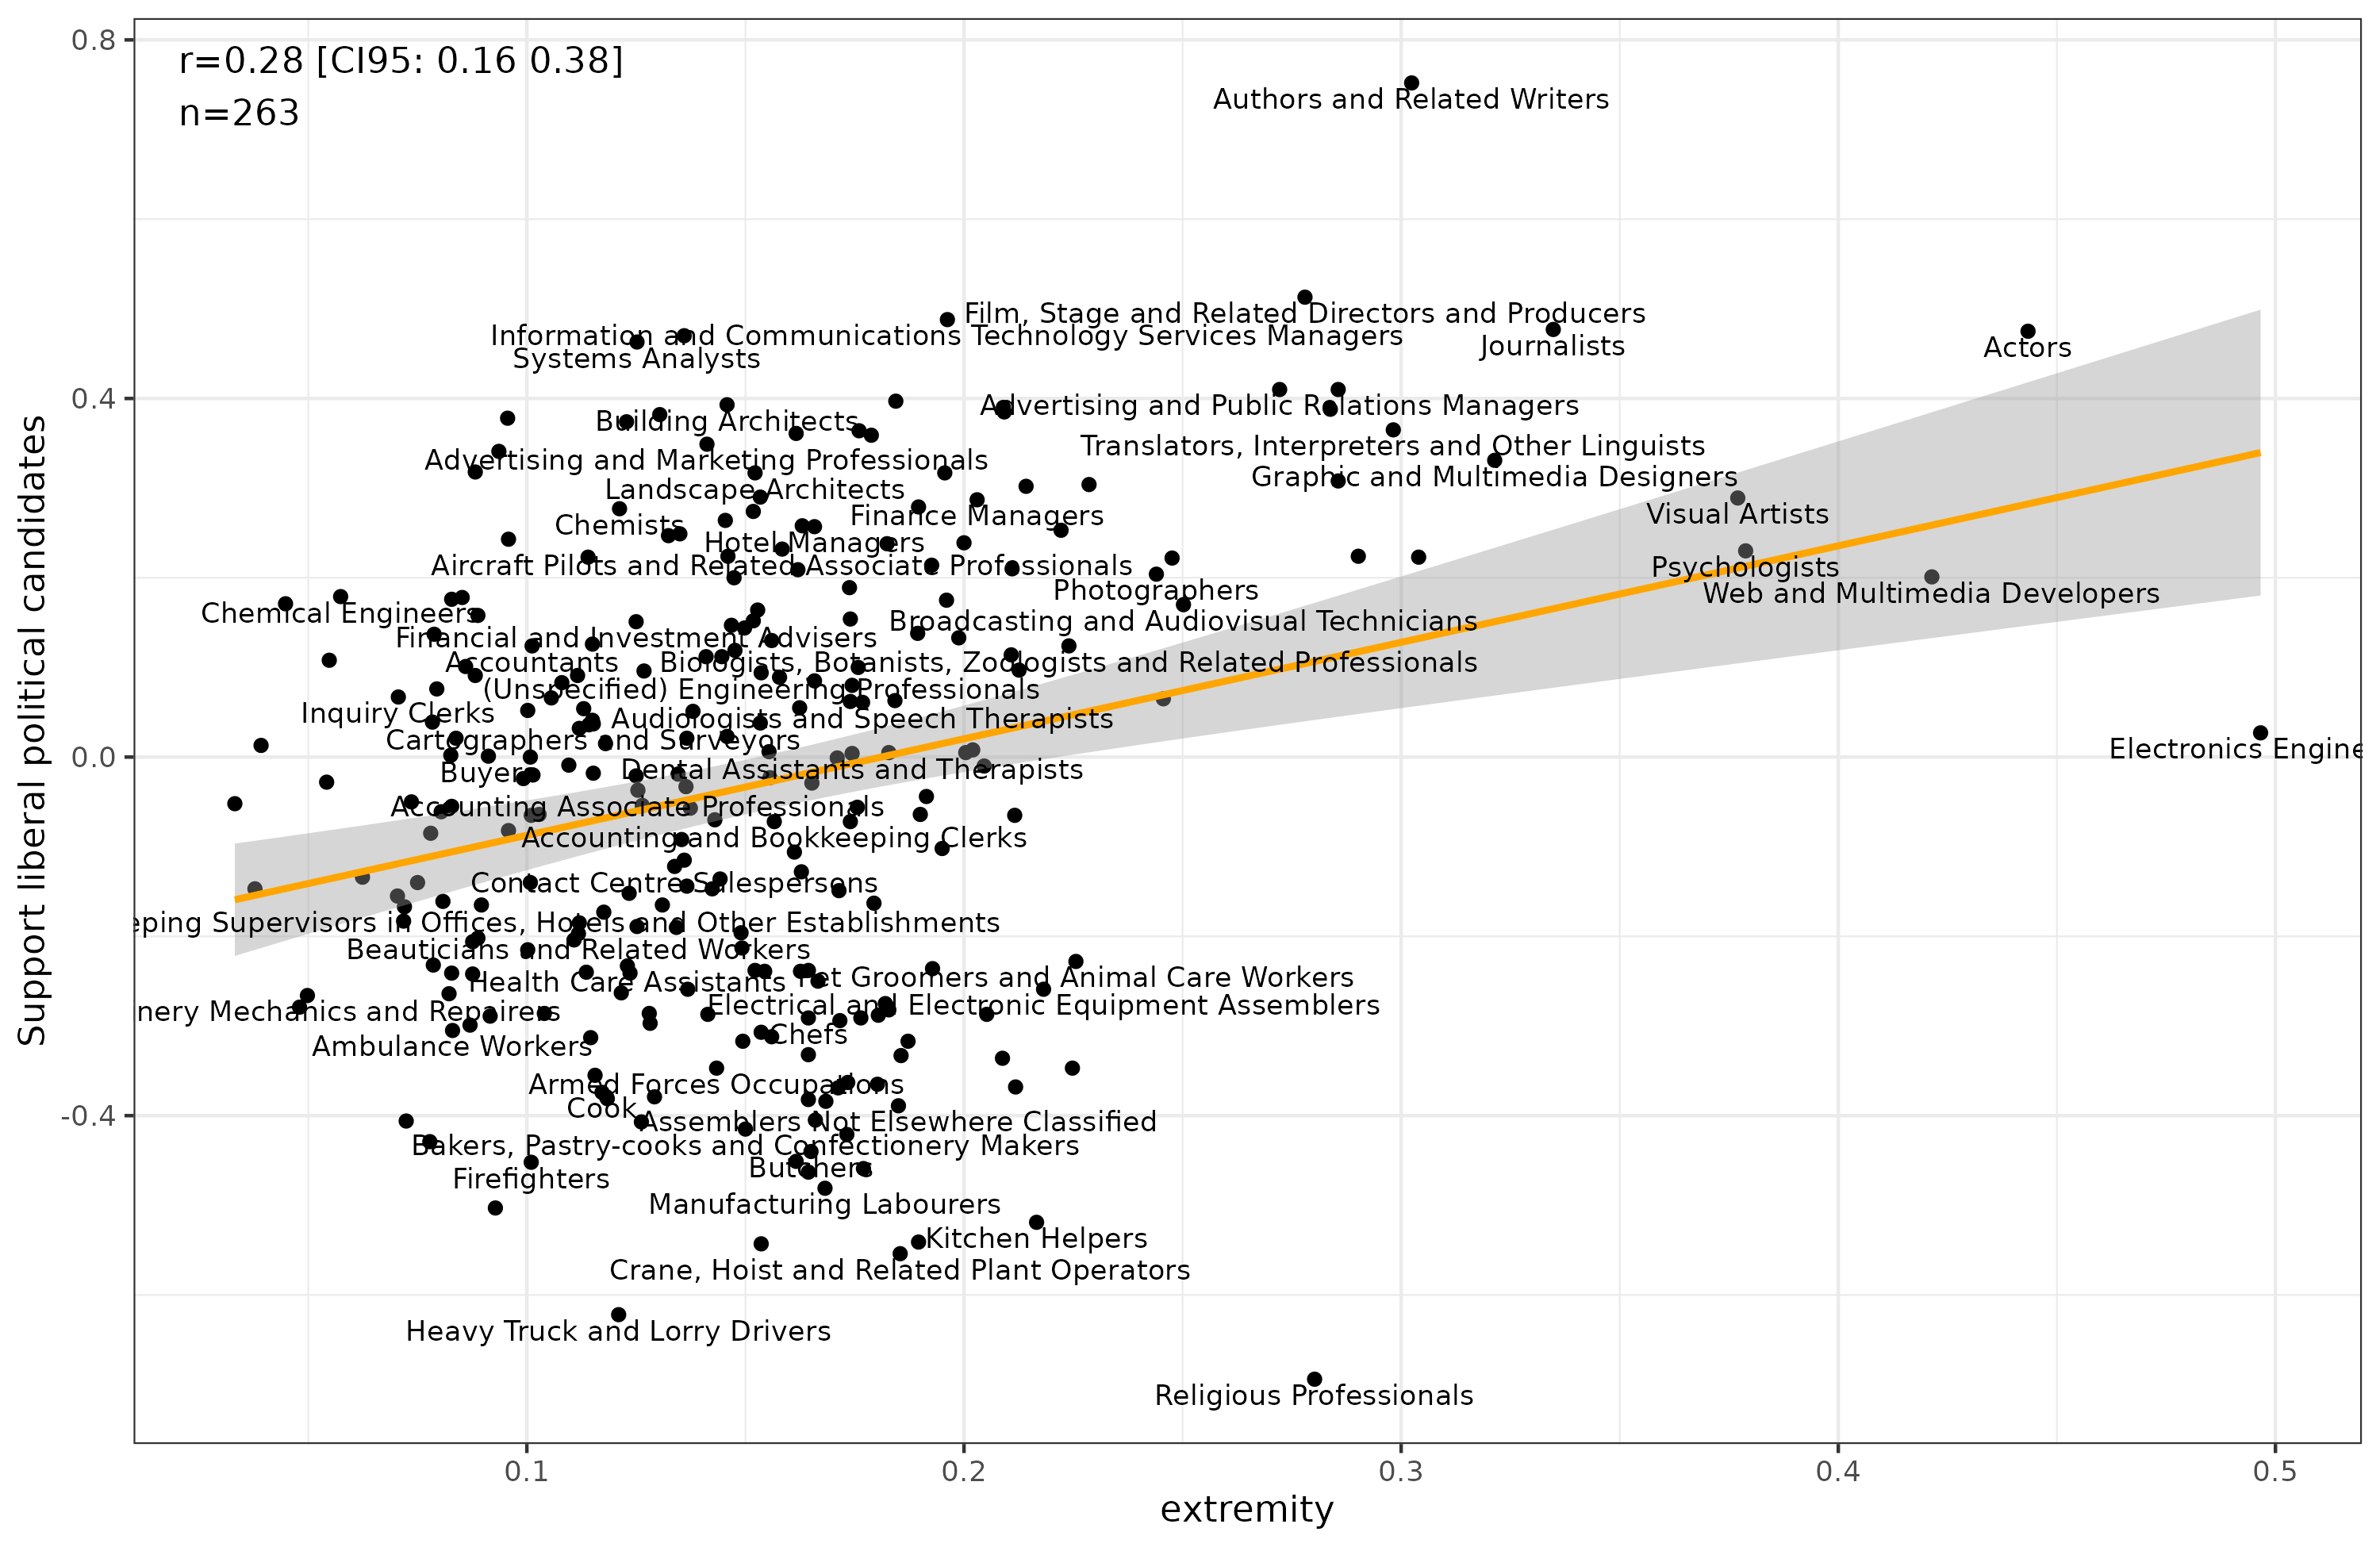
It’s not so obvious what this might mean, maybe nothing, though the p value is quite small (p < .001).
Overall, though, the correlations at the occupation level are not that interesting:
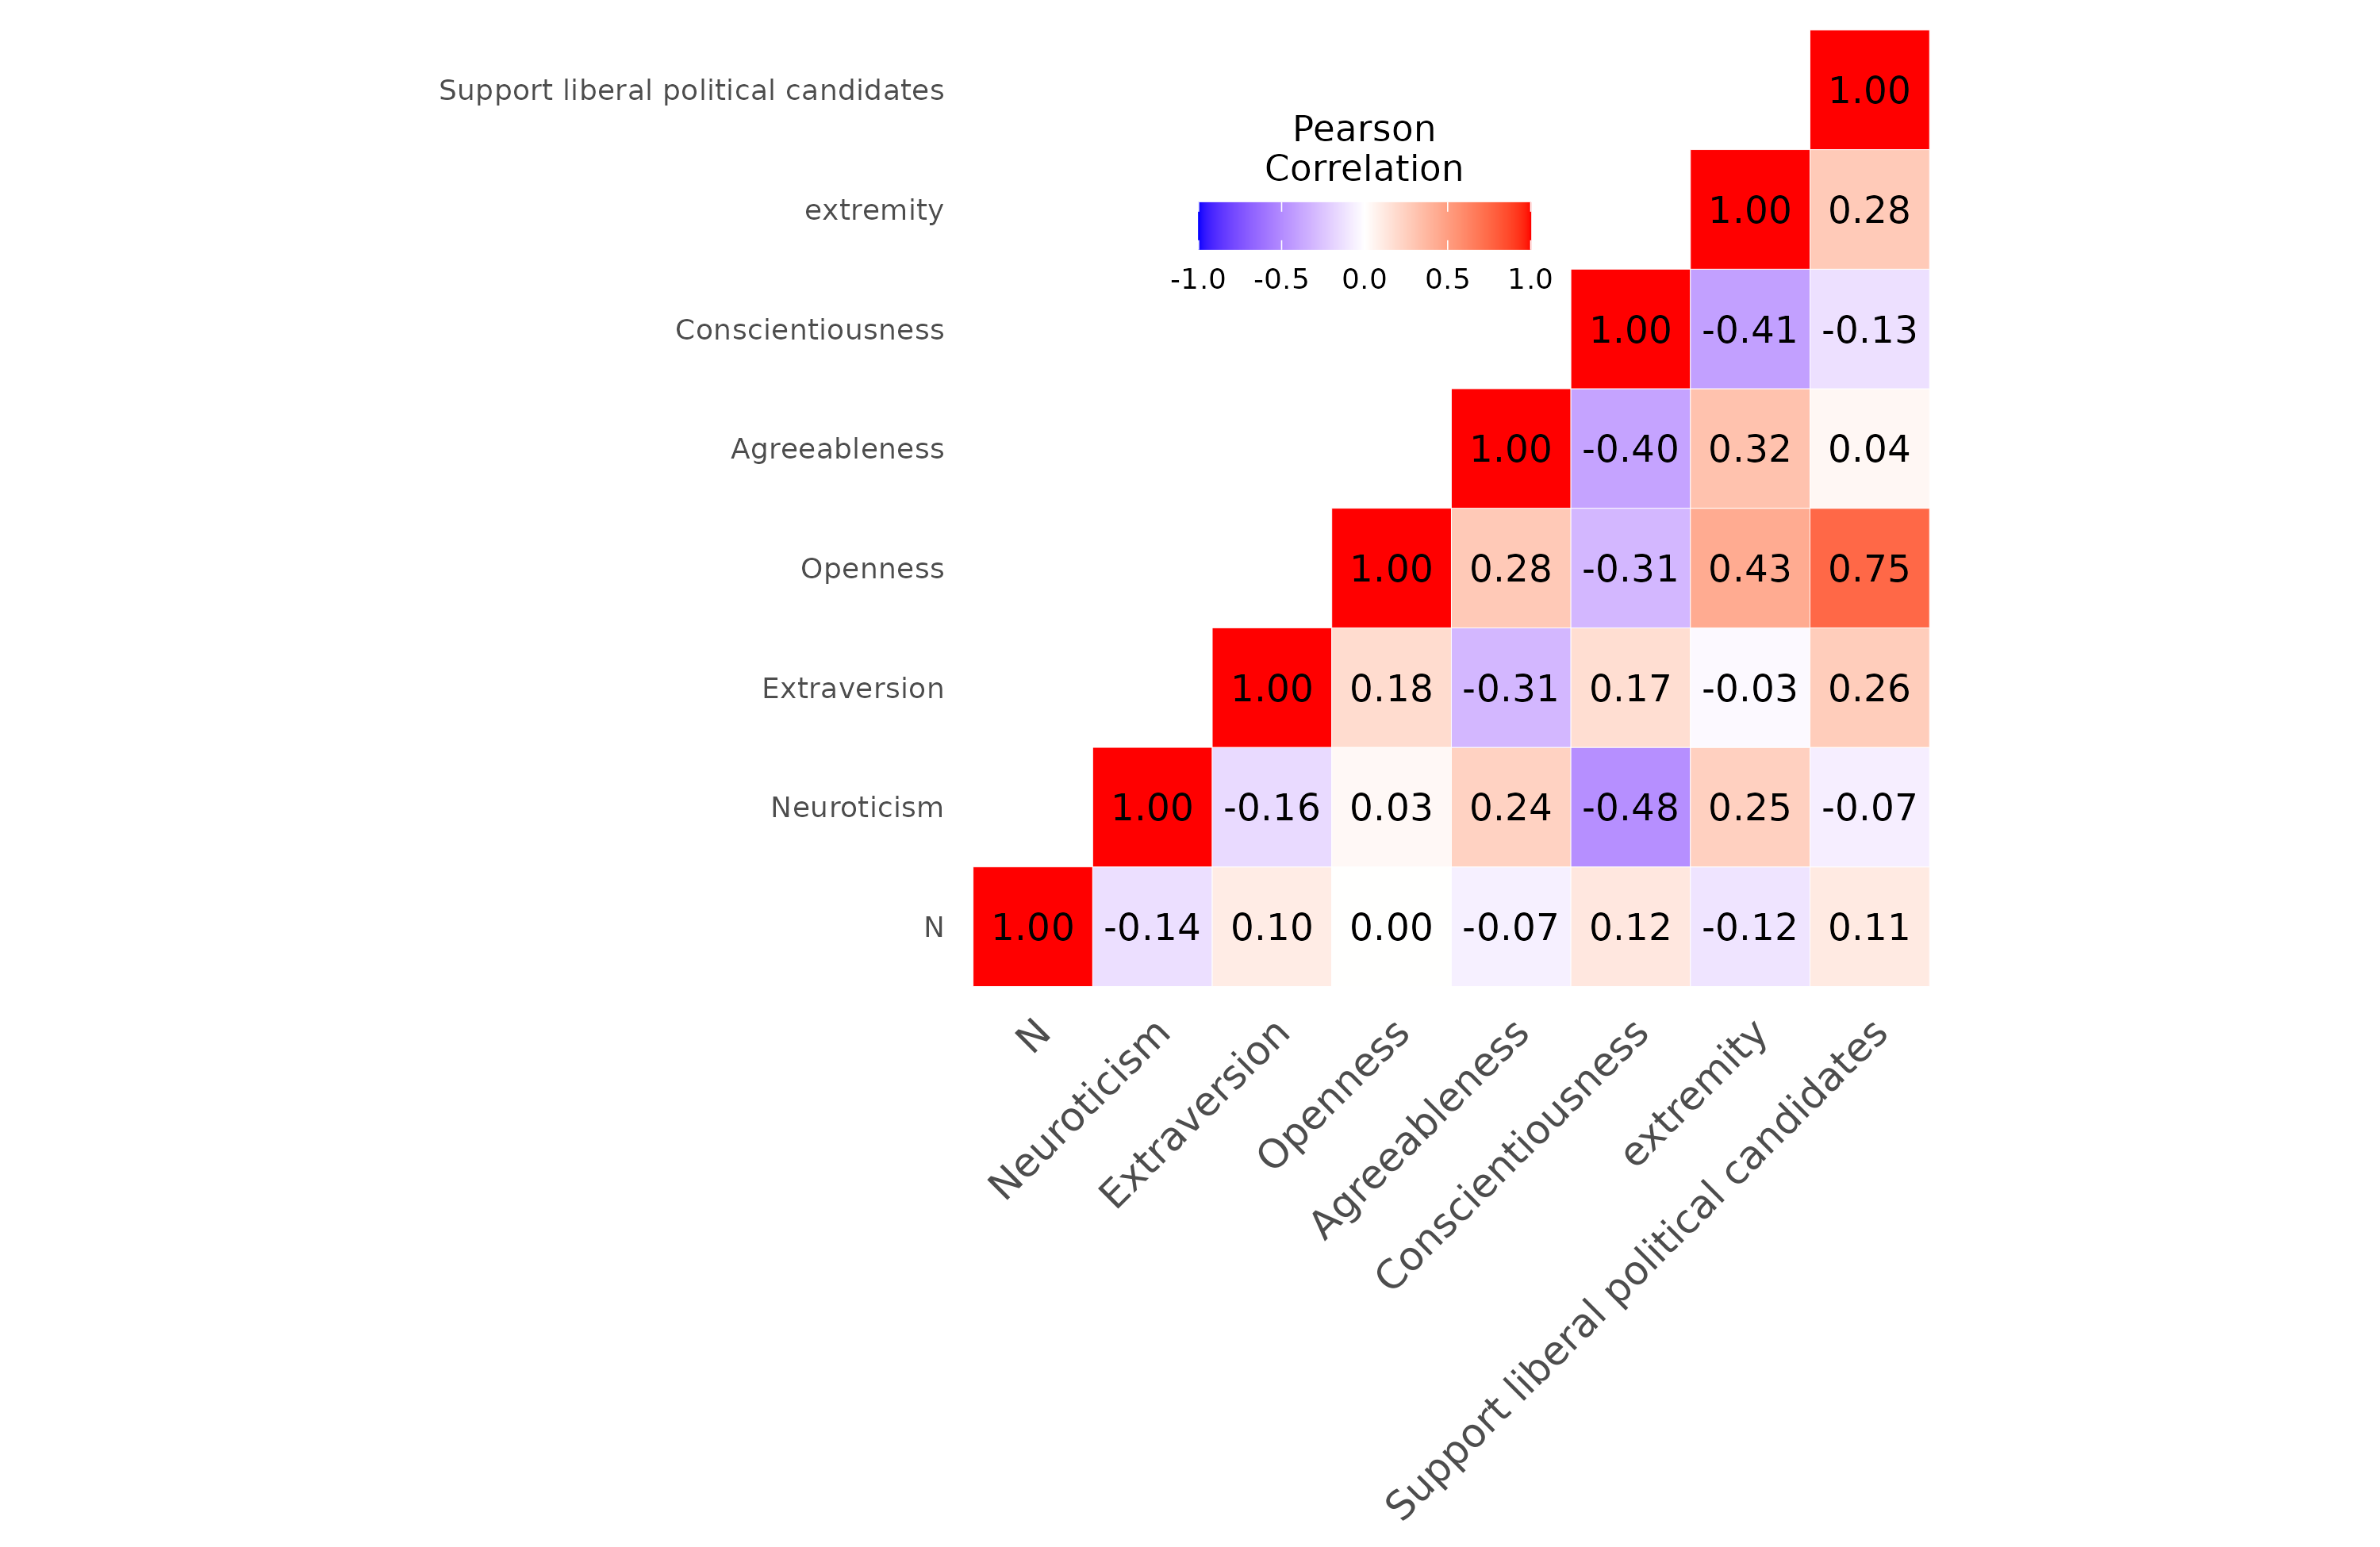
Given the sample size of 263, correlations above or below .14 are p < .05. The correlation between leftism and openness is somewhat artificial as that leftism voting item is part of measurement of the openness trait. There is no general factor of personality to be seen at this level of analysis, not that one would necessarily expect one.
Conclusions
Overall, this is a very cool paper that provides a near-direct replication of the previous study based on UK data (Understanding Society dataset). Results were mostly unsurprising, i.e., rather predictable. Authors didn’t discuss or mention stereotype accuracy, but one chief utility of such a dataset would be to ask people for their stereotypes of the various occupations. I bet high accuracies would be found for some aspects of this. Clearly, people on dating sites put a great deal of stock in the listed occupation, meaning that normal people consider the expectations based on occupation to be important information for mate choice. The study bears out this attitude as the differences in personality were often quite large (e.g., programmers were about 1 standard deviation more introverted than actors).
The chief issues with the study, as I see it, is that it lacks measures of social status (income, education) and intelligence, as well as the associated demographics that they clearly had available to them (age, sex, and an Estonian vs. Russian would be interesting). With these variables, one could have conducted additional interesting supplementary analyses. For those interested in looking closer, you can either access their online tool here, or use the data I scraped from it. Note that I wasn’t able to scrape all the item-level results, and they didn’t provide the unadjusted results anywhere that I can find (i.e., without removing age and sex variation in personality).