I have often talked about how measurement error impacts correlations between two variables. Here we are talking about classical measurement error, which is theoretically understood as adding a normally distributed variable with a mean of 0 and with no relationship to the variable. Because this variable by definition has no relationship to anything else, this reduces the correlation of the new composite variable with everything else. Here’s a quick illustration:
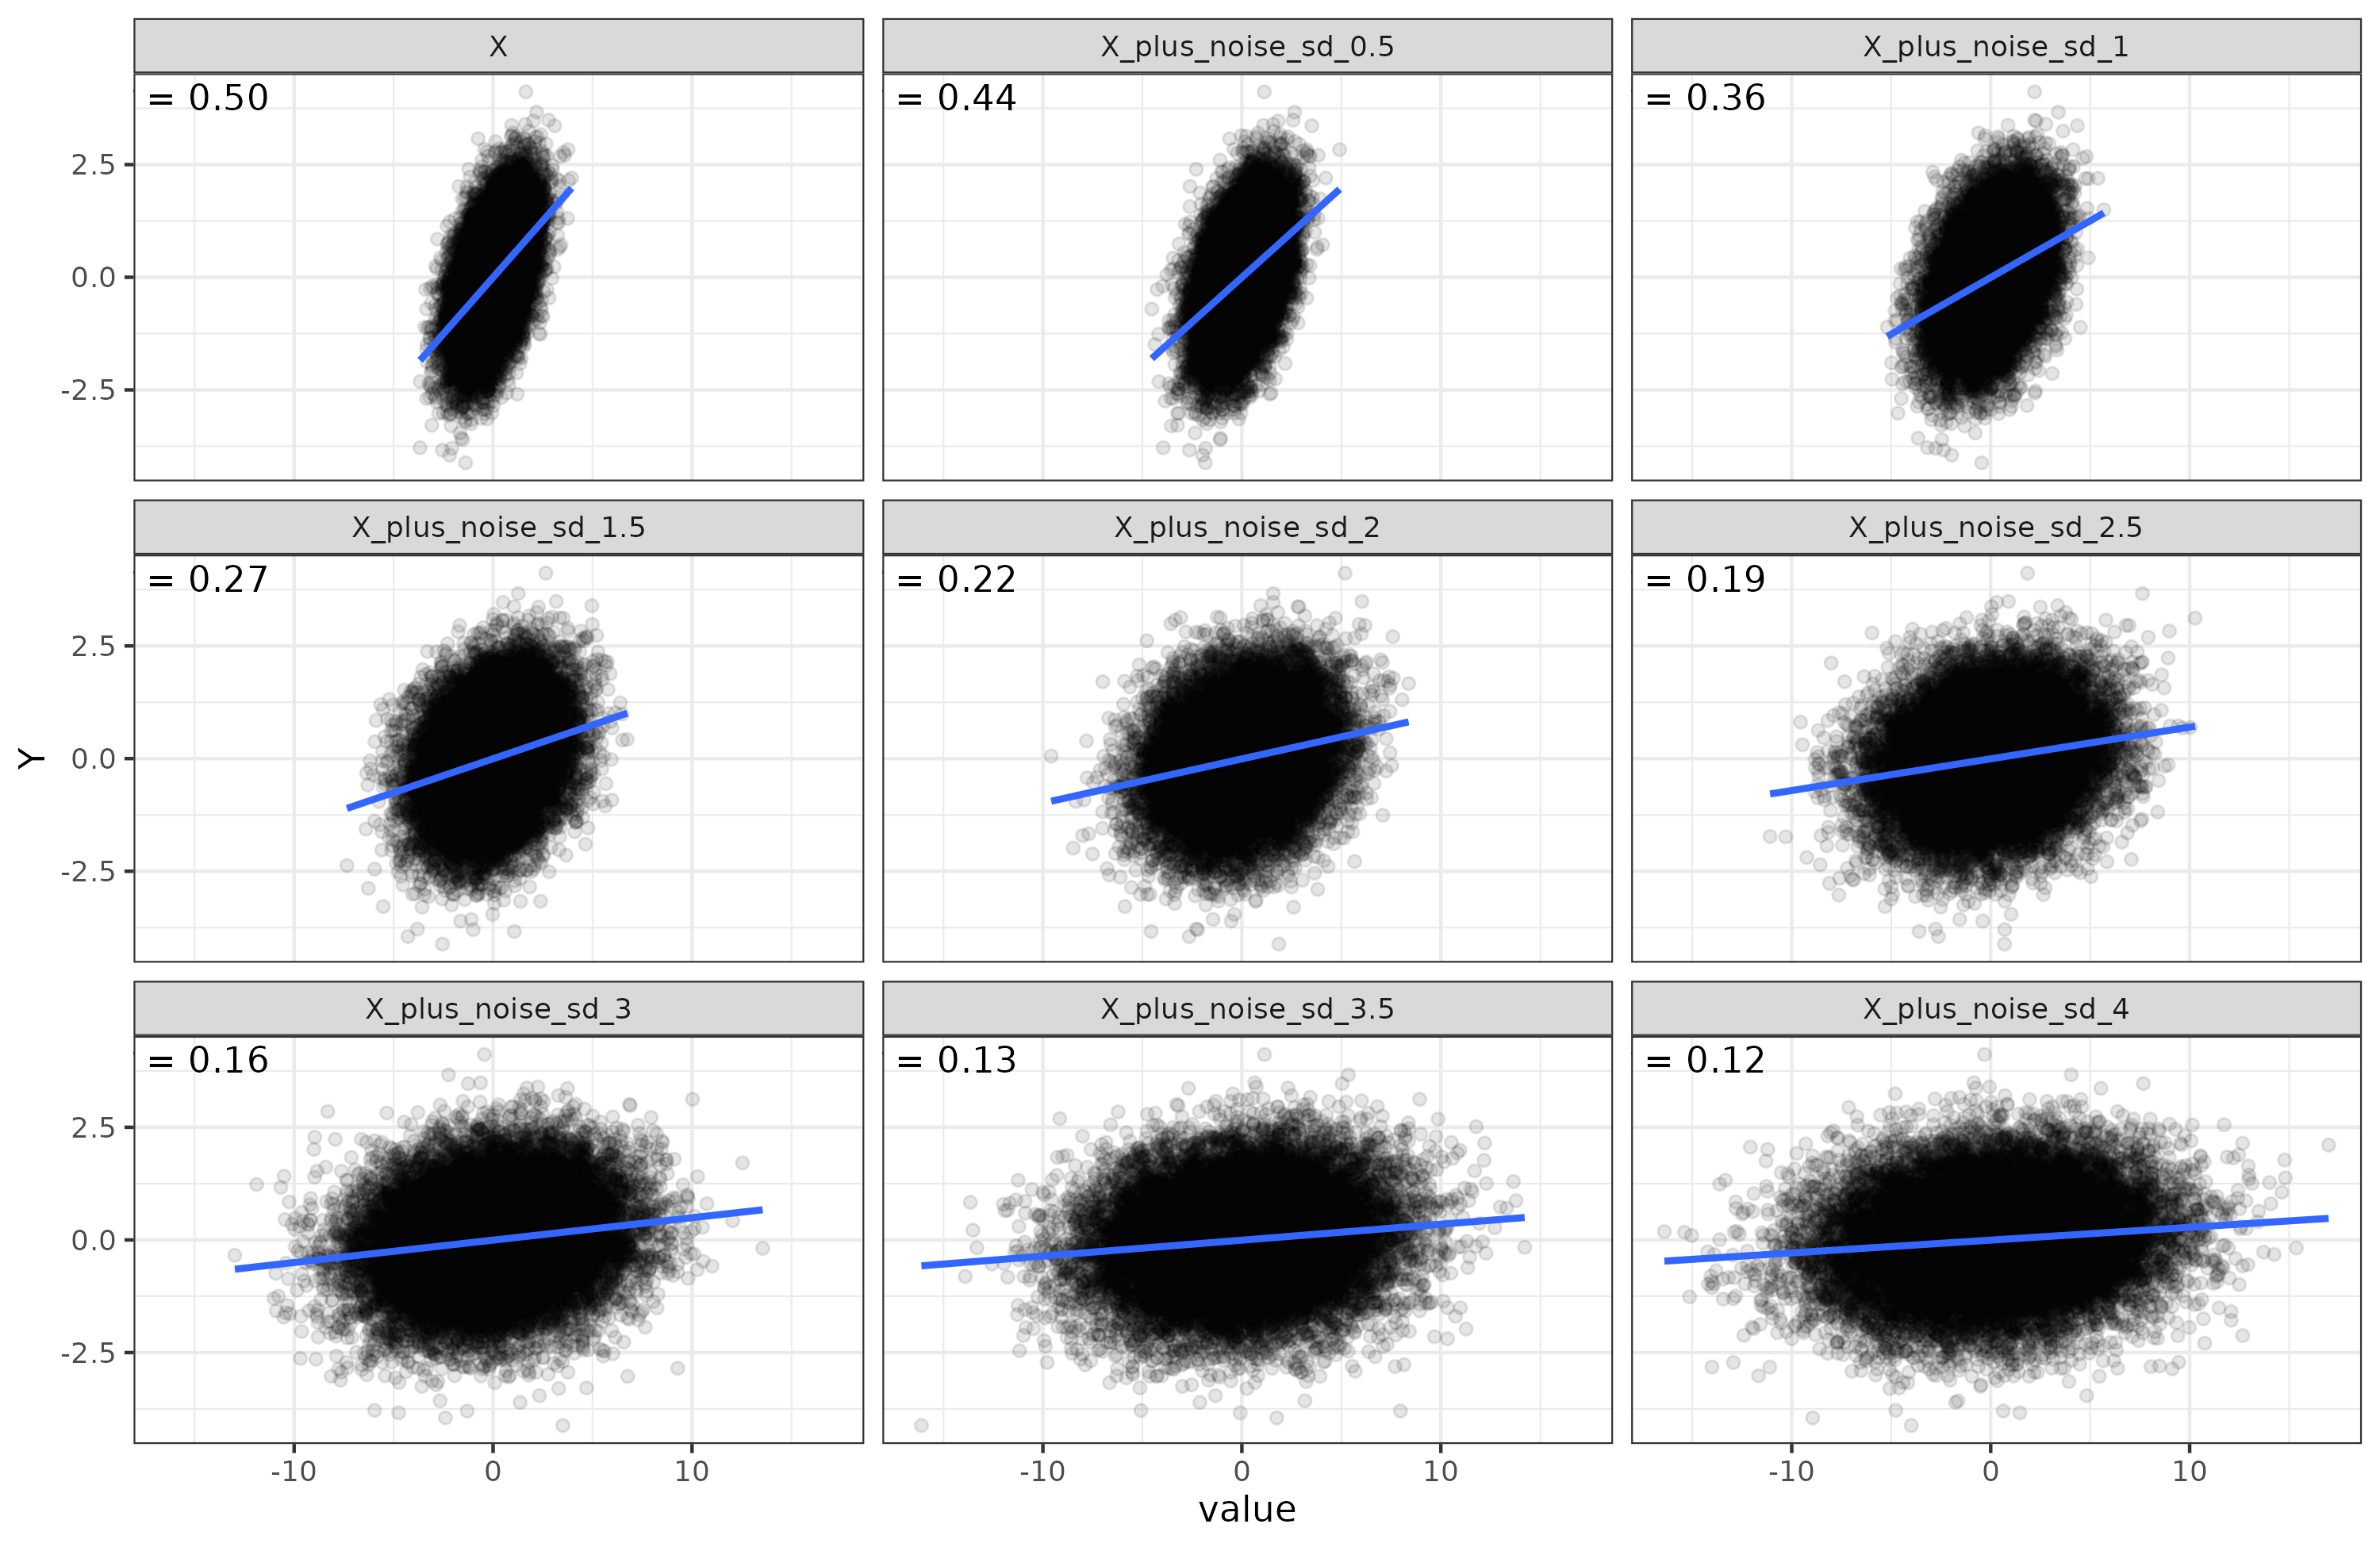
Here I simulated 20,000 datapoints for 2 variables, X and Y. They correlate 0.50. Then I added progressively larger amounts of random error to X. Above figure shows the resulting correlations with Y. They decrease, naturally, but notice how the spread (variability) of X also becomes larger. This is because the variability (SD and variance in statistical terms) of a composite variable is a function of the component variables (and their correlations).
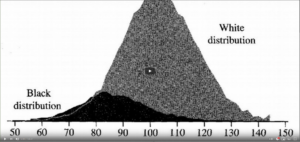
How does this point affect group differences? It’s a little tricky. Let’s assume we have two populations, one with a mean IQ of 100, and one with a mean IQ of 115. Call these the normies and the smarties. As the standard deviation of IQ is 15, the group difference is 1 standard deviation, or 1 Cohen’s d. What happens if we add measurement error to IQ? We do the same exercise as above:

Looking at the plot, you can see that the group differences don’t change. They are always 15 “IQ” points. Does this mean that adding noise somehow did not change the differences between them? Yes and no. Since we added random noise to the measurement, the means didn’t change — the average value of the noise is 0, so it can’t affect the mean. But if you look at the overlap between the groups as judged by the width of the boxplots, clearly, the gaps became relatively smaller. The reason for this is the same as above. Adding noise to the measurement increased the variability (SD, variance) of the variable, so it no longer has an SD of 15. Numerically, the above corresponds to these values:

As can be seen in the SD columns, adding noise makes the SD larger, and shrink’s Cohen’s d (=the group difference divided by the within group SD), and lowers the correlation with the original variable (reliability). Because of this, when comparing groups, one has to also adjust for the measurement error (the reliability) of a given measurement. If this is not done, it will appear that the size of the group difference depends on the study, whereas really the only thing that differs is the amount of error in the measurements. Cohen’s d can be adjusted for measurement error using the original attenuation formula by converting the Cohen’s d values into Pearson correlations, applying the correction, and converting back. Those values are shown in the last column. These values values are all close to 1.0 as expected.