Earlier this year, Finnish researcher Oskari Lahtinen published a new scale of wokism or critical social justicism:
- Lahtinen, O. (2024). Construction and validation of a scale for assessing critical social justice attitudes. Scandinavian journal of psychology.
Two large studies (combined n = 5,878) set out to construct and validate a scale for assessing critical social justice attitudes. Studies assessed the reliability, factor structure, model fit, and both convergent and divergent validity of the scale. Studies also examined the prevalence of critical social justice attitudes in different populations and the scale’s correlations with other variables of interest, including well-being variables: anxiety, depression, and happiness. Participants for Study 1 (n = 848) were university faculty and students, as well as non-academic adults, from Finland. Participants responded to a survey about critical social justice attitudes. Twenty one candidate items were devised for an initial item pool, on which factor analyses were conducted, resulting in a 10-item pilot version of critical social justice attitude scales (CSJAS). Participants for Study 2 were a nationwide sample (n = 5,030) aged 15–84 from Finland. Five new candidate items were introduced, of which two were included in the final, seven-item, version of CSJAS. The final CSJAS scale had high reliability (α = 0.87, ω = 0.88) and a good model fit (comparative fit index [CFI] = 0.99, TLI = 0.99, root mean square error of approximation [RMSEA] = 0.04, standardized root mean residual [SRMR] = 0.01, χ2 (14, 5024) = 132.8 (p < 0.001)) as well as convergent and divergent validity. Overall, the study sample rejected critical social justice propositions, with strong rejection from men. Women expressed more than twice as much support for the propositions (d = 1.20). In both studies, CSJAS was correlated with depression, anxiety, and (lack of) happiness, but not more so than being on the political left was. The critical social justice attitude scale was successfully constructed and validated. It had good reliability and model fit.
In line with open science standards, he released the dataset publicly. This was very fortunate because it allowed us to examine the relationship between political ideology and item level data for mental health in a large sample, and one from outside the Anglosphere. There are 2 samples: a university-related convenience sample of 848 people, and a general population sample of 5030 Finns. His political scale looks like this:

In addition, he included items to assess depression and anxiety symptoms, both of which are belong to the internalizing cluster (inward mental issues). This is important because using item-level data, one can examine measurement invariance, that is, test bias. It has frequently been asserted without evidence that leftists might only score lower on mental health measures because they are most honest, or more in tune with their feelings, seek out mental health care more (at the same level of mental health), or are more tolerant of mental illness (true). If so, this implies that measurement invariance should be found for the scales. Ideally, one would have a broad set of items covering various aspects of mental illness, both symptoms (self-report and therapist) as well as diagnoses. However, this is a good enough starting point. With Ed Dutton, we have just published a re-analysis of his data in the same journal:
- Dutton, E., & Kirkegaard, E. Do conservatives really have an advantage in mental health? An examination of measurement invariance. Scandinavian Journal of Psychology.
Many studies have found that conservatives show an advantage in mental health and happiness and various causes of this have been debated (e.g., religiousness, ideology, or genetics). However, not much attention has been given to examining whether this advantage is psychometrically real, or whether it is due to test bias. We analyzed data from two large Finnish surveys of adults (Ns = 848 and 4,978) from Lahtinen (2024), that measured general anxiety and depression symptoms, as well as a new wokeness scale. Using differential item functioning tests, we found no evidence for measurement bias in these scales. The correlation between index scores of wokeness and mental health (internalizing) was −0.36, which increased to −0.41 when measurement error was removed. The association between wokeness and anxiety (r = −0.33, adjusted r = 0.37) was stronger than wokeness and depression (r = 0.20, adjusted r = 0.22).
The second, general population sample only measured anxiety symptoms, not depression. But if we pool the scores on the internalizing factor using the overlapping items, we get this visual result:
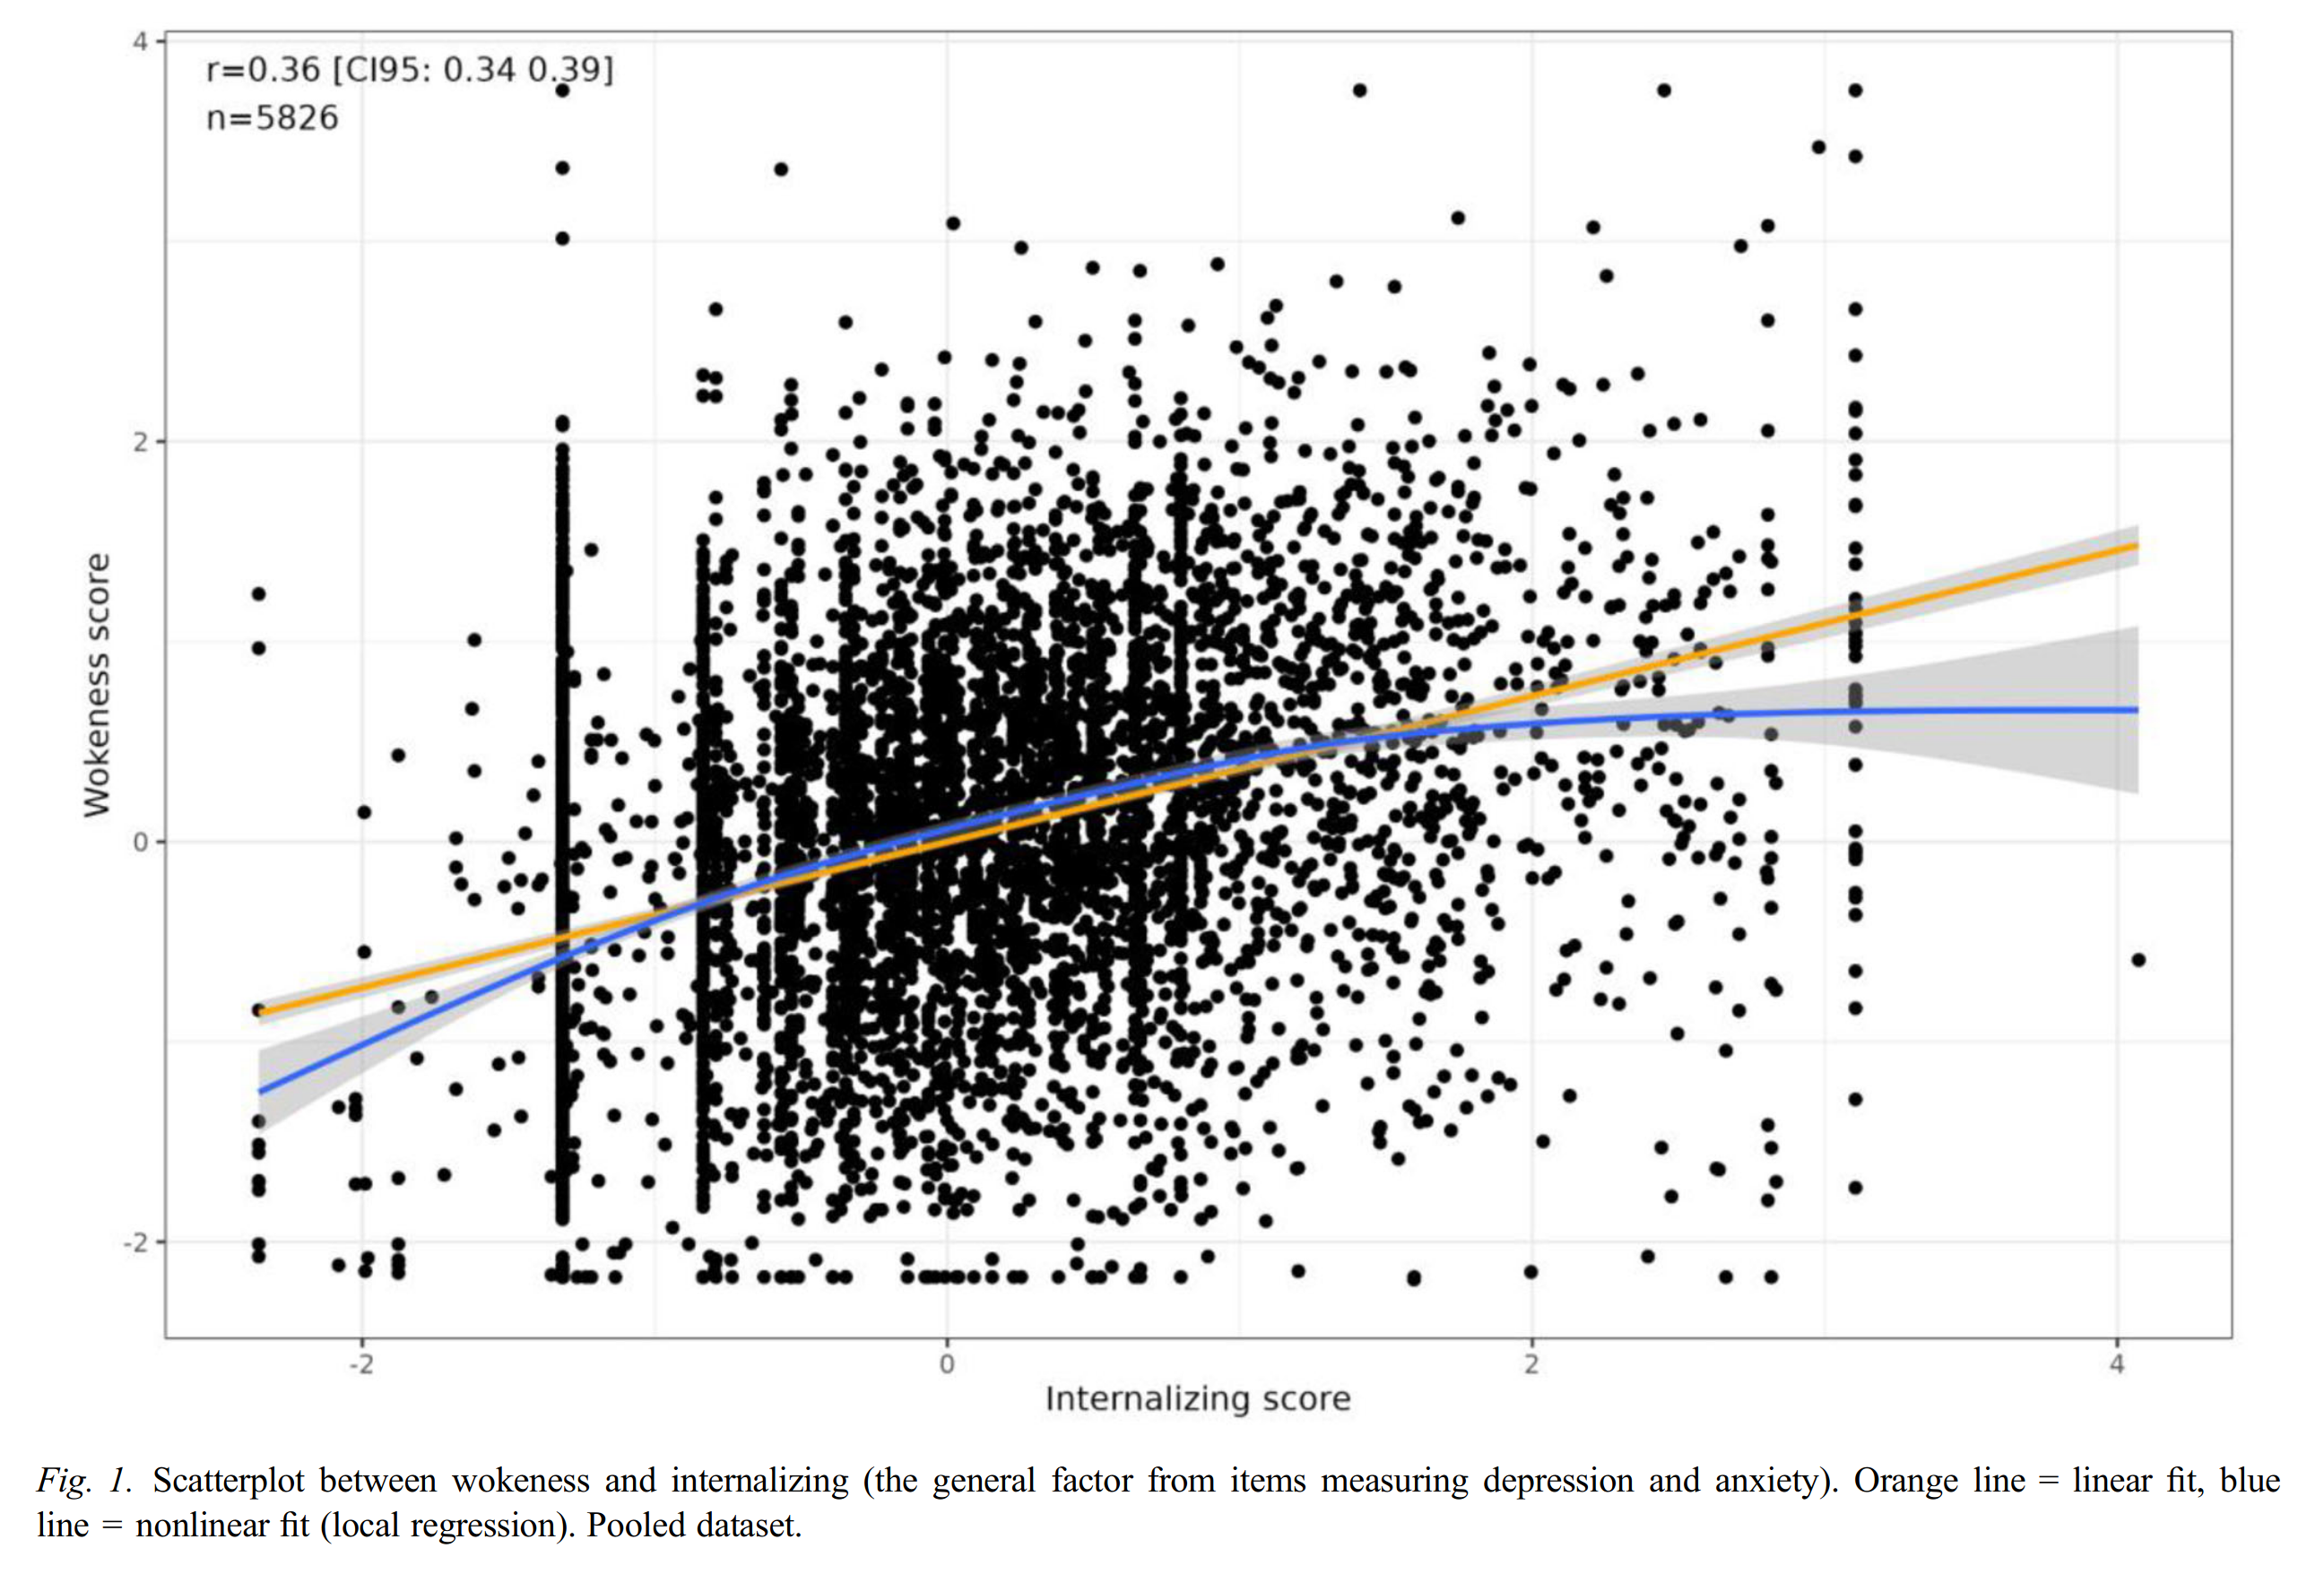
There is a tendency to nonlinearity, and it’s found in both samples and across scales (see paper for plots). I guess this might result from low quality subjects (inattentive, lizard people) having aberrant scores.
If we make a median split for politics, the gap sizes are appreciable and large enough to be easily noticeable from casual observation:

Notice especially that the relationship between political ideology and mental health is stronger for anxiety is than for depression, about twice as large: 0.25 d vs. 0.57 d. Differential item functioning (DIF) testing of the pooled item set found a small bias (0.12 d), but this turns out to be because of this difference in the strength of the relationship to the grouping variale, and disappears once the items are split into their respective pools.
For those wondering why the bias effect size doesn’t result in a correct sized gap (compare the pooled sample values), I think this is because the effect size calculation of the bias correction assumes no missing data, while in the combined dataset, most of the sample (5000 out of 5800) have missing data for depression. The missing items don’t contribute to the real scores, but do contribute to the simulated scores. Looking at the university sample only (complete data), the numbers are in order: the gap on internalizing overall is 0.43 d, with a ‘bias’ of 0.12 d. For the scales, they are 0.57 and 0.25. 0.57 – 0.12 is 0.45, close to 0.43. The items detected to be biased are in reality not biased, it’s because of the lack of modeling of the two dimensions of mental health in the data. One could have used a bifactor model here instead, but I have found that multi-dimensional item response theory models are difficult to get to work (you could try though).
Moreover, the relationship between political ideology and mental health cannot be explained by the other variables in the dataset:

Each of the turquoise dots and lines show the beta (regression coefficient) for each variable if it is used as the sole predictor of political ideology (singular regression, or correlations for numerical variables). The red dots and lines show the results from a full multiple regression model, that is, adjusted for all the other variables. Notice that the effect of woke_score (political ideology, leftism) does not change much. This means that causally speaking, these two variables are relatively close in the causal network, since their relationship could not be much diminished by holding all the other variables constant (mediators and confounders). Of course, one can posit hypothetical colliders here, which we can’t test for.
As shown on the plot, the dataset also has party vote. If we average both scores of interest for each party’s voters as a group, we get this plot:

At this level of aggregation, there is a near-perfect association between mental health and ideology. This is quite remarkable. A near-perfect linear correlation is not guaranteed by the individual-level correlation, but results because there are no other factors confounding the relationship to party choice.
To summarize:
- Mental health as assessed by self-report symptoms of depression and general anxiety was not biased by political ideology, contrary to earlier claims (cope).
- There was a pretty strong correlation between the two, adjusted for reliability it was r = .41. This is about the same correlation as between income and intelligence.
- Political parties in Finland showed the same pattern when the data were aggregated.