Months ago, we made a Slay the Spire 2 statistics portal, https://sts2.fun/. It has been collecting a decent amount of data, some 400k runs from 3000 players. For those not familiar, Slay the Spire 2 (STS2) is a roguelike turn-based deck builder. It’s pretty difficult and complex, which is the appeal. I understand if you don’t care about games or this game in particular, but nevertheless, there are some more general statistics lessons to be learned here. Based on this treasure trove of data (which you can download here), I’ve been doing some analyses. To win the game, you have to progress through 49 floors to beat the final boss at floor 49 (on maximum difficulty, which is the only real way to play). In general, things don’t always go so well. Here’s the survival chart by character:
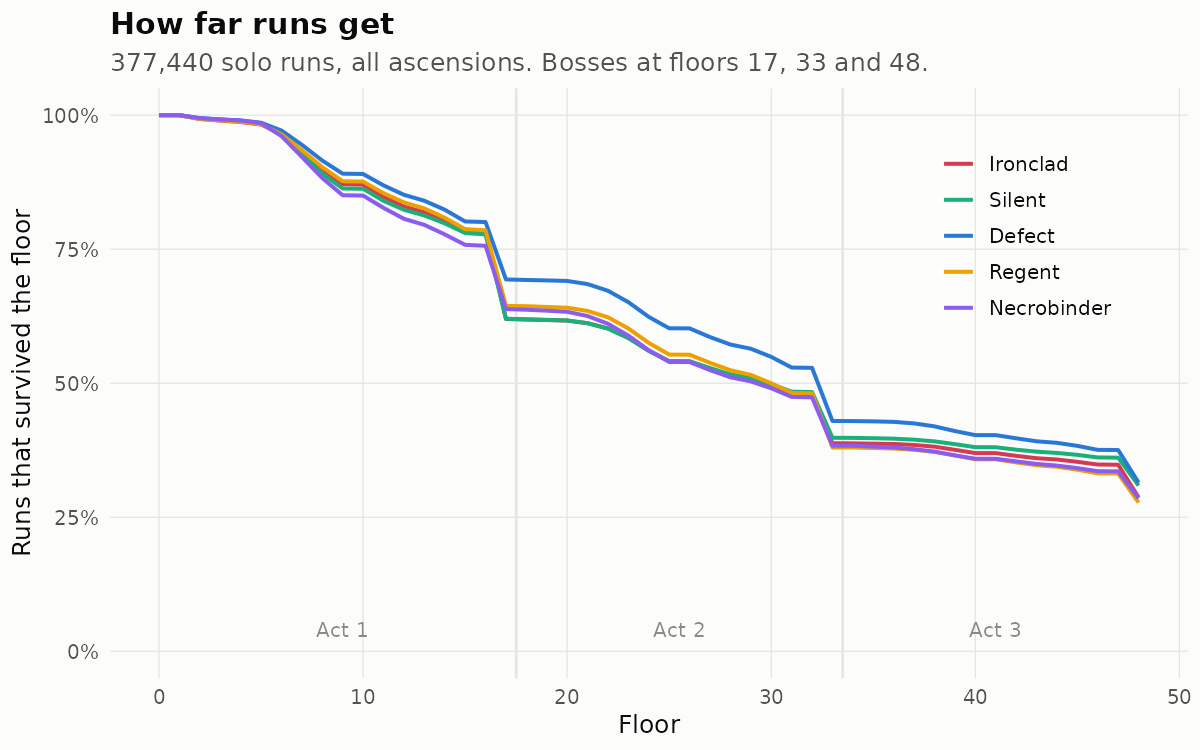
Thus, about 28% of runs result in victory, which also varies a bit by character (highest is 30% for Defect, lowest is 26% for Regent). When playing, you are wondering what is the best decision to make in a given situation. By utilizing a large number of games, it is possible to give some causal answers to some of those questions. Each run also has quite a lot of randomness, so it is possible to score a given run for luck. Some card options are better than others, some relics worse than others. The top players manage to win nearly 100% of their runs, but average Joe not so much. The top players have built tier lists, so we can compare those to empirically obtained results.
Relics
First off, there’s primarily 2 things to look at: cards and relics. Both can be obtained from combat rewards, shops (by choice and availability), and events. The goal is to predict which build — character+deck+relic combination — wins. Starting with the simpler of the two, relics, the most obvious approach is to check which particular relics are commonly found in winning vs. losing runs:
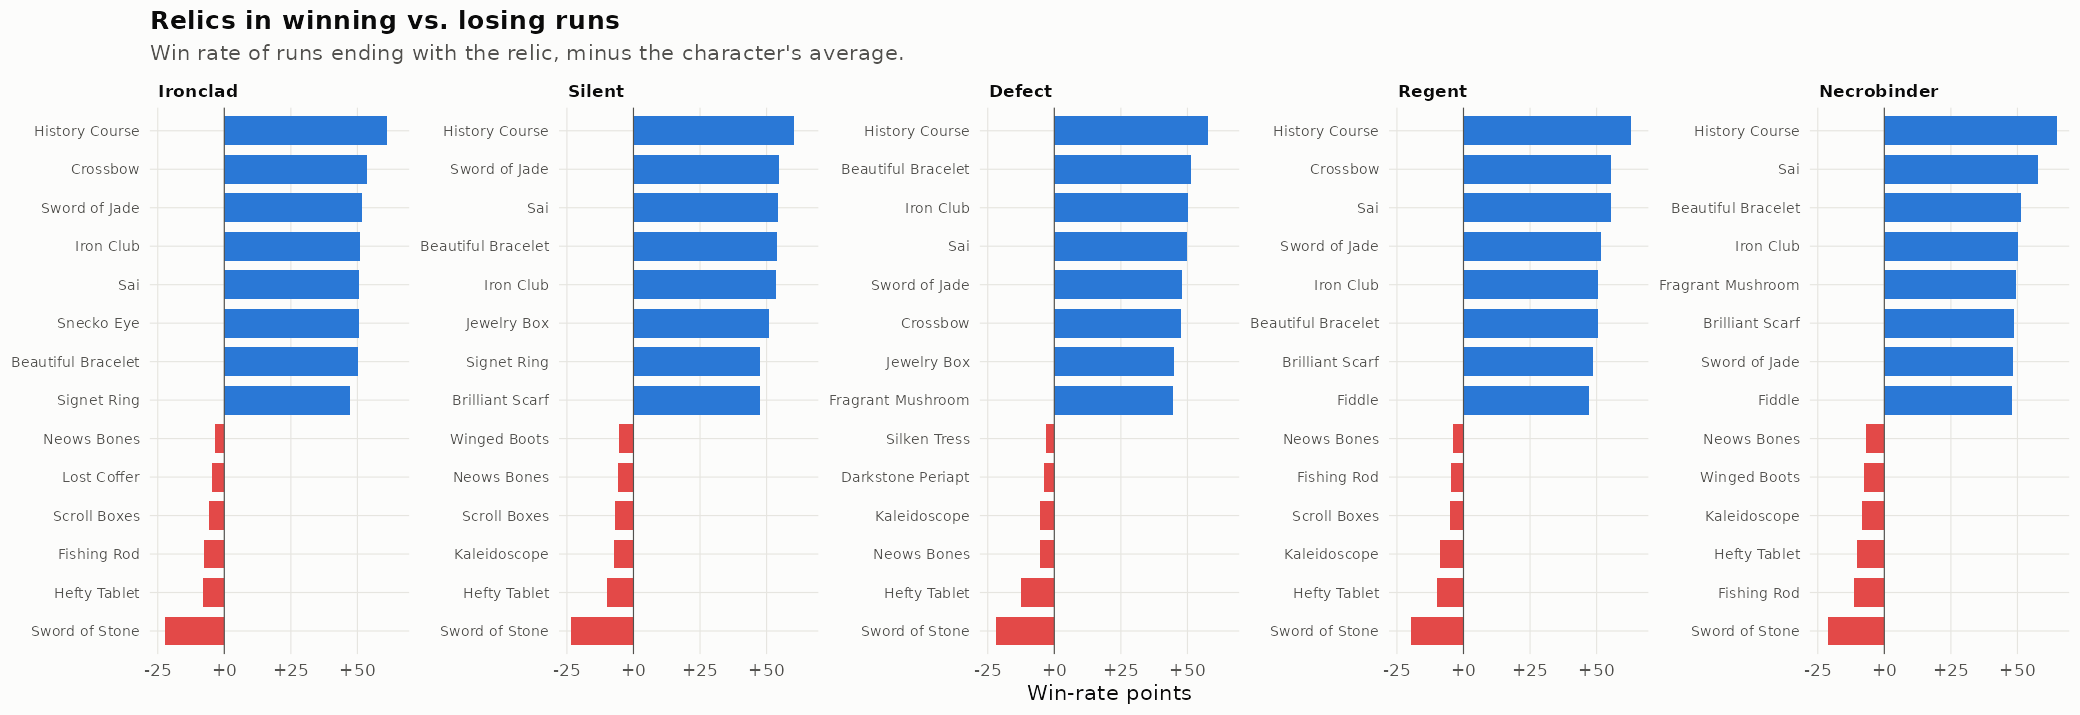
But you can probably see that it’s a biased approach. The issue is survivorship bias. Runs that lose will end up with fewer relics since they miss out on opportunities to get more of them later in the game. It can also clearly be seen in the transforming relic Sword of Stone, which becomes Sword of Jade when 5 elites have been killed. Losing runs commonly die before doing so while winning runs do so, thus giving the opposite effects of the pairs. One can also see the bias by just comparing the relic counts:
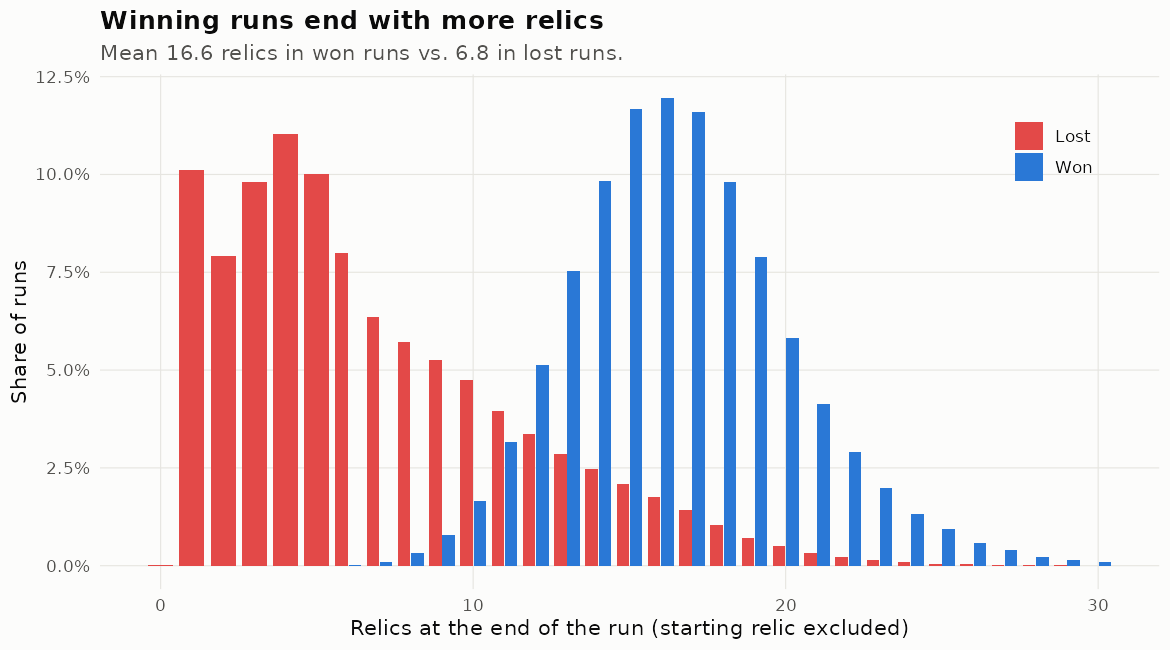
So this approach will not clearly tell us what we want to know but we can get more sophisticated. What if instead of looking at finished games, we look at them at some earlier point, say, after the first boss (floor 17). This limits us to the runs that made it that far (64%) while keeping their relic variation and predicting the future from that point. This probably works reasonably well. Given the amount of data we have, we can also fit a single logistic regression with every relic in the game and by character:
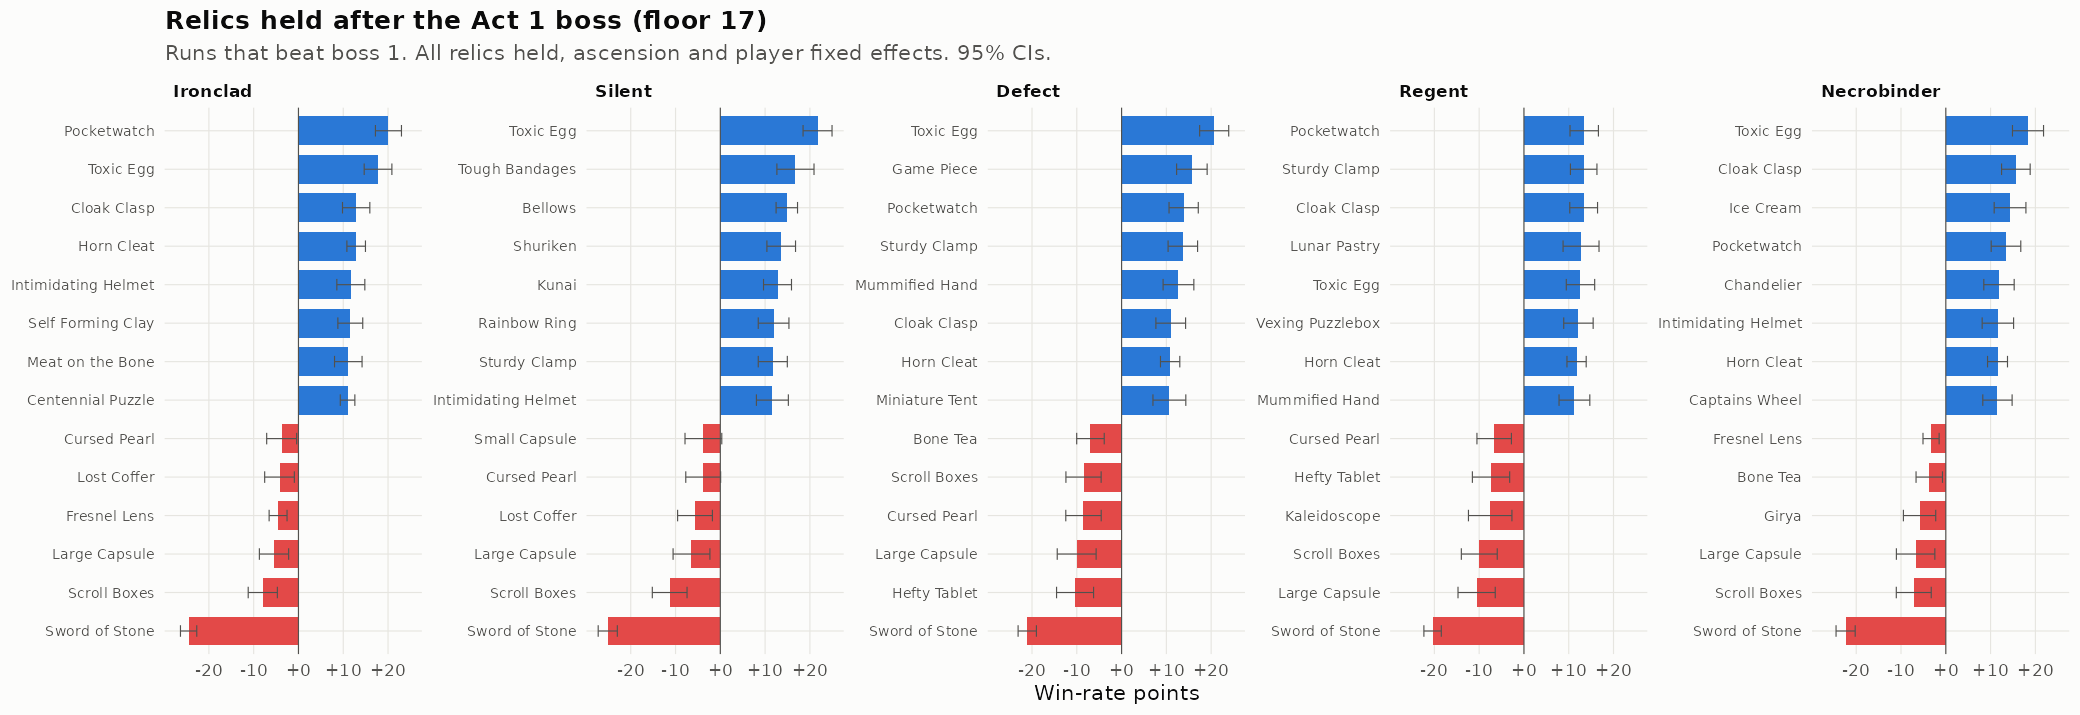
We see some expected results. Skills are generally too strong in the game, and the relic that makes any acquired skill upgraded is a top relic for every character (Toxic Egg). And for a replication of sorts, we can do the same thing at another point, say, after boss 2 (floor 33):
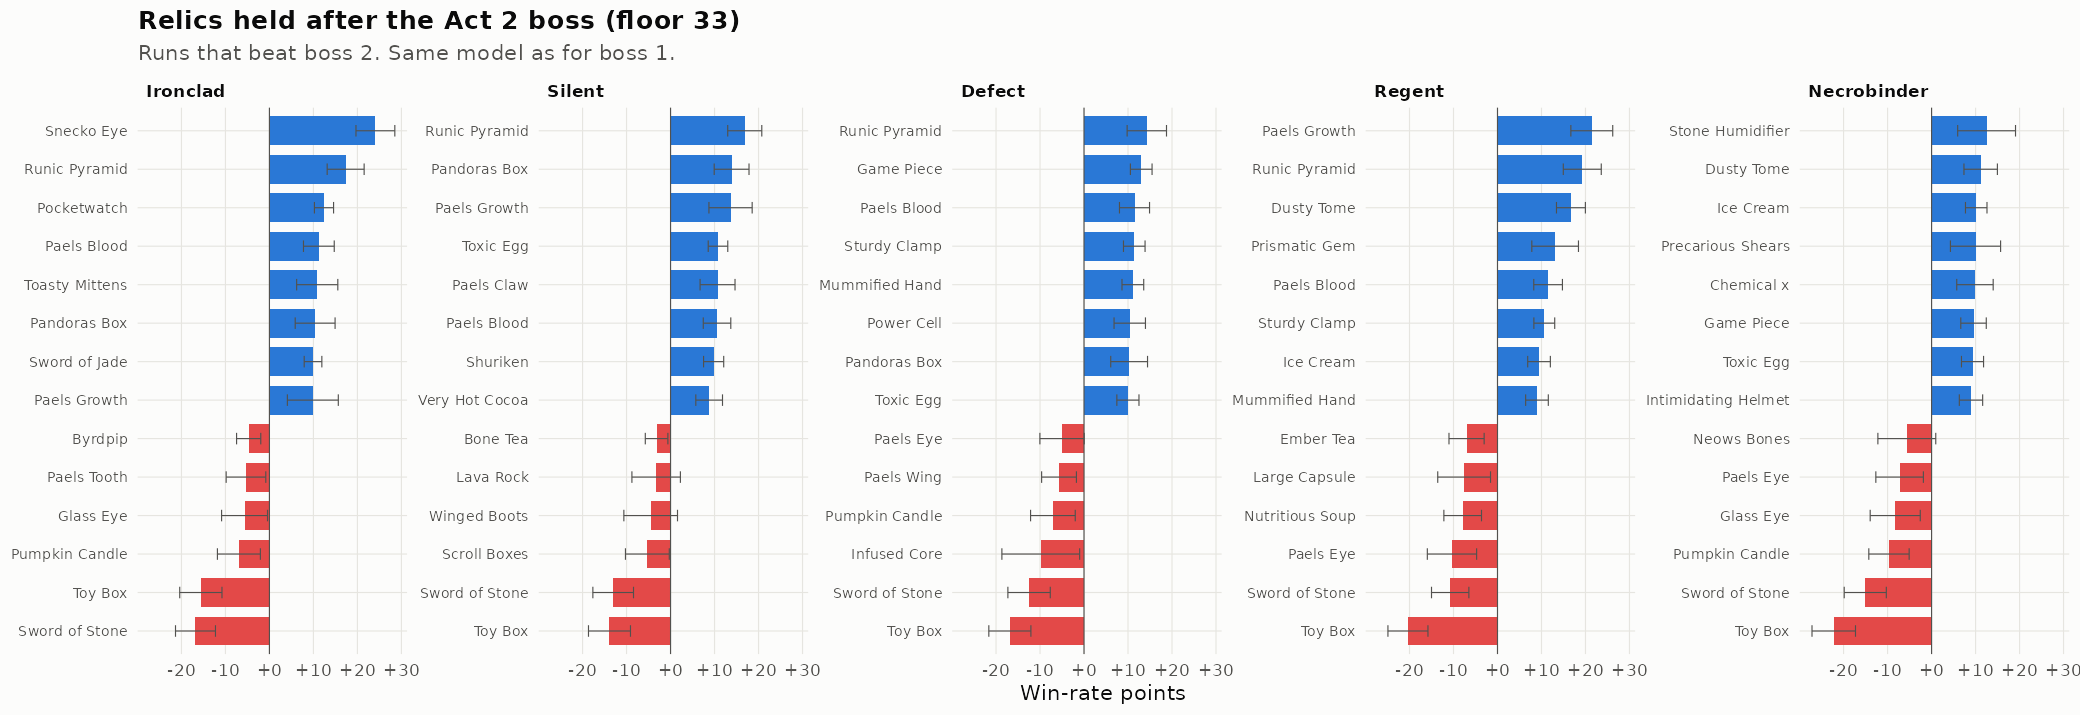
The models additionally controlled for the difficulty (ascension) and player (fixed effect). Still, the models don’t guarantee a causal result because relics already picked up until that point affected the outcome. Some choice remains, and thus the possibility of confounding. Fortunately, we have some other options available. There are a number of different things that happen in the game that assigns a random relic to the player, which is thus uncorrelated with anything. Using this variation, we can see clearly. Random relics come from starting relics (Neow), elite rewards, chests, and some events. Each of these can be used to figure out the causal effect of each relic. The estimates they produce should agree with each other perfectly, random sampling error aside, and they seem to do so:
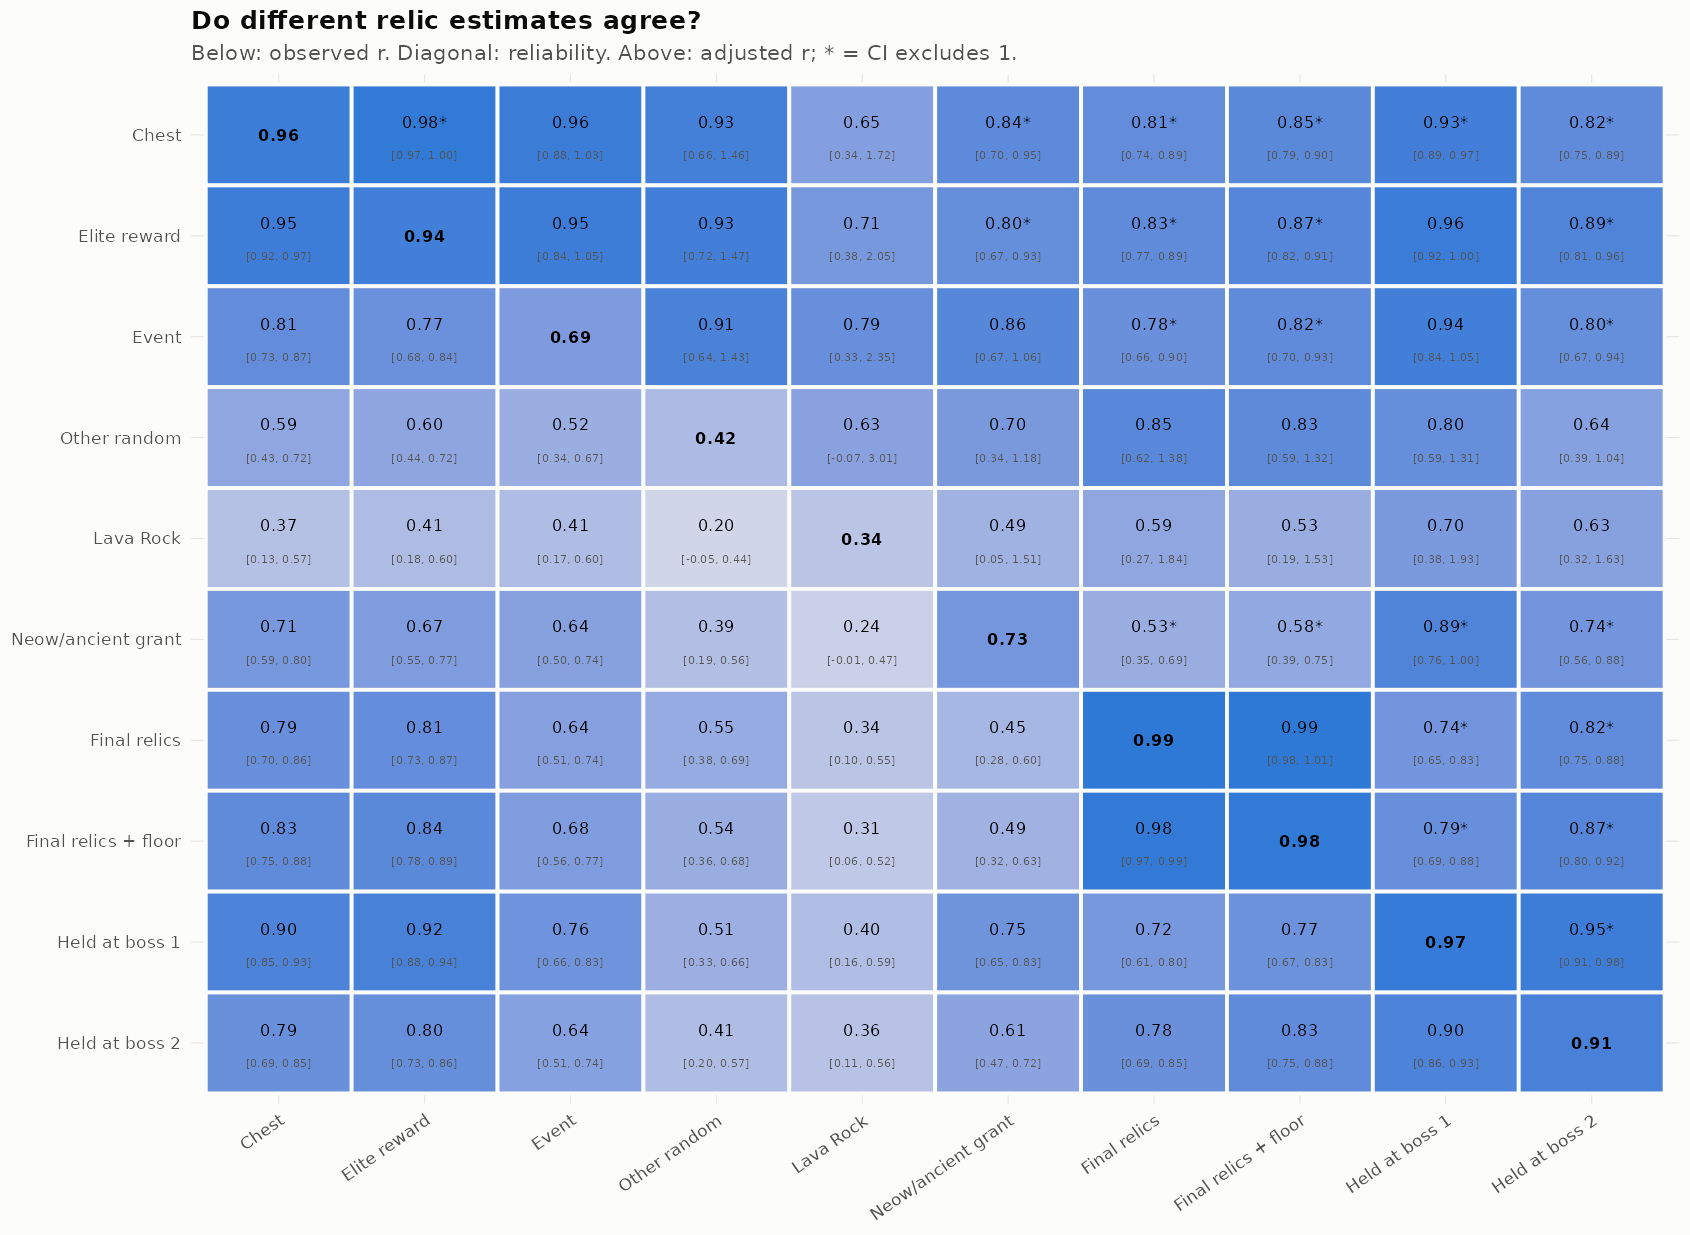
Here we see that the random relic models agree with each other relatively close to perfectly, while the cross-sectional data models even with controls are a little off. For some strange reason, Lava Rock random relics do not agree much with the rest. Based on these results, we can meta-analyze the signal from the different approaches to get a single best estimate for each relic x character combination:
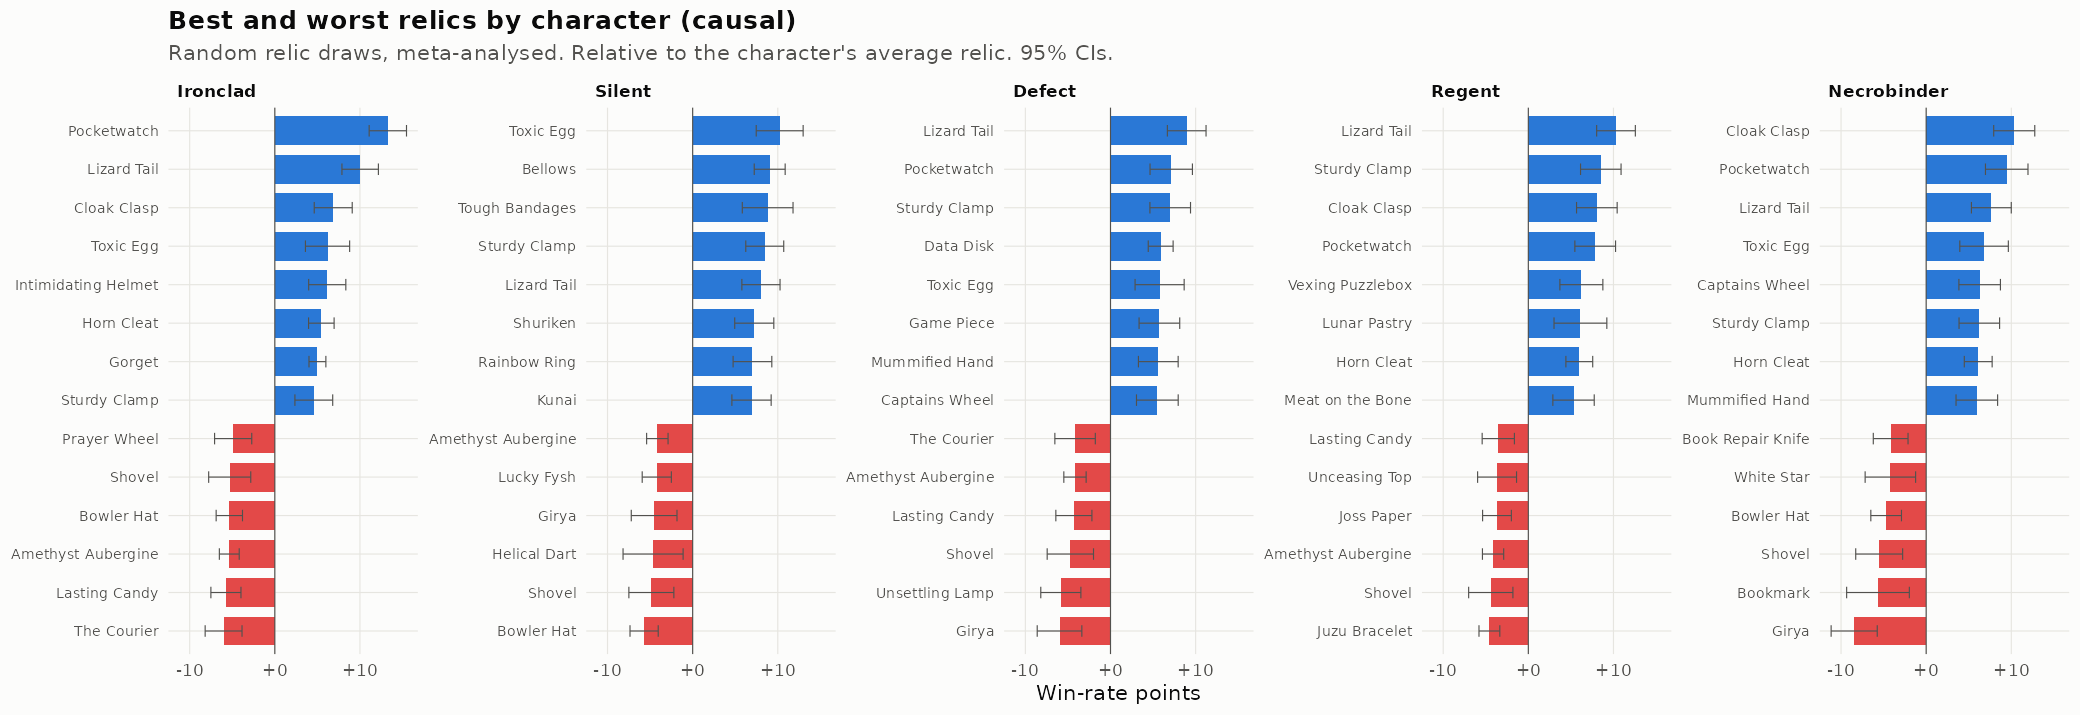
Of particular interest are the boss/ancient relics, which are given after killing a boss. A particular ancient is shown and offers some relics in a limited pool. These can be relatively precisely estimated using the instrumental variables approach. Relics can only affect your winning chances if you are actually offered them, so we get the following causal path: offered -> picked -> win. The picking rates are affected by players’ choice based on their guesses about which relic gives the best winning chances, so it is not a clean causal estimate. However, the offers are random, so they allow us to get around this. This gives us the following results (pooled across characters):
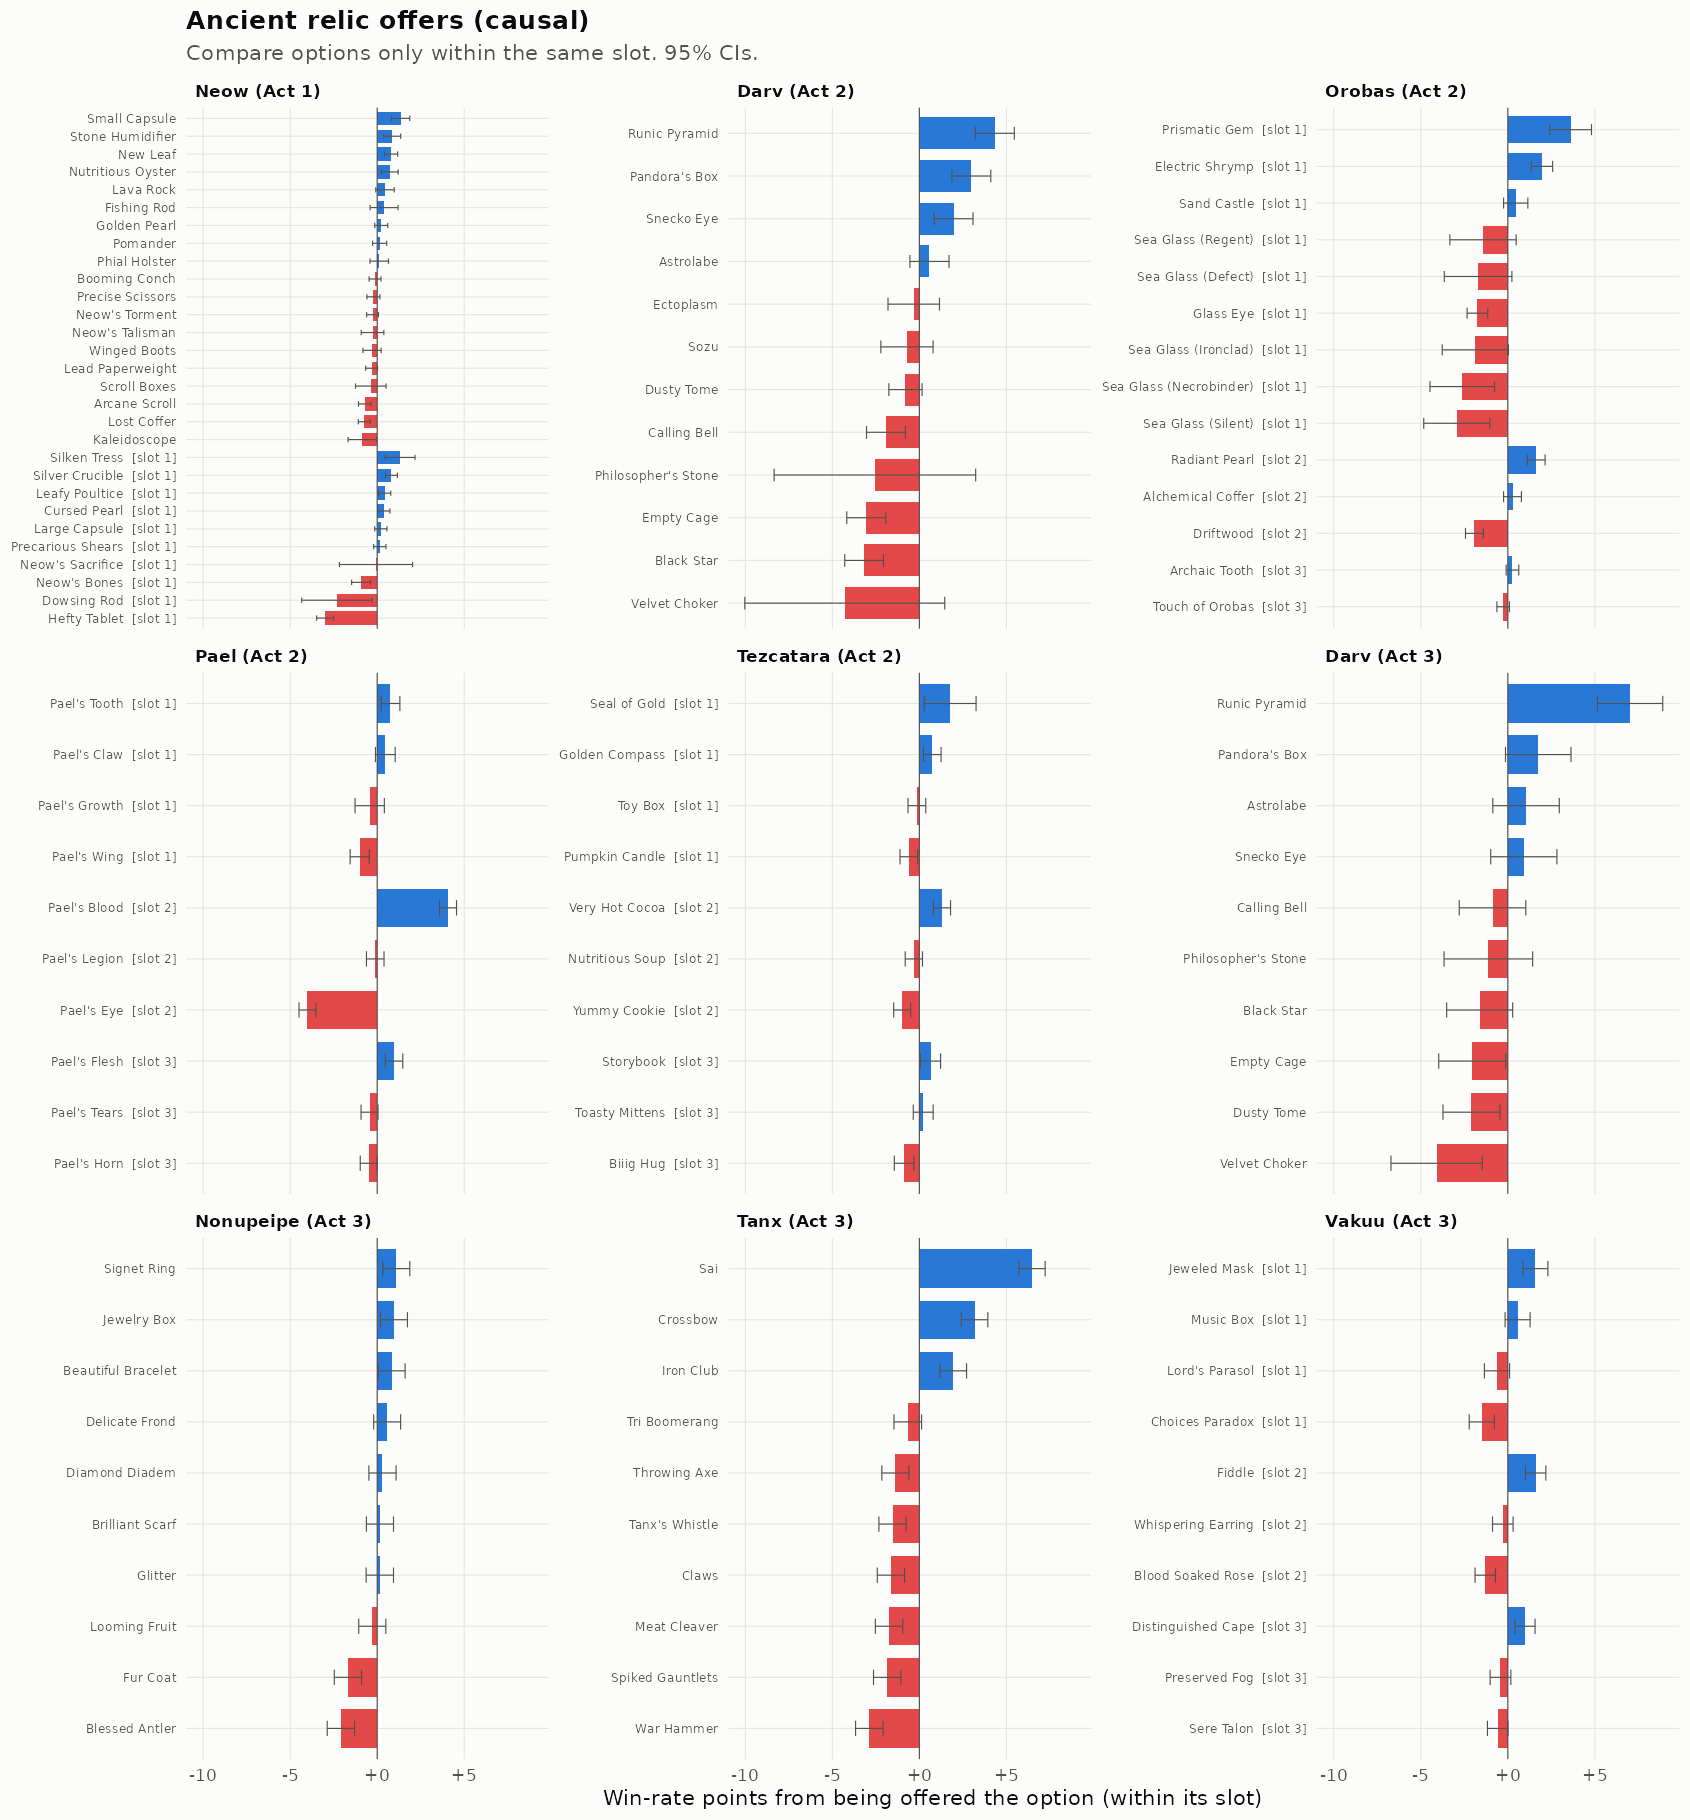
It is likely that these differ by character but even 400k games is not actually enough to precisely estimate it, believe it or not. That’s because the outcome is a binary, and we need a standard error of, say, 2%points. This requires about 26,000 games with that character, but we have around 49,000 (for act 2) and 30,000 (for act 3), which are further split by the ancients appearing. More data is actually needed.
To be noted, shop-only relics are difficult to estimate. The only method I can think of is using the randomization from Lord’s Parasol (which gives every relic in shops). However, there weren’t enough runs to precisely estimate these.
Furthermore, some of the ancient relic options are not independent:
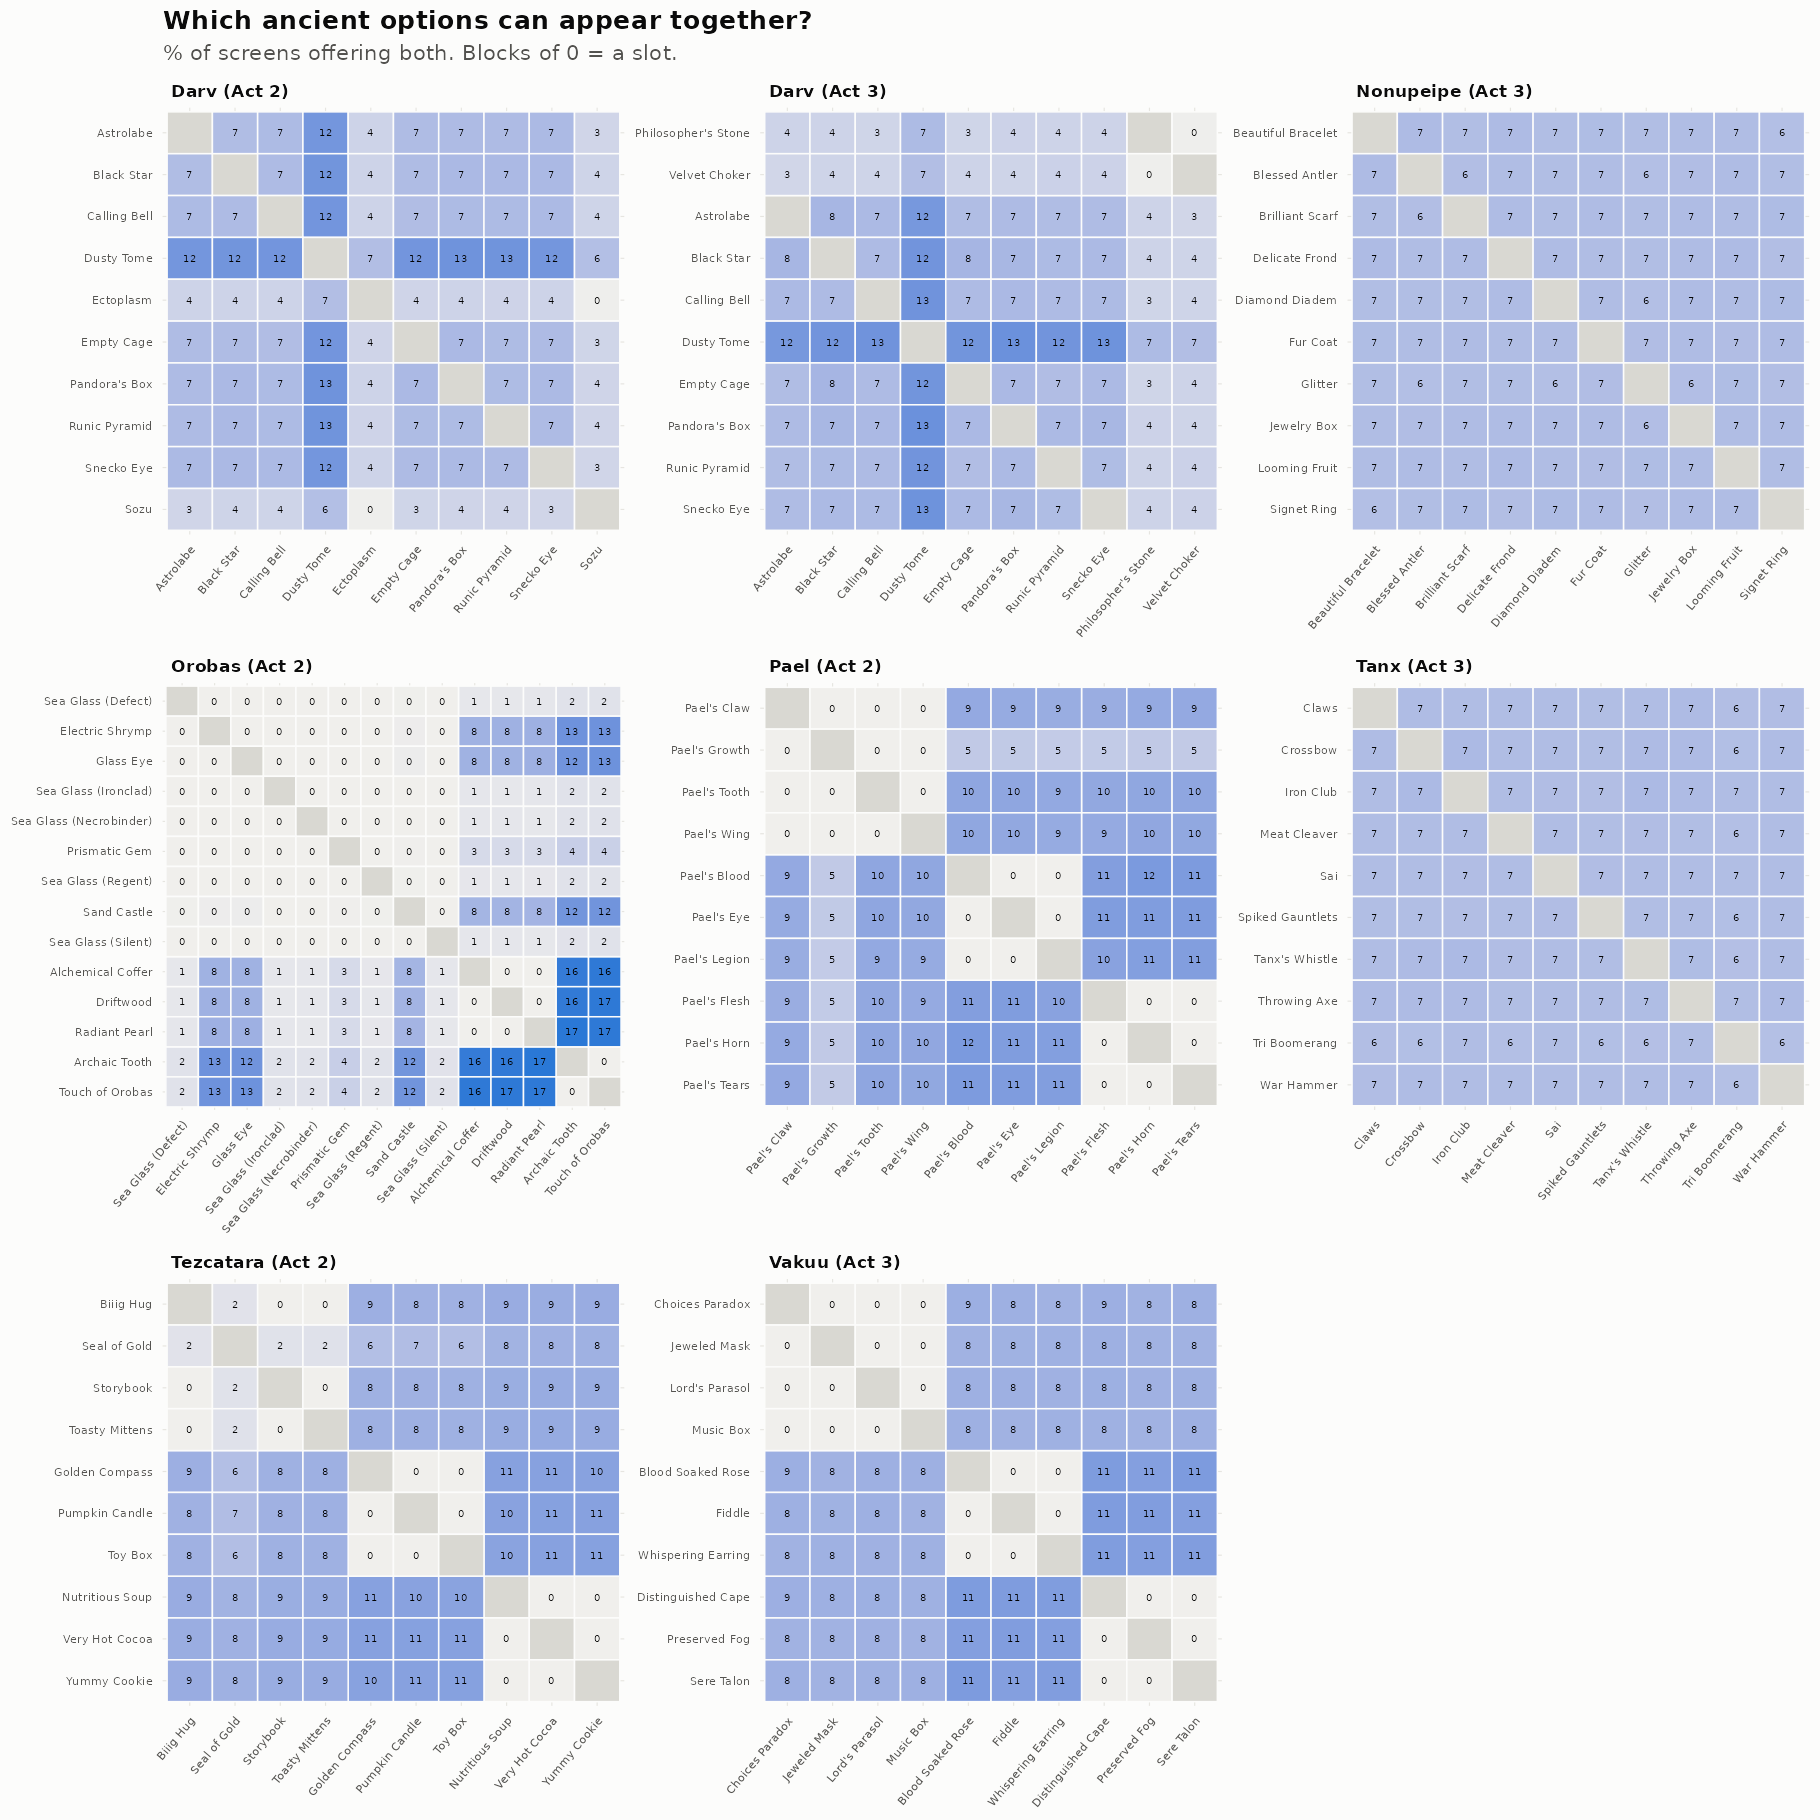
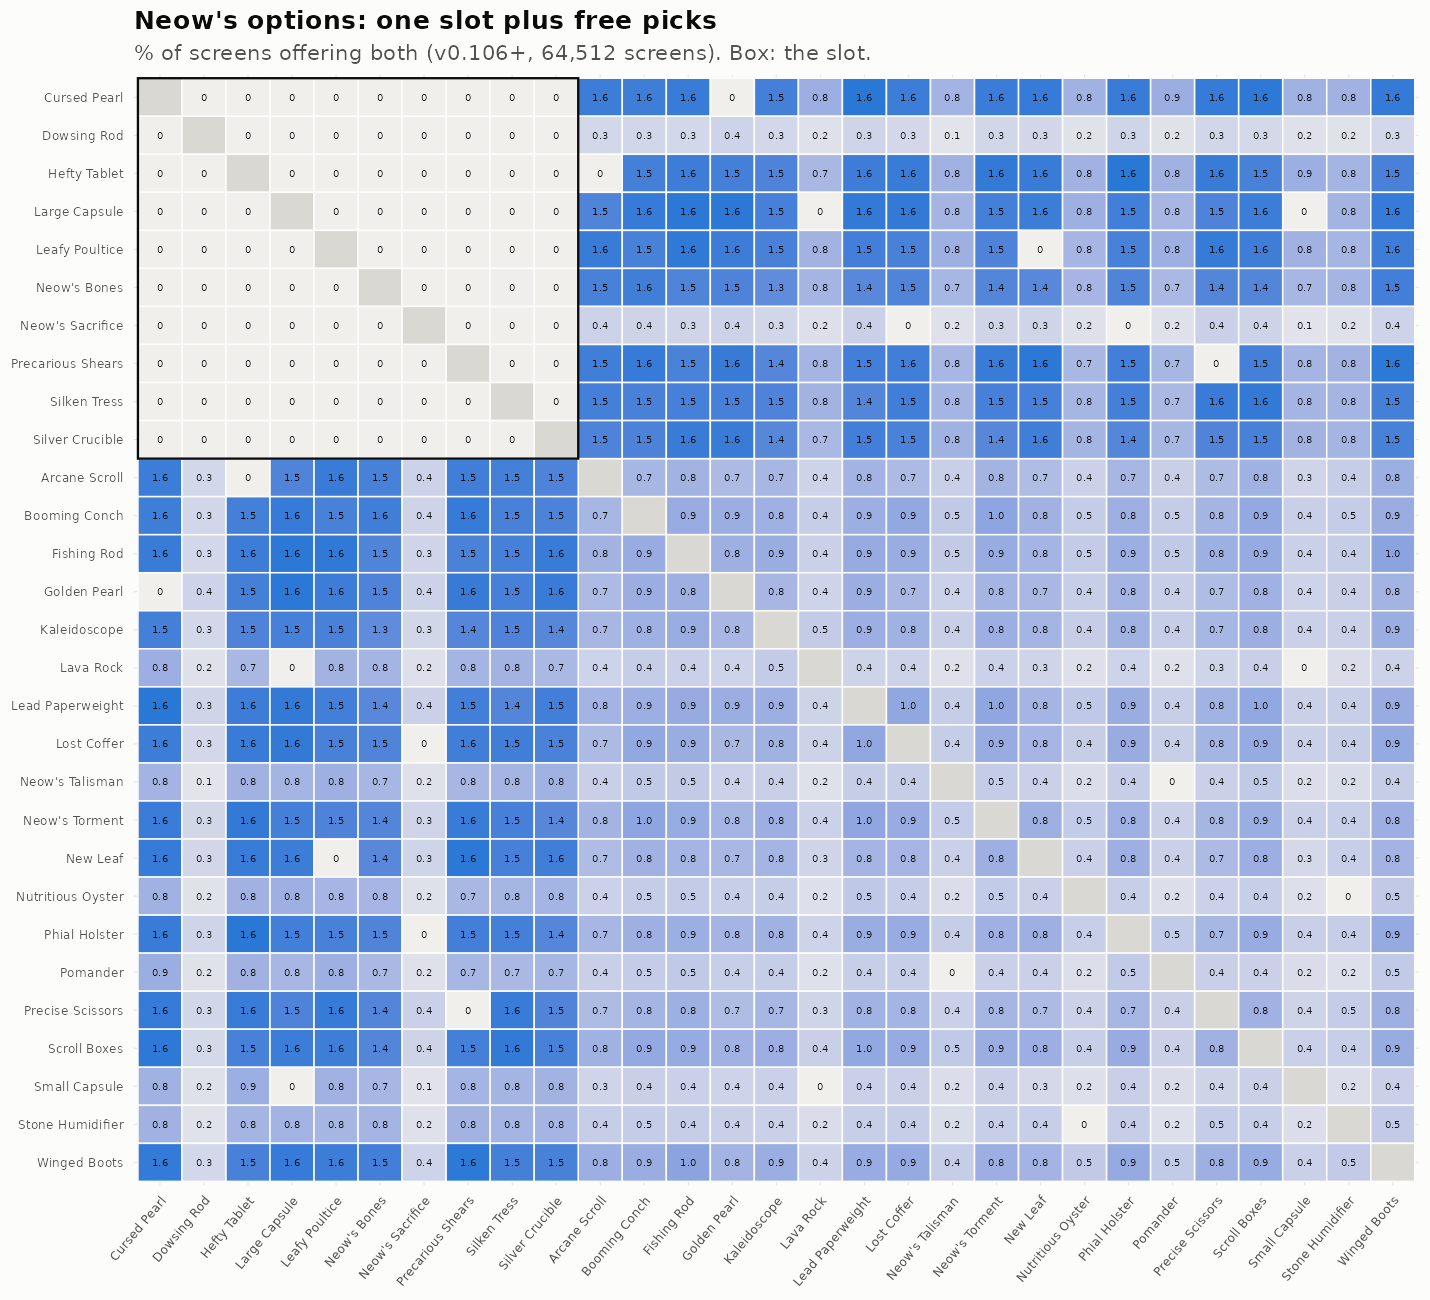
Thus, these present issues with estimation as there is never a choice, for instance, between X and X.
Cards
Moving on to cards, we can do the same thing as before. We can try the simplest model of comparing cards found in winning vs. losing runs. It gets more difficult here because decks can have multiple copies of a card, and they can be upgraded or not. I’ve decided to merge the data for the regular and upgraded cards to boost precision at some loss of detail. With enough data, one could separate the two, and figure out which cards are most important to upgrade. With regards to the counts, I’ve tried binary, count, and capped count approaches (deck has card yes/no, deck has X copies, deck has 0,1,2,3+ copies). The capped counts work best. The issue with the full count is that the rare boss/ancient relic Pael’s Growth makes it possible to clone cards, so a few decks end up with literally thousands of copies of some cards which mess up the results (meme builds). Anyway, these are the simplest results:
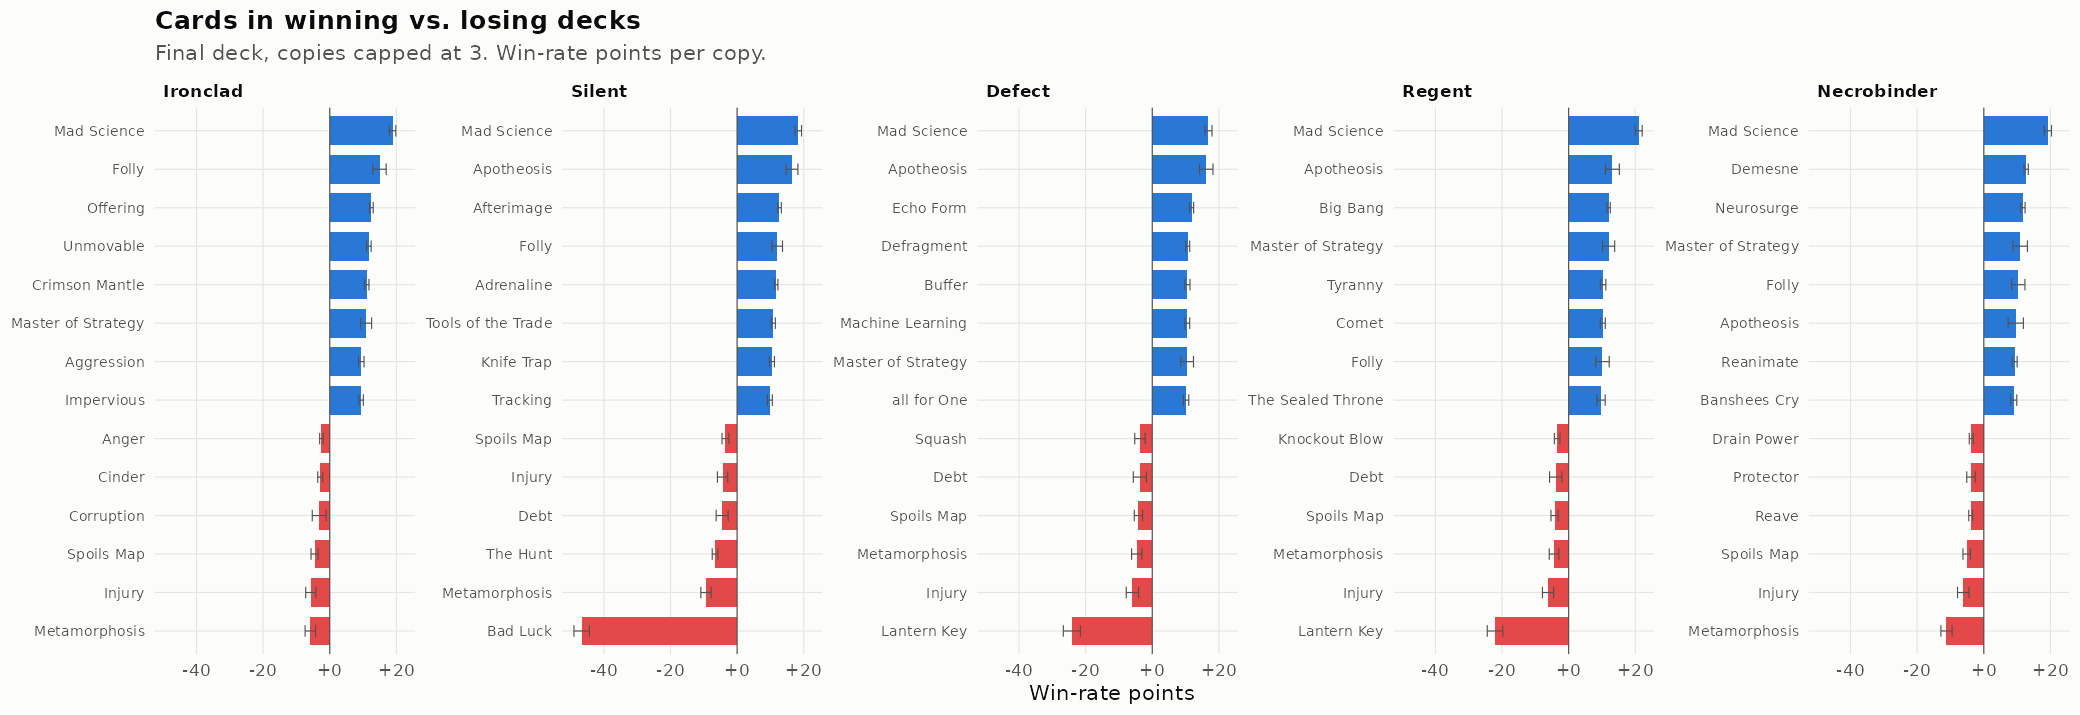
We can note a limitation of the data here, Mad Science is actually 9 different cards, but the save files don’t note which one is which. Most of the very bad cards are actually curses or quest cards (Lantern Key). We can also move on to post-beating boss 1 decks to avoid most of the survivorship bias:
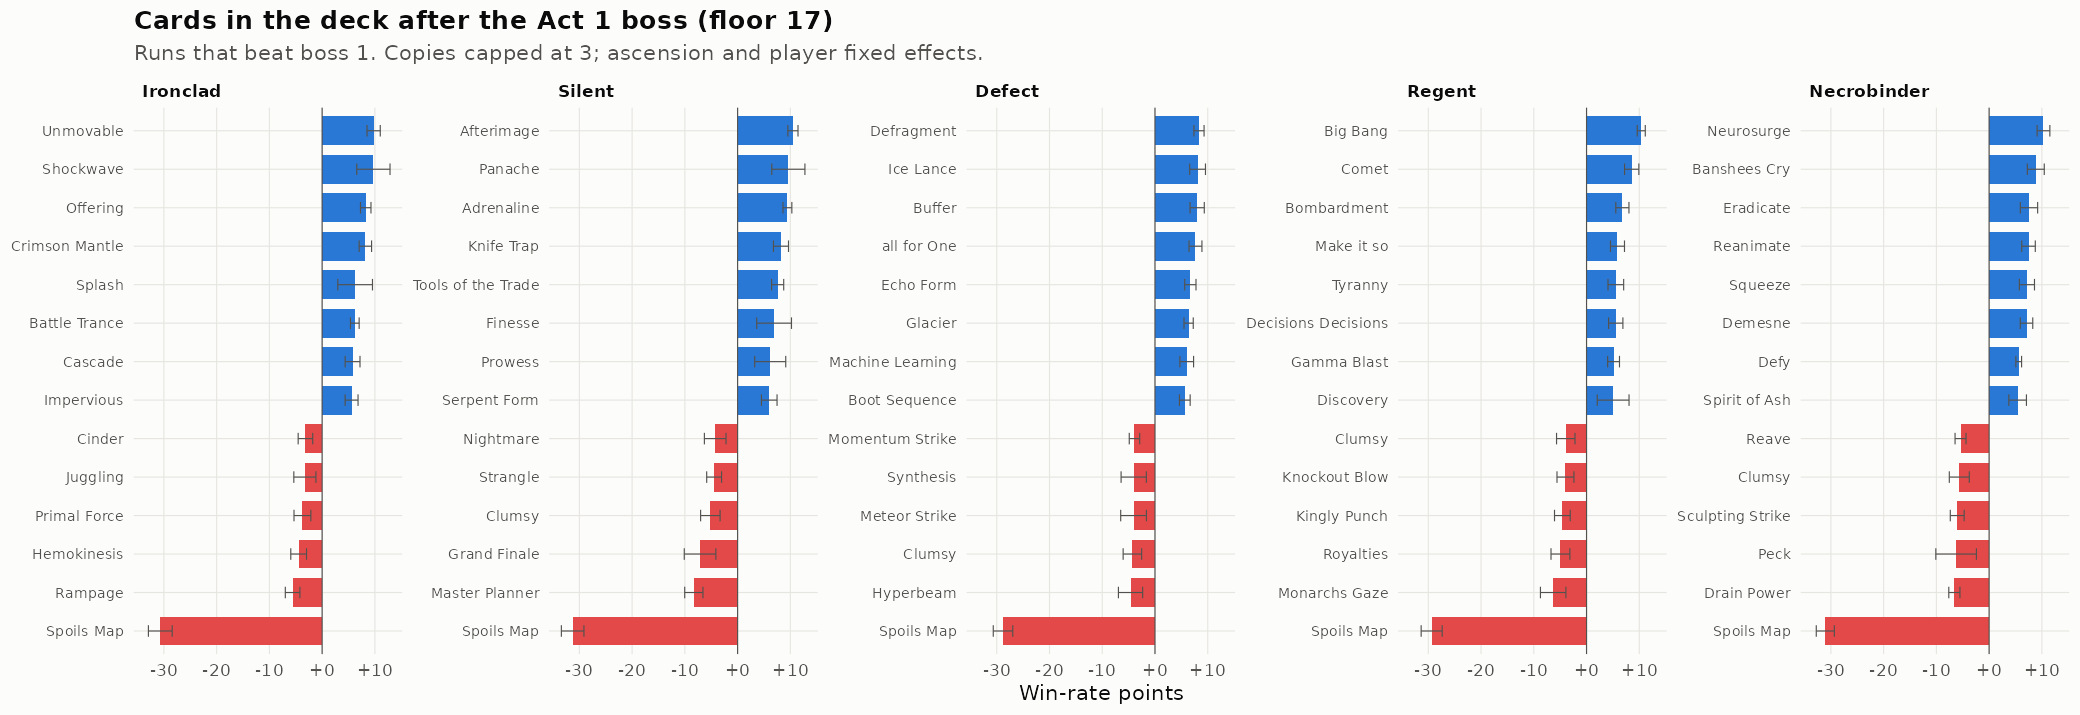
It seems taking the Spoils Map is generally overly greedy, which is presumably why you often see the pros skipping it.
These estimates are still not entirely unconfounded, but we can utilize the final approach, which is to use instrumental variables for card rewards. Since cards can only affect your winning chances if you actually picked them, we get the following causal path: offered -> picked -> win. This allows the use of instrumental variables to estimate the causal effects despite players having a choice in what to pick. The correlation matrix for the card estimates across methods:
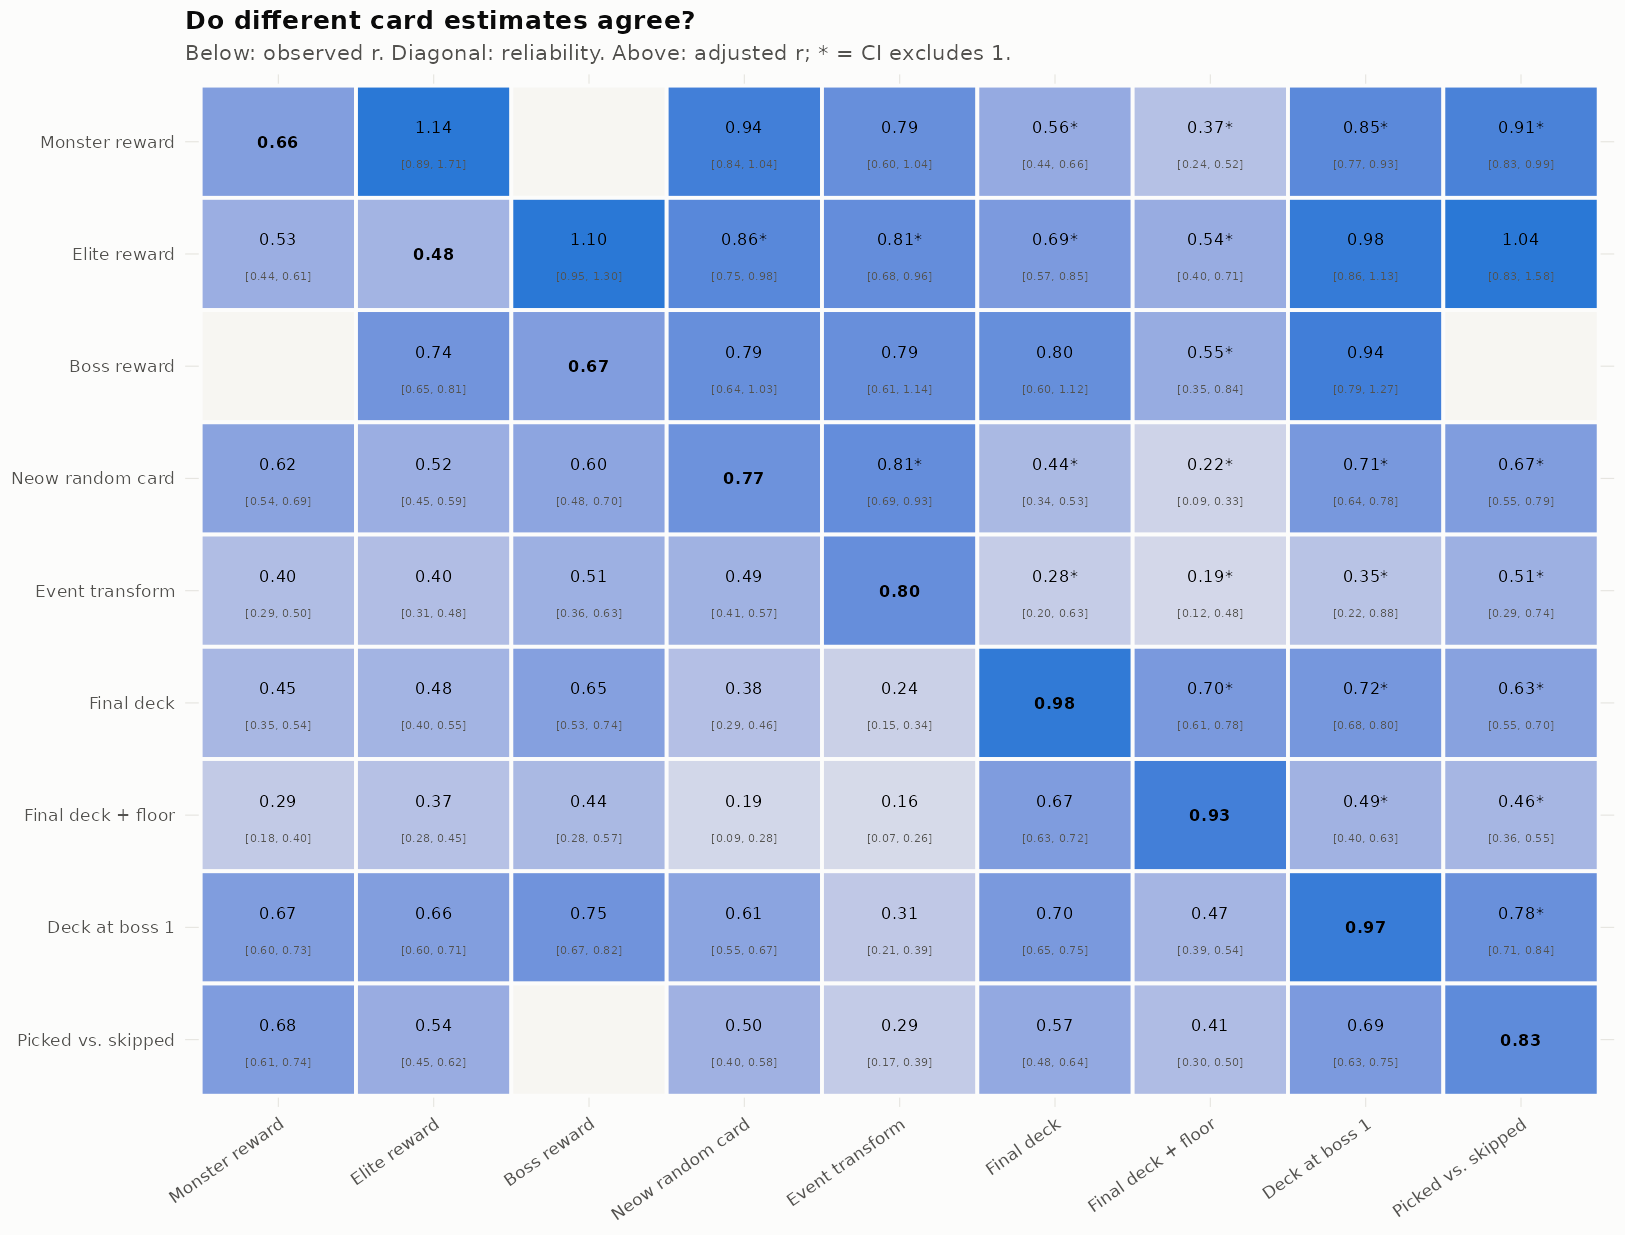
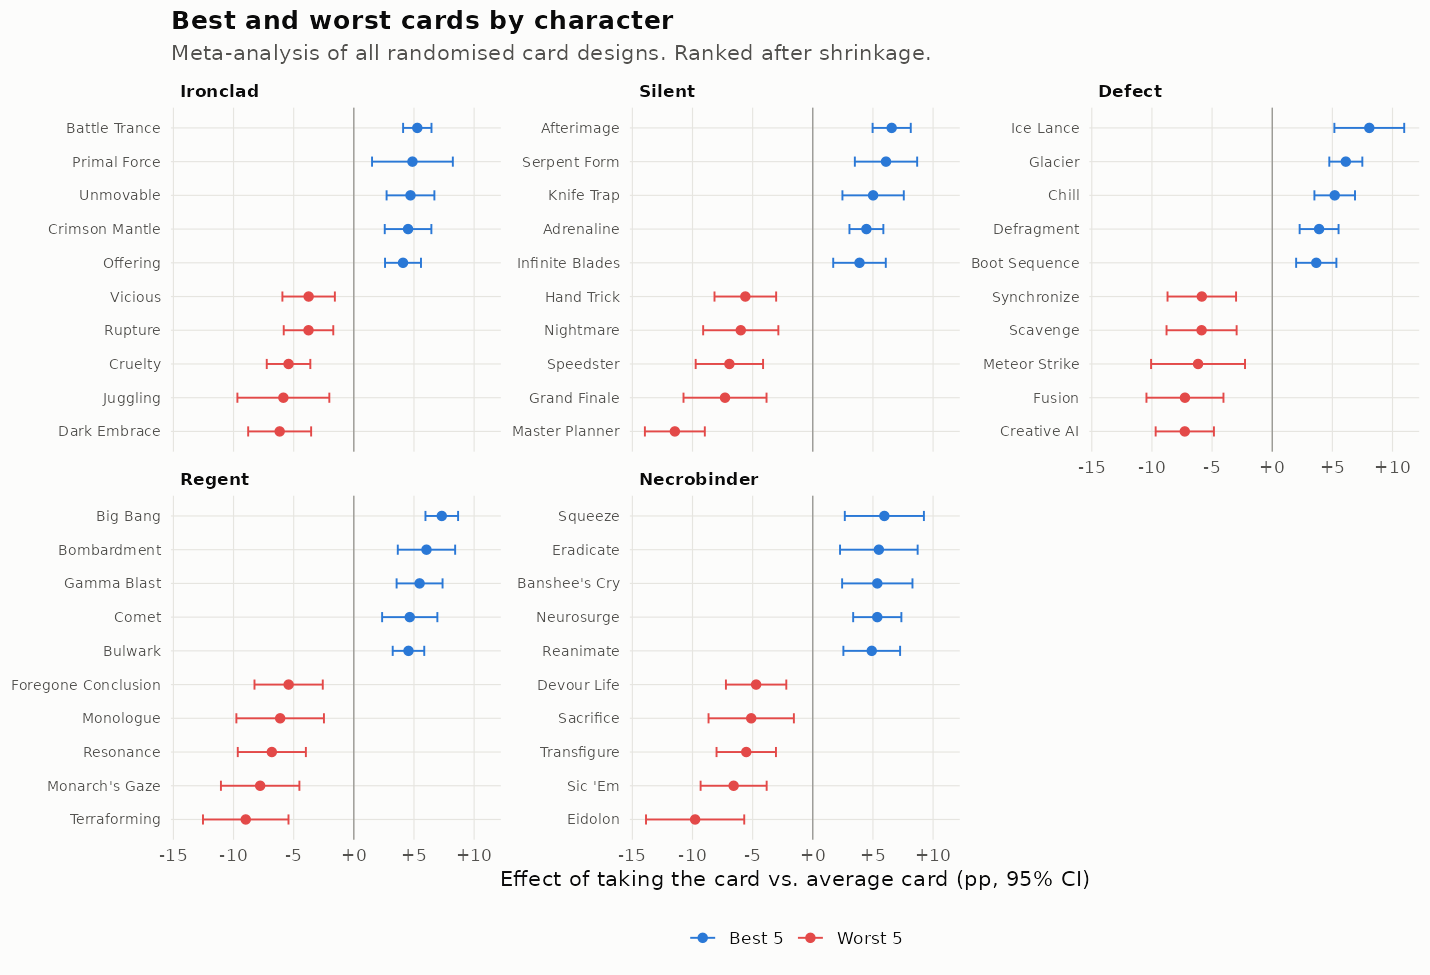
Aggregating the randomization-based estimations into a single best estimate, we can figure out that these are the best and worst cards for the characters:
Player choices
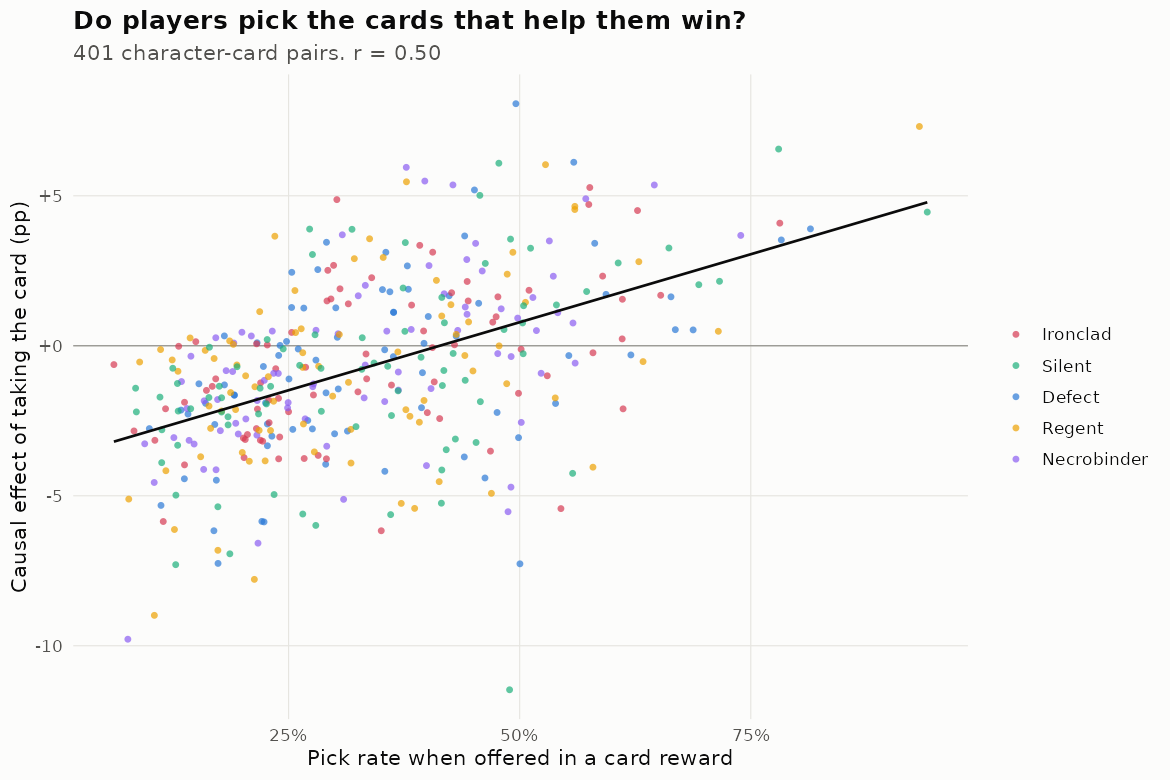
We have lots of data on what people actually pick in the game when given a choice. Usually, from a fight reward, 3 cards are offered but only 1 can be picked. So it is possible to rank cards by players’ preference. The simplest metric is just picked/offered ratio. More sophisticated is using 3+1 variant of the Elo rating. It turns out these produce about the same result, so it is not worth much except to highlight the value of skipping later in the game (the smaller your deck is, the more likely you will draw your best cards). Thus, we can compare players’ preference with our best estimates of what is best:
Relics are generally acquired randomly, so there is not much choice to look at. Except for shops and ancients where players choose themselves. So do players tend to buy the best relics?
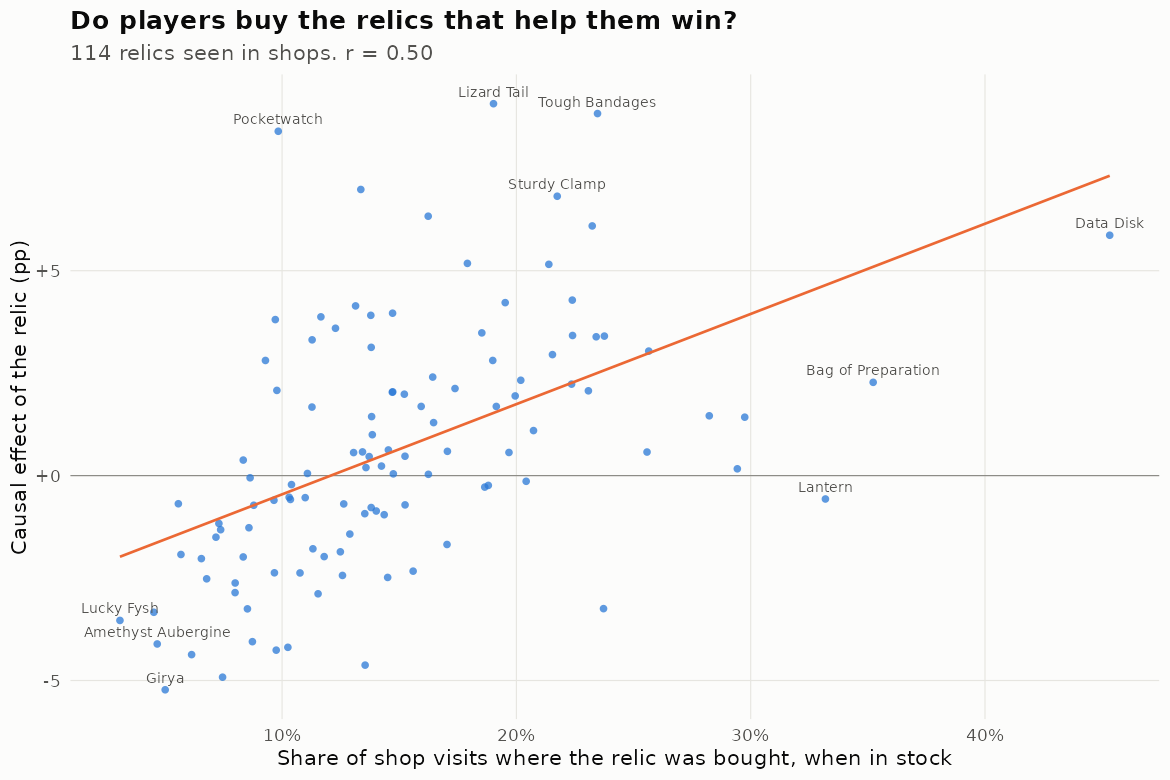
It would appear overall players are fairly rational or tuned in to what is good. But critically, does it relate to player skill levels? We expect that the better players would buy the better cards and relics. To do this analysis, we have to estimate player skill. The model is: win ~ player_id + ordinal(ascension) + character. Using these, we can plot the buy rates vs. causal estimates as a function of player skill:
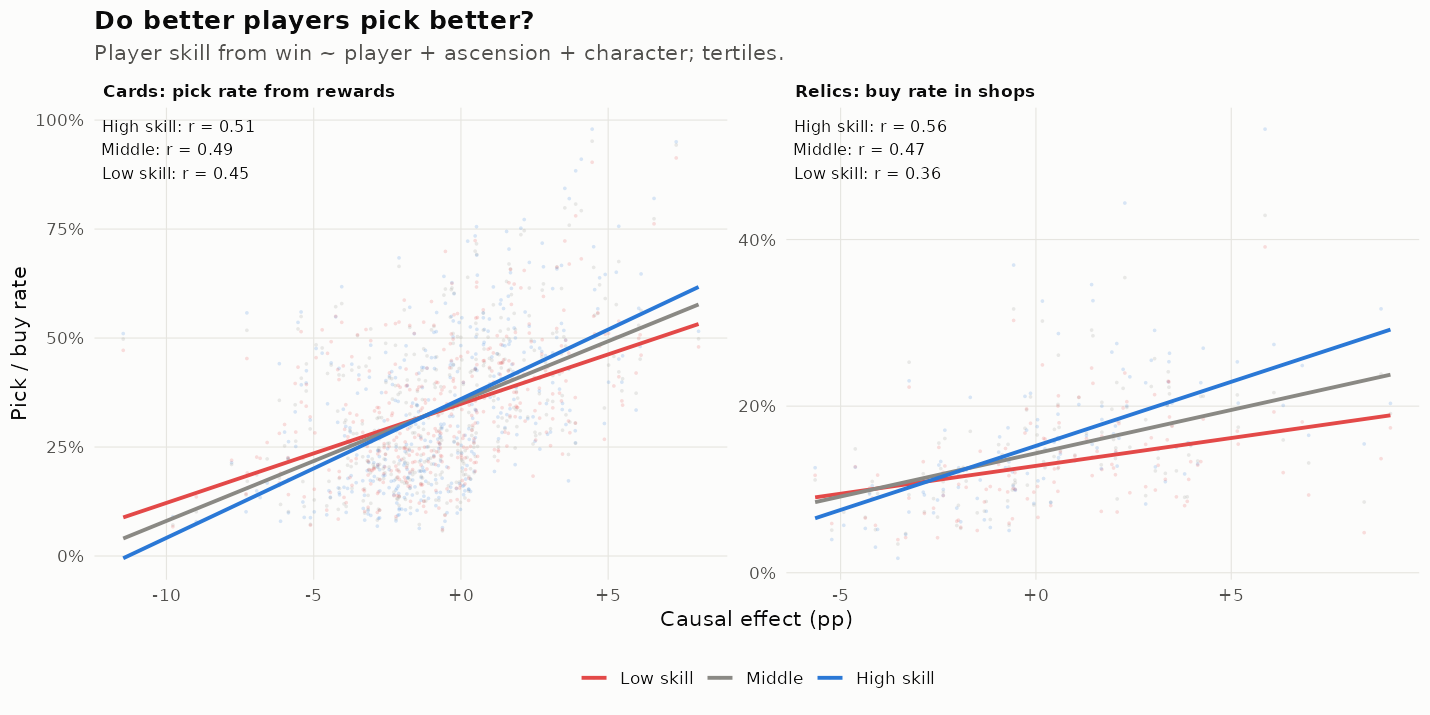
The findings confirm the expectation, higher skilled players’ choices correlate more with our best estimates 0.56 for high skill vs. 0.36 for low skill in case of relics. The difference is much smaller for cards, suggesting that the main separation between the good and the bad players is knowing what relics to buy in shops.
Conditional effects
The main issue with the above is that what is best for a build to some extent depends on what you already have. Some cards are good in all builds, while others are bad in some builds and good in others. The same for relics, though they are usually never bad for you (giving only positive effects, some exceptions like Royal Poison or Brimstone). Statistically speaking, such conditional effects are interactions, and we are not too keen on interactions on this blog. Still, there are surely lots of real interactions here, given that the very purpose of the game is to know about these and use them skillfully to win. There is, however, a severe statistical issue. With about 83 distinct cards per character, there are 3,403 different 2-way interactions to model for an exhaustive search (for a total of 17,015). Even limiting ourselves to within character combinations (it is possible to obtain cards from other characters as well as colorless/neutral cards), the combinatorial explosion results in severe statistical penalties for finding them. So we have to use a bit of theory or other empirical data to find them. Fortunately, we can use the winning builds data here. Each character has a number of primary build types, or archetypes. These can be statistically found by looking at the winning decks, in this case for Silent:
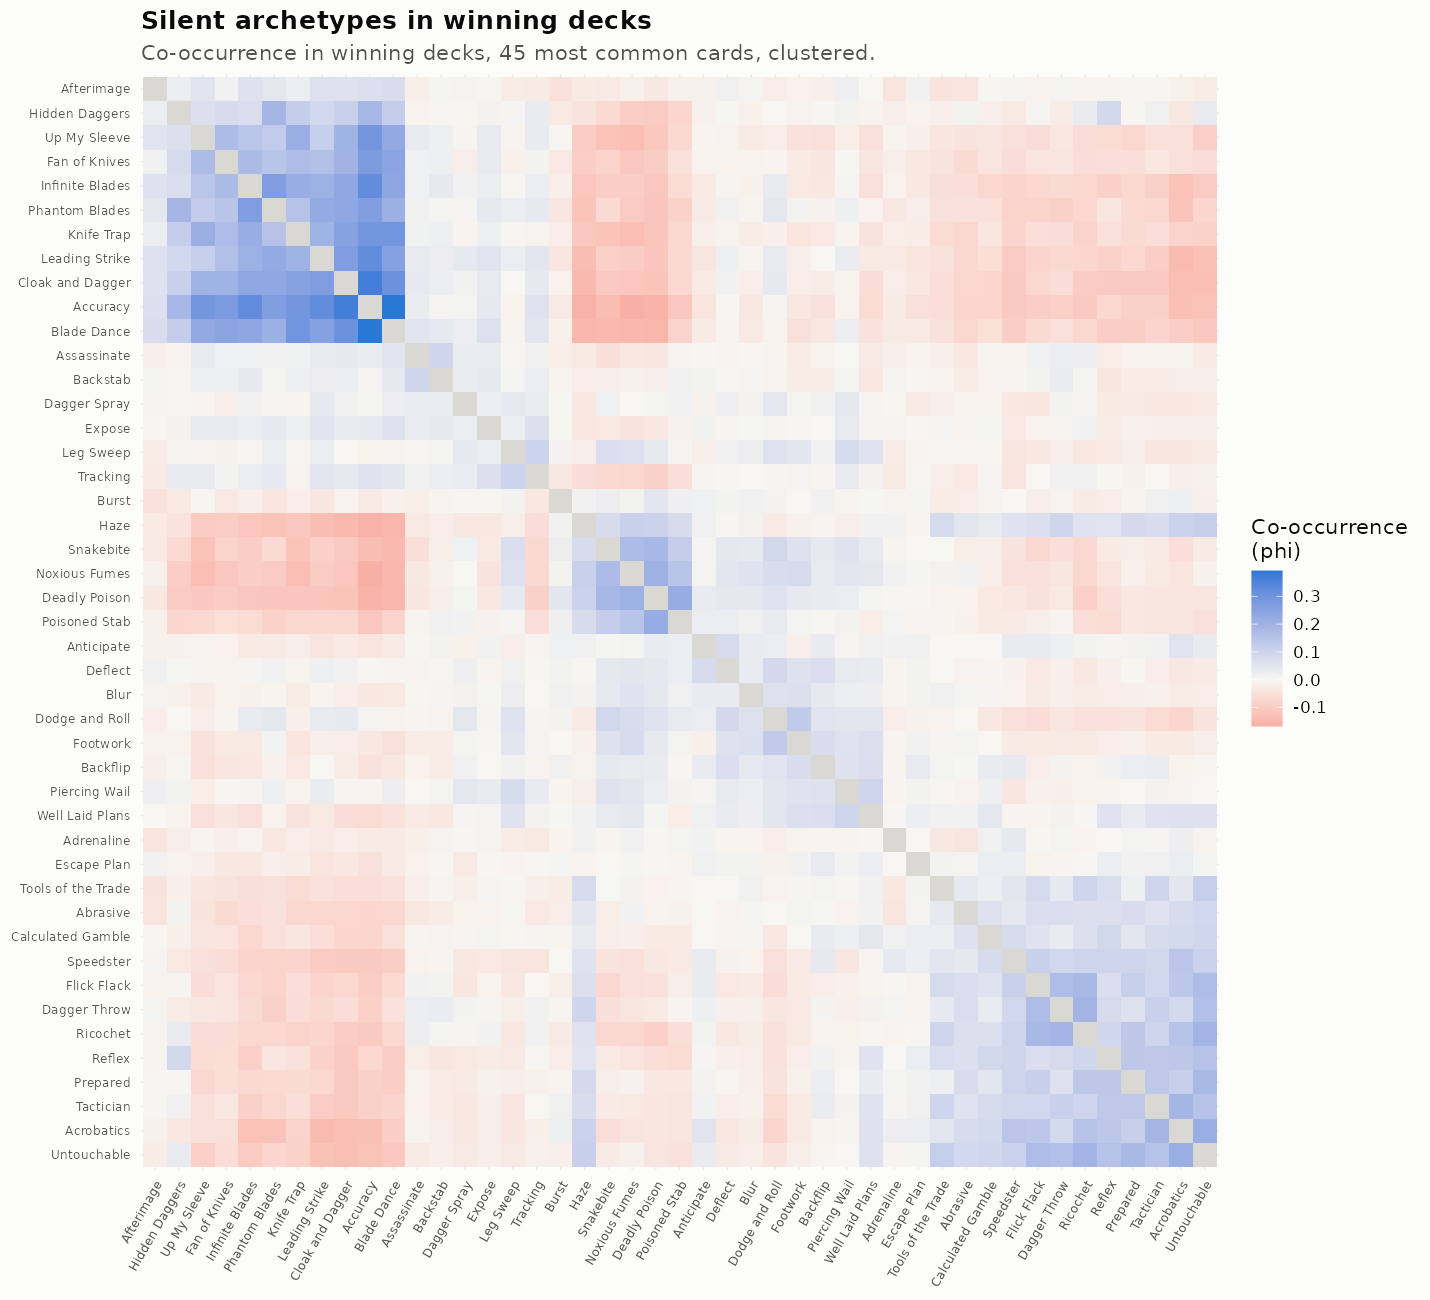
We see roughly the expected types: shivs, poison, draw/discard/sly. Most decks are not pure because it isn’t generally possible to win and never pick a suboptimal card in the final deck, and many cards seem to go in just about any winning build because they are just good overall (e.g. Adrenaline). A few also go into multiple (Reflex goes with Hidden Daggers). The results for Haze are based on the old version where it triggered on discard.
Based on these plausible pairs of cards, we can test all of these 2-way interactions specifically, and for each character. The model is: at floor X, after winning normal combat, conditional on already having X in your deck, does it predict winning chances to see Y? We call these positive interactions synergies:
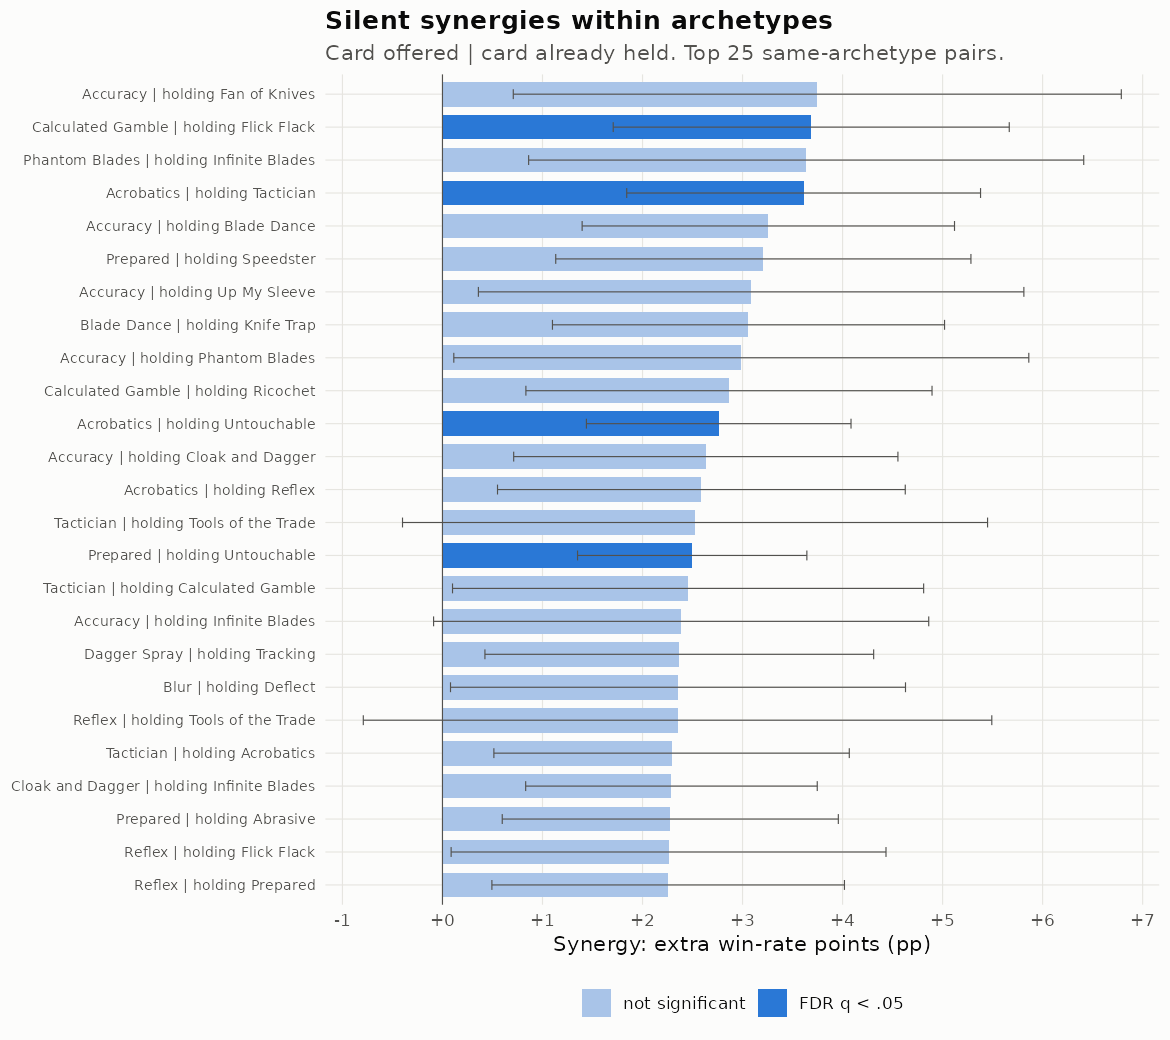
All in all, pretty credible causal estimates could be made in most cases. The combinatorial explosion seen for cards prevents us from searching too hard, at least until more data is collected.
General findings
In general, the adjusted cross-sectional models agree pretty well with the randomization tests (IV or not), so in a way, using the more fancy methods was not necessary. This is of course only in hindsight we can say this. And the estimates don’t agree perfectly even after adjustment for random errors, so there is likely some confounding left in the cross-sectional estimates. We also confirm that our best estimates are more in line with what players do.
All the more detailed results for all cards and characters can be found on the site now.