There are some data memes floating around like this one:
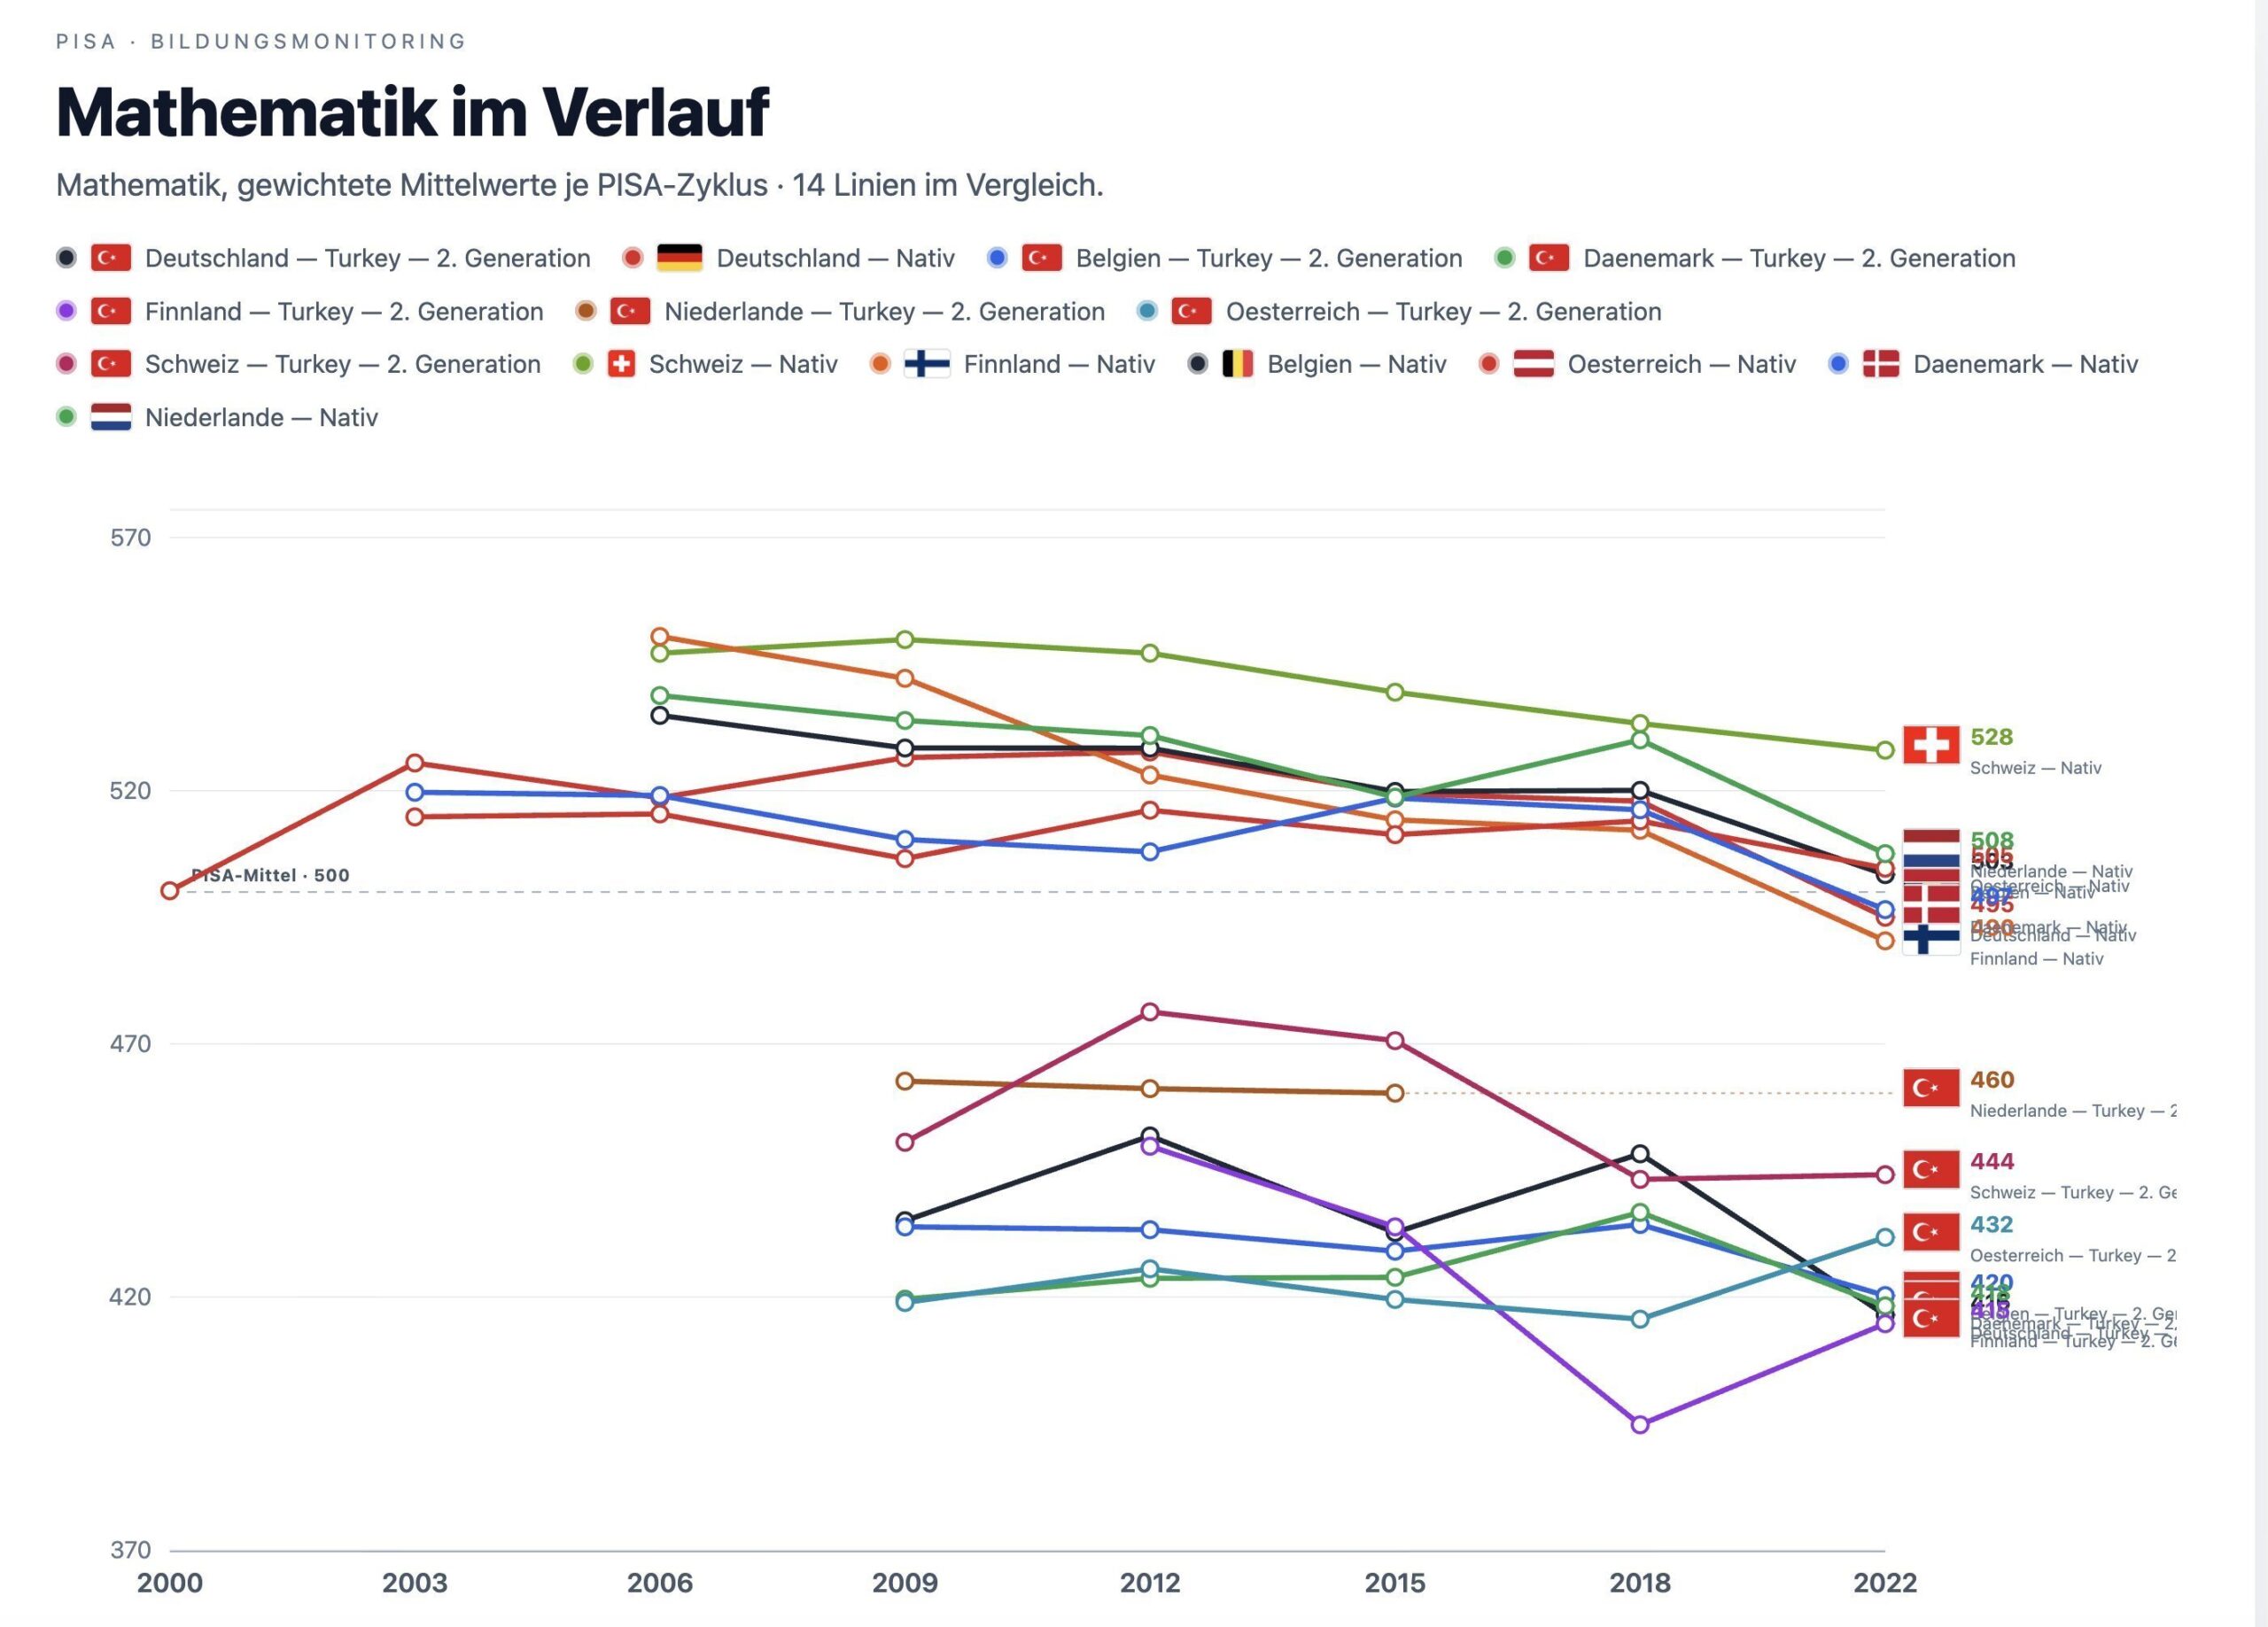
In German, it shows the performance of Turks on PISA math by year and destination country. It can be seen they all cluster and show no improvement over time. The natives are slowly declining in the comparison European countries, presumably because the ‘native’ category increasingly includes non-Europeans.
Since the PISA data are all public, we can redo this exercise but expand it to be worldwide. From a human capital perspective we can think of the world as a migration matrix of performance. Columns can be destination countries, and rows are origin countries, and each cell has the mean score seen on PISA. In an ideal world, we would have this complete matrix, but due to sample size limitations in PISA studies, privacy protection (not all origin countries are listed), unequal population sizes (larger countries can send more migrants), and differential migration (some countries send more migrants per population size), we end up with this matrix:

To give some examples:
- Turks in Austria (413), Germany (427), Denmark (424), Switzerland (447), Belgium (430), Netherlands (460), Finland (416), Liechtenstein (471).
- Indians in Australia (549), Canada (515), UK (510), Brunei (509), New Zealand (527)
- Chinese in Macao (542), Hong Kong (549), Australia (583), Canada (603), New Zealand (577), Kazakhstan (433), Finland (488), Panama (401), Netherlands (519)
These are all PISA math scores listed in order of largest samples (e.g. only 60 Chinese in Panama). I have analyzed the reading and science as well, but math seems the least prone to language bias in theory, so we will stick with it.
The simplest model we can posit is that migrants perform as they do at home, and they stay at that level. This is essentially the strict global hereditarian model. In this simple model, the score means are identical in expectation no matter where a given group of people are located. Insofar as this is accurate, it is a simple matter of predicting migrant performance since we can simply regress it on the national IQ of their home country:
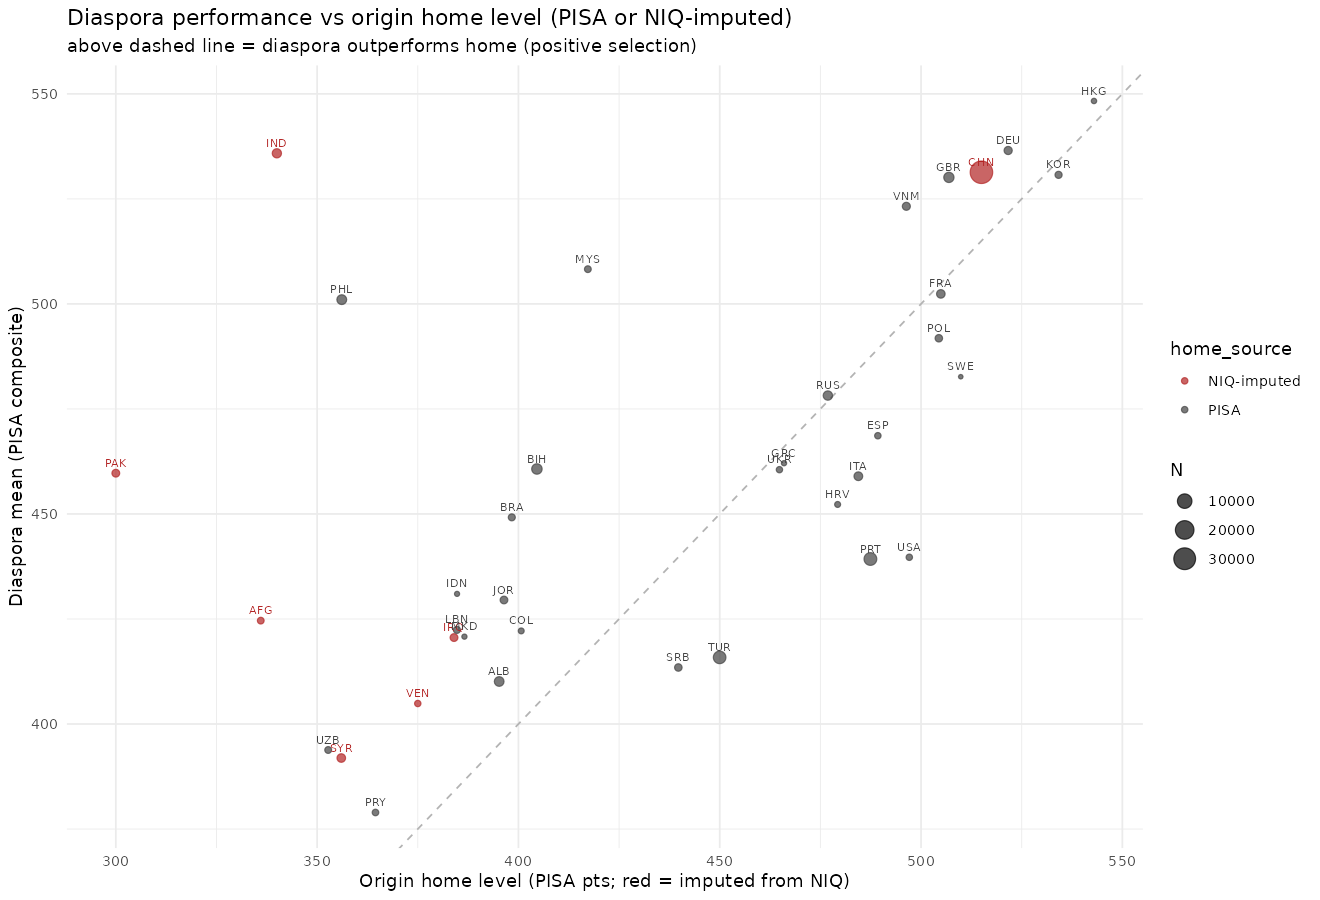
We see that several countries don’t participate in PISA but send migrants (marked in red), so their home PISA scores were imputed using the NIQ converted to PISA scale. India is the biggest outlier as they perform far better in non-India than they do in India. This suggests that Indian migrants are either not representative or India’s IQ is severely underestimated. However, let’s first consider the next simplest model: score ~ origin + destination (dummy). In this case, we allow for the fact that some countries are better at integrating migrants in some way that affects PISA scores. Positive values for the destination dummy thus means that migrants in that country perform better than expected by the origin countries’ NIQ. I would show these models but given that it is just 2 sets of values by country, it is too long to show. I can show the simplified model where we use the NIQs of the country as stand-in for the relevant values. Thus, each subject has an origin NIQ (the mean of their parents’ values, or if there is only 1 parent origin listed, that parent), and the NIQ of the destination country: score ~ origin_NIQ + destination_NIQ + year:
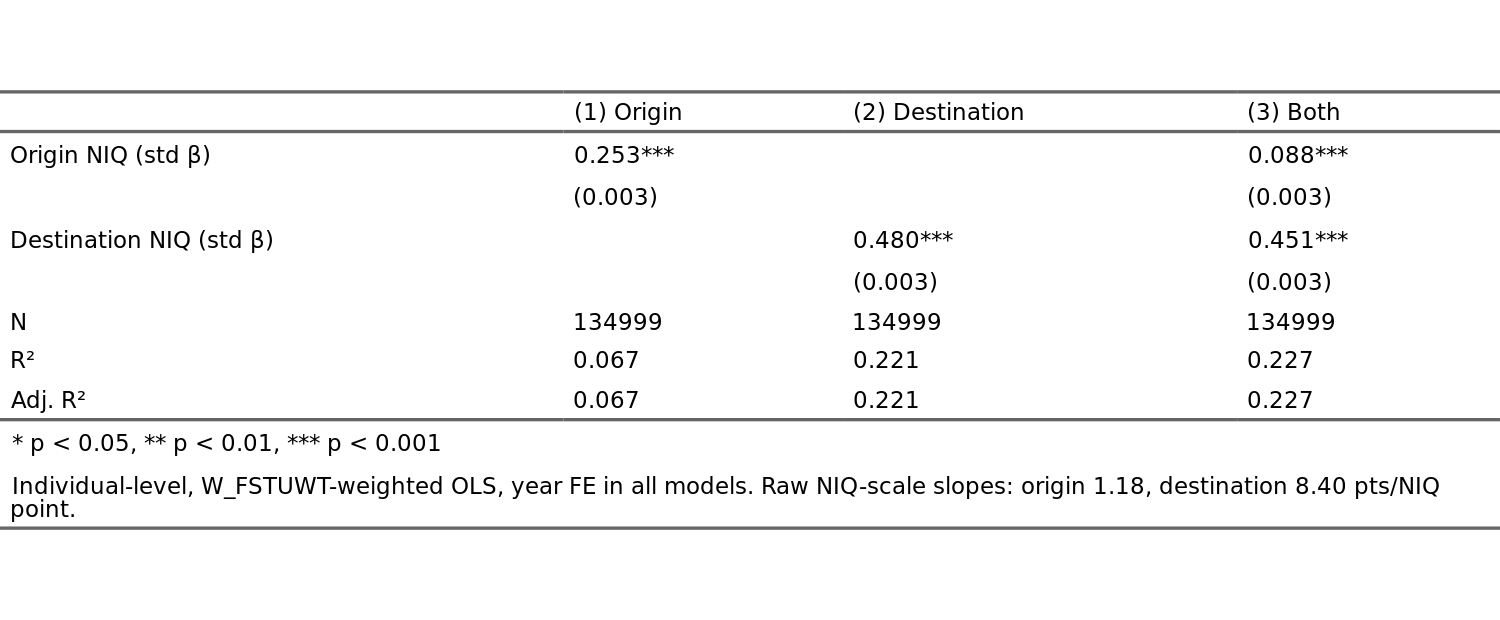
Thus surprisingly, perhaps, we see that destination NIQ is a much better predictor of how migrants perform on PISA than their home country’s NIQ according to the standardized betas. For the model with dummy variables, it is possible to compare the joint effects of the dummies for destination with the origin effects in terms of r2, so that we can get an idea of what is more important in the broad perspective:
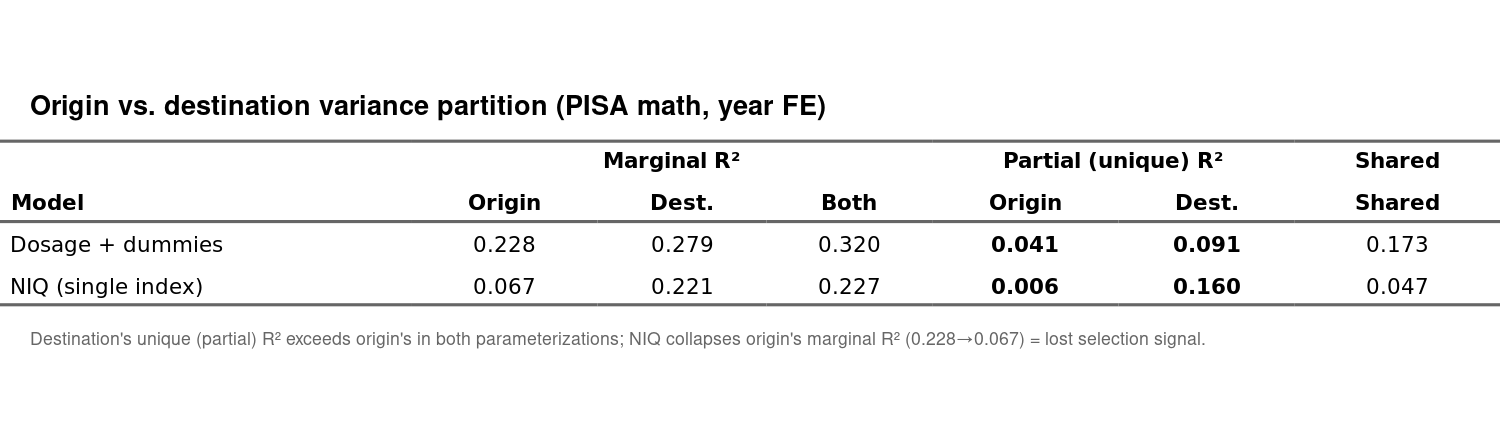
Both approaches tell roughly the same story in that destination beats the origin as a predictor, whether we let both ‘roam freely’ or force them into NIQ terms. So what is going on? It’s our old friend the migrant selectivity issue. We can compare the origin effects versus the migrant selection index which we can calculate from the IAB Brain Drain database. This database contains information about the educational level (3 classes) of people who left various countries and migrated to the OECD. Using this, we can compute a selectivity index by comparing highly educated % among the emigrants vs. the country for the same year and age group. Then we get this result:
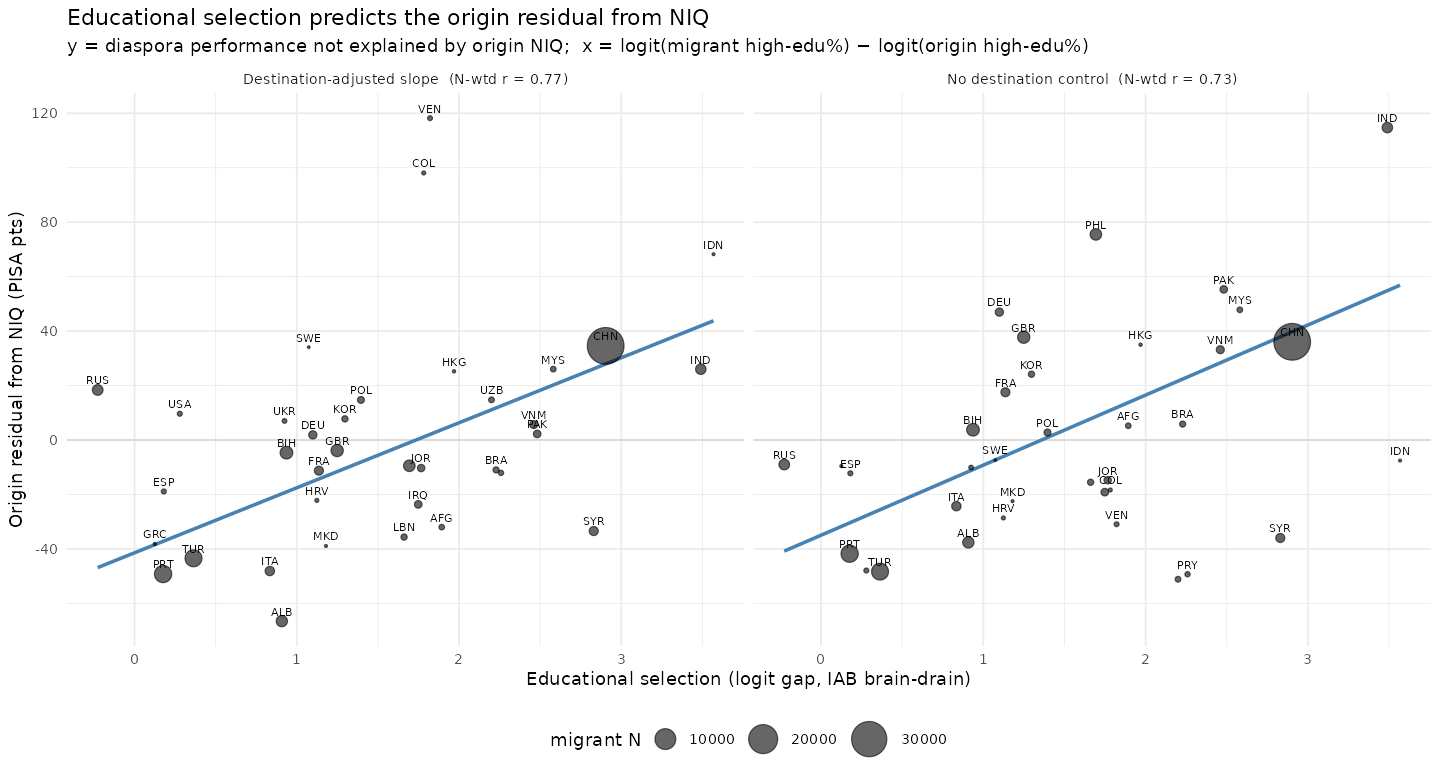
Now things make sense again. The countries that send relatively elite migrants compared to their populations are the same ones that perform well on PISA in other countries. If we don’t add the destination country dummies, we get a weighted correlation of 0.73 and 0.77 if we control for destination country even if this is uninterpretable. From a statistical perspective, this is somewhat of an annoying approach because we now have a complex 2-level model:
- score ~ destination + origin + year + residual
- origin ~ migrant_selection_index + residual2
India is the biggest outlier, Indians around the Western world perform roughly at 105 IQ on PISA math given an origin NIQ of 76 or so. This is close to the other results seen for Indians in the USA in my prior post. Note also that other countries show interesting selection effects. Pakistanis are also selected, just less so than the Indians, and they end up underperforming the Europeans despite the selection. Possibly with stronger selection, the UK wouldn’t have so big a discussion about the grooming gangs, though I suspect a lot of this difference has to do with the additional factor of Islam vs. Hinduism.
There is a way to simplify the models above into a single model, namely by converting origins to origin_NIQ expectation, destination_NIQ and then adding the selection index. Furthermore, we can exploit the fact that selection index differs also by destination, not just origin. Thus, we compute every origin x destination selection index and use this. Thus the model becomes:
- score ~ origin_NIQ + dest_NIQ + selection
Here’s the models using natural units slopes: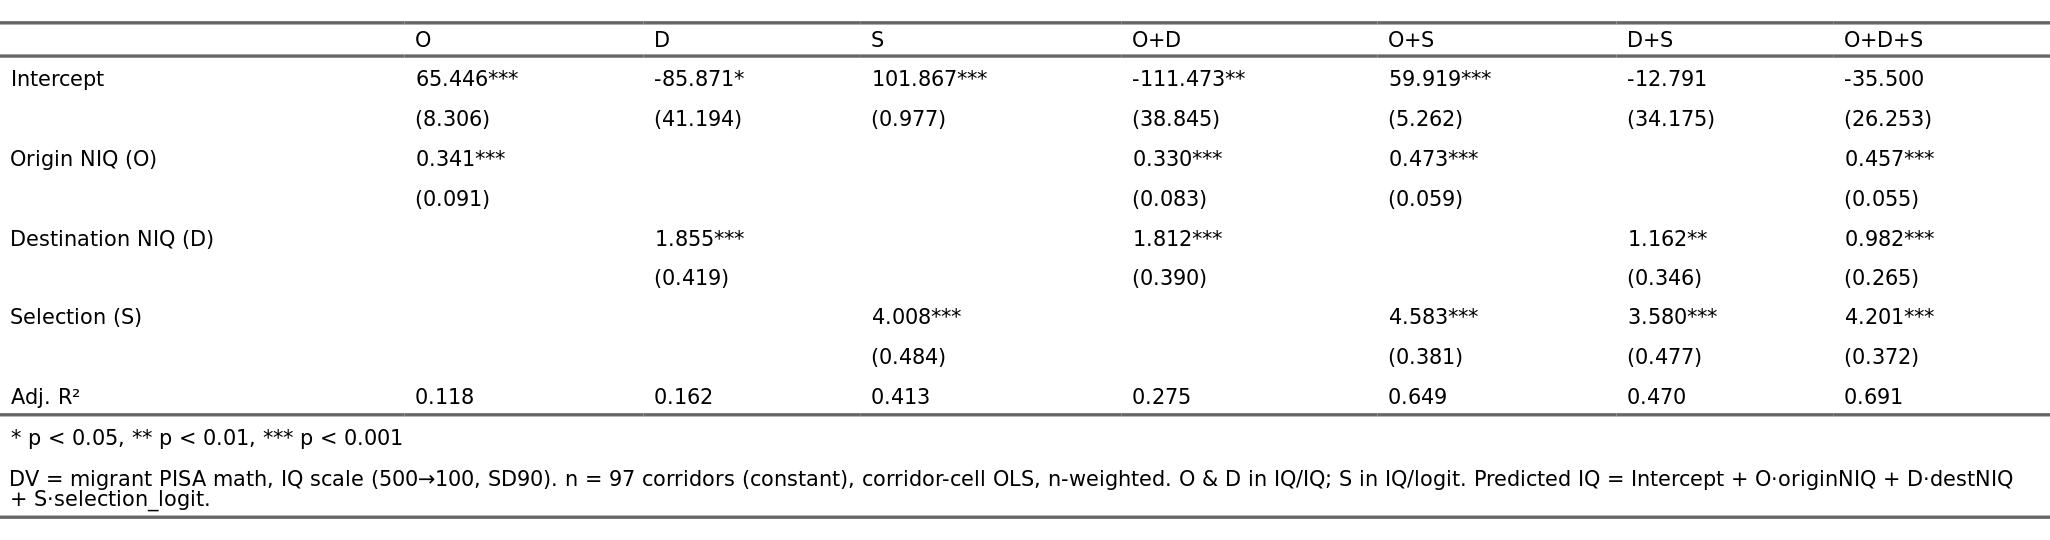
Reading the table takes some care. In the first model (O), we only use NIQ of origin as the predictor. The expected value begins at 65 IQ (in PISA units but here converted to NIQ), and rises 0.34 for every IQ point in the origin country. It’s not a great model, 12% variance. This model would predict, for instance, that a Dane in Sweden would get a score of 65+100*0.34=99, which is about right. A Somali in Denmark would get 65 + 70 * 0.34 = 89 IQ, too high. The second model (D) uses only the destination country IQ. Strangely, it has a slope larger than 1 and combined with a very negative intercept. Thus a Somali in Denmark is predicted to have a score of -86 + 100 * 1.86 = 100 IQ. In fact, it just predicts ~100 IQ for any migrant in Denmark or any other Western country. Models with S show that the slope for selection index is about 4 IQ/logit of selection (3.6 to 4.6). Curiously, destination IQ combines poorly with selection (model D+S), but origin + selection (O+S) is almost as good (65 vs. 69%) as the full model (O+D+S) despite the fact that destination beats origin alone (models O vs. D). In terms of parsimony, then, we could use the O+S model. This is what it predicts vs. what we see:
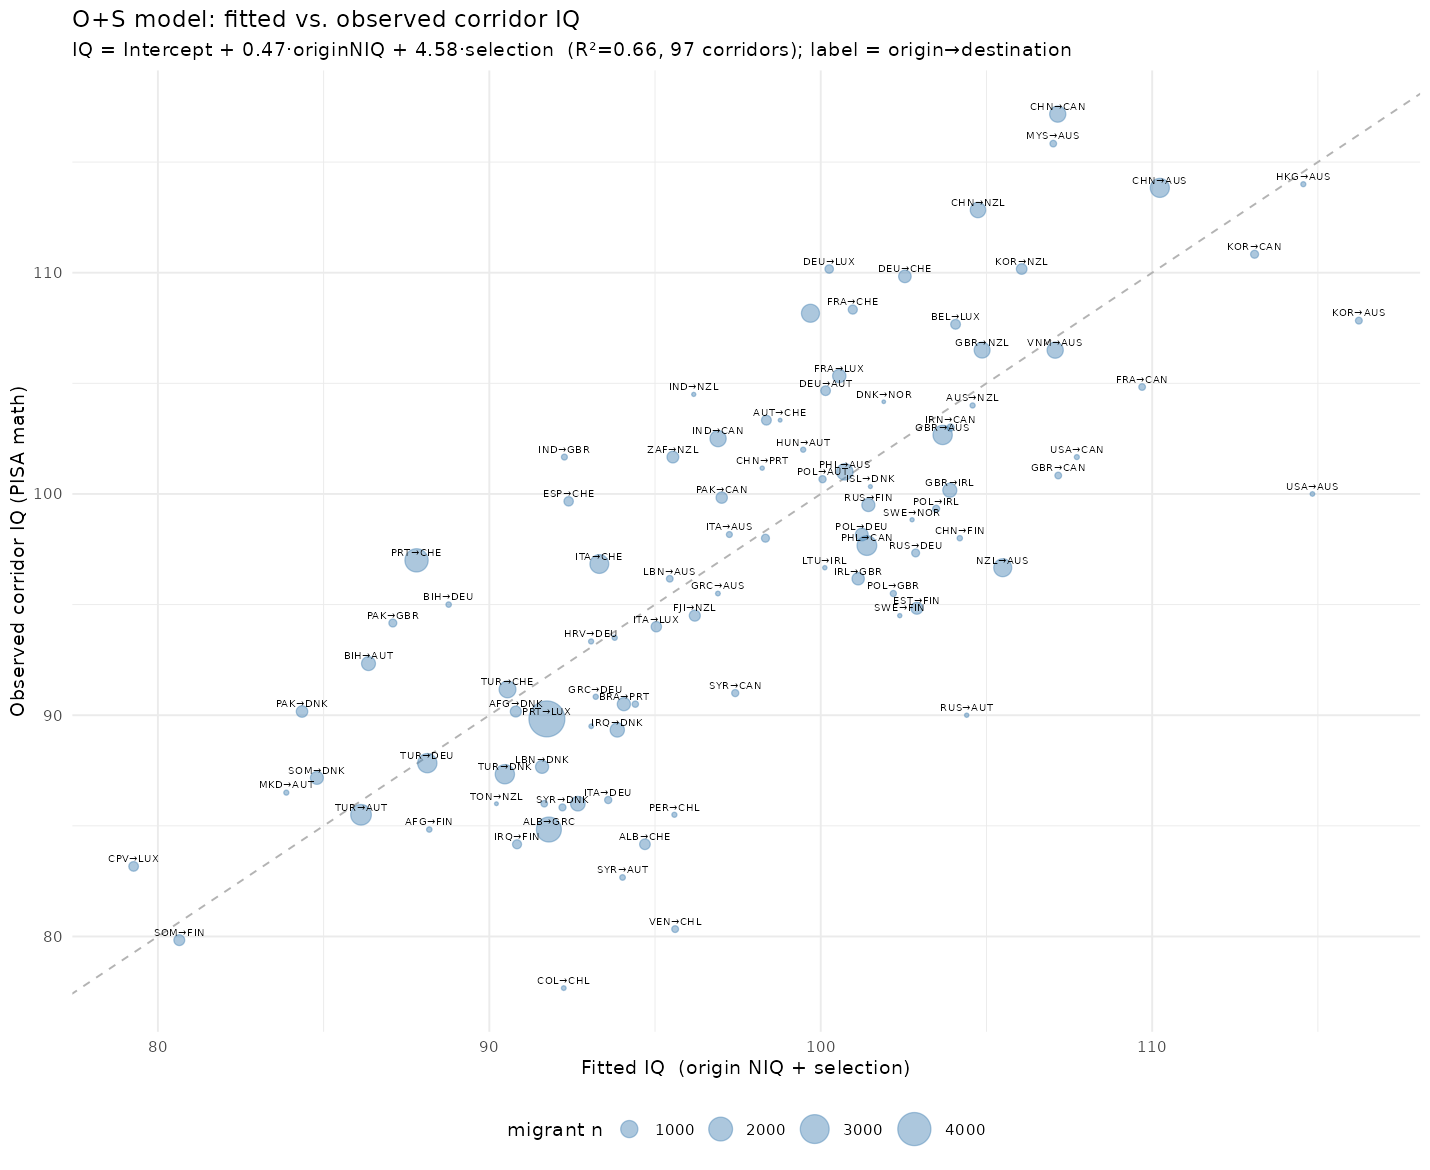
Looks pretty good, and this model essentially only uses the origin IQs and modifies them by the degree of selection we estimated using the independent Brain Drain dataset.
Referring back to the diaspora vs. home NIQs, readers may have noticed the unusual result that Americans underperform. Their mean PISA math outside the USA was only 440, on par with Portugal. Why is that? Performance by destination:
- Israel, 102 IQ, American Jews moving to Israel
- Canada, 102 IQ, Anglo-exchange
- Australia, 100 IQ, Anglo-exchange
- Mexico, 70 IQ, Mexican returnees
- USA (home), 97 IQ
The small numbers of Americans (50) who presumably returned to Mexico did extremely poorly and pulled down the average, and because it was using inverse-variance weights (like in random effects meta-analysis), it had a disproportionally large effect. The weighted mean is 480, which is not so far from expectations.
Another visible outlier in the plot is PHL or Filipinos. They scored about 100 IQ outside of their home country. PISA does not provide any ethnic data, but it does provide home language. Of the Filipinos migrants, 56% speak English at home even when they move to non-English speaking countries such as Macao. They bring English with them as the premier language and it isn’t just assimilation. In contract, of Filipinos living in their home country, only 7% speak English at home.
Concerning the Malaysians (MYS), 39% of the migrants speak Chinese (Mandarin+Cantonese+other Chinese) at home, but it’s 23% of Malaysians, so close to 2x the rate. Another 32% speak English at home, which is uncommon among normal Malaysians. Reversely, we can say that about 70% speak Malay at home in Malaysia, but only 21% among the migrants.
One can keep going through the outliers to attempt to figure out a plausible story of what is going on, but I’m not too interested in the particular cases, but in the overall pattern of results.
Regarding the math vs. other domains, here’s the O+S models for the others in comparison:
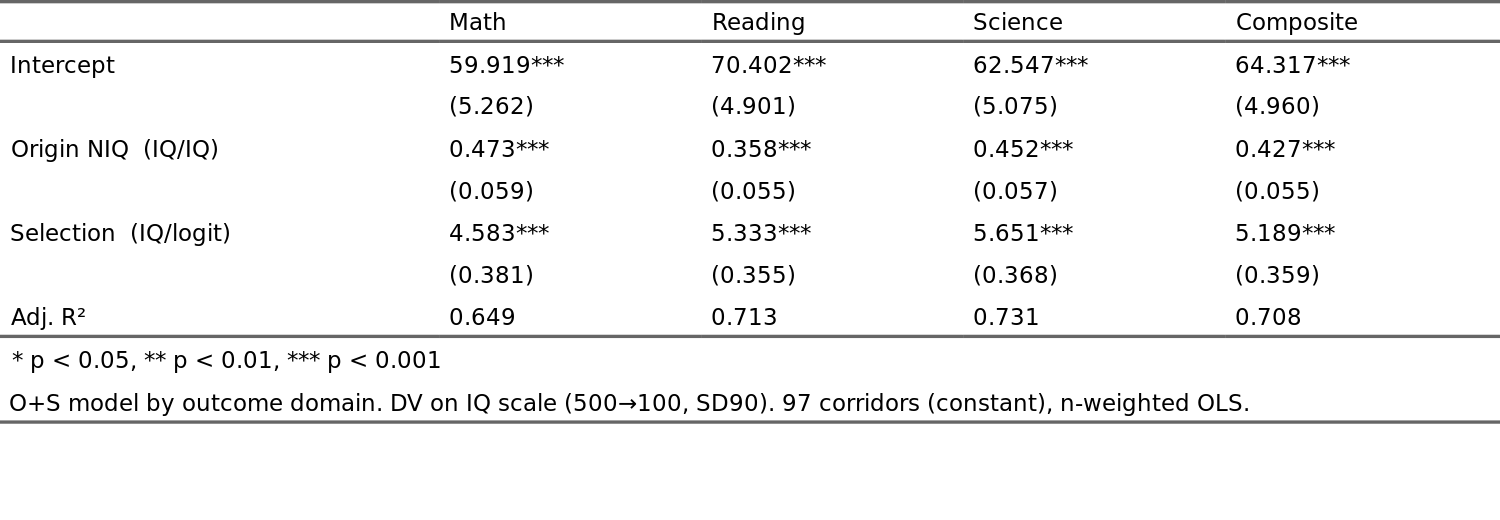
Thus surprisingly, perhaps, it turns out that the weakest model is the one with math as the outcome, the other 2 domains give somewhat stronger model fits as does the composite (average) score. The PISA people pretend that their tests are measuring 3-4 related constructs, but their scores correlate on average 0.89 with each other, so they are effectively unidimensional measures of some kind of scholastic-colored g factor. See Pokropek et al 2022 for more on this.
Conclusions
- PISA worldwide data can be used to study country of origin effects with regards to national IQs.
- However, due to biased data coverage, only 2.2% of possible origin-destination pairs have at least 25 students, so interpretation is difficult.
- It turns out that emigrant selection is the major factor explaining differences from expectations, especially because Indians overperform compared to Indians at home.
- Using just NIQ of origin + selection index explains about ~70% of variation in migrant PISA performance.