Massive sibling study just dropped, and was also presented at ISIR 2019.
- Hegelund, E. R., Flensborg-Madsen, T., Dammeyer, J., Mortensen, L. H., & Mortensen, E. L. (2019). The influence of familial factors on the association between IQ and educational and occupational achievement: A sibling approach. Personality and Individual Differences, 149, 100-107.
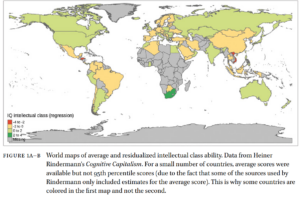
The present register-based study investigated the influence of familial factors on the association of IQ with educational and occupational achievement among young men in Denmark. The study population comprised all men with at least one full brother where both the individual and his brothers were born from 1950 and appeared before a draft board in 1968–1984 and 1987–2015 (N = 364,193 individuals). Intelligence was measured by Børge Priens Prøve at age 18. Educational and occupational achievement were measured by grade point average (GPA) in lower secondary school, time to receiving social benefits at ages 18–30, and gross income at age 30. The statistical analyses comprised two distinct statistical analyses of the investigated associations: A conventional cohort analysis and a within-sibship analysis in which the association under investigation was analysed within siblings while keeping familial factors shared by siblings fixed. The results showed that an appreciable part of the associations of IQ with educational and occupational achievement could be attributed to familial factors shared by siblings. However, only the within sibling association between IQ and GPA in lower secondary school clearly differed from the association observed in the cohort analysis after covariates had been taken into account.
It uses the familiar design of doing regression in total population, and then in sibling fixed effects. Sibling fixed effects means essentially that one subtracts the family mean for each sibship, for the variables, and uses the transformed variables. When sibships have more than 2 members, one also adjust the weights accordingly. Sibships with 2 members can only contribute 1 comparison, sibships with 3 provide 3, with 4 provide 6 etc. The use of siblings means that any environmental variable that is shared by siblings is automatically controlled for without having to measure it directly.
The sample size is rather massive:
A register-based cohort study was conducted including all Danish men with at least one full brother where both the individual and his brothers were born from 1950 and appeared before a draft board during the periods from 1968 to 1984 and from 1987 to 2015 (N = 364,193individuals & 171,037 sibships). Men who appeared before a draft board in 1985–1986 were not included, because draft board information from these two years still have not been digitized.
The social data were gathered from the CPR system i.e. the Danish centralized statistics system that allows joining of records using the unique personal identification number.
First, the main distribution of variables by 3 IQ bands.
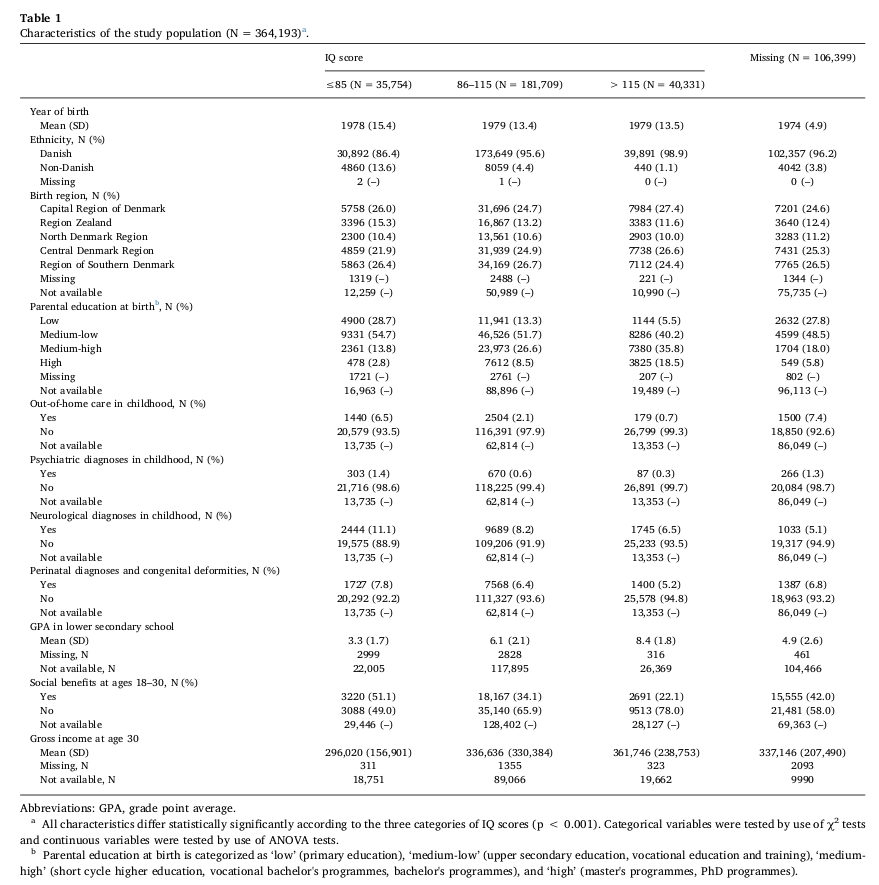 These are from the cross sectional dataset. Unfortunately, they did not use the same 5 way breakdown as The Bell Curve did, so one cannot directly compare these. A mean IQ is not provided for the ethnics groups, but we can see that among those with IQs of >=115, only 1.1% are non-Danish, but for those with <=85 IQ, it is 13.6%. We can estimate the mean IQs here if we are willing to assume equal standard deviations. If so, we get mean IQs of 100 and 87.4. These data probably overlap with the sample I analyzed earlier (in 2013), and I found a mean IQ of 86.3. Nice replication.
Next up, a few figures that show the within and between strength of association in natural units (don’t use standardized metrics because within sibship variance is smaller!).
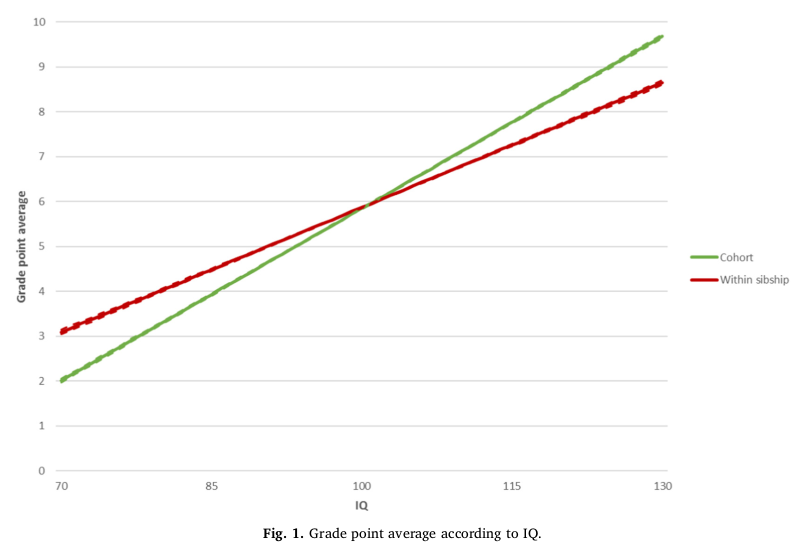
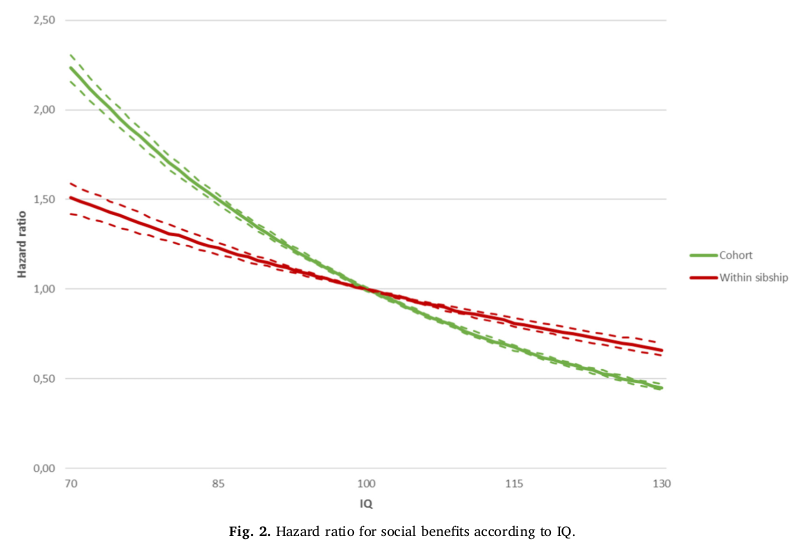
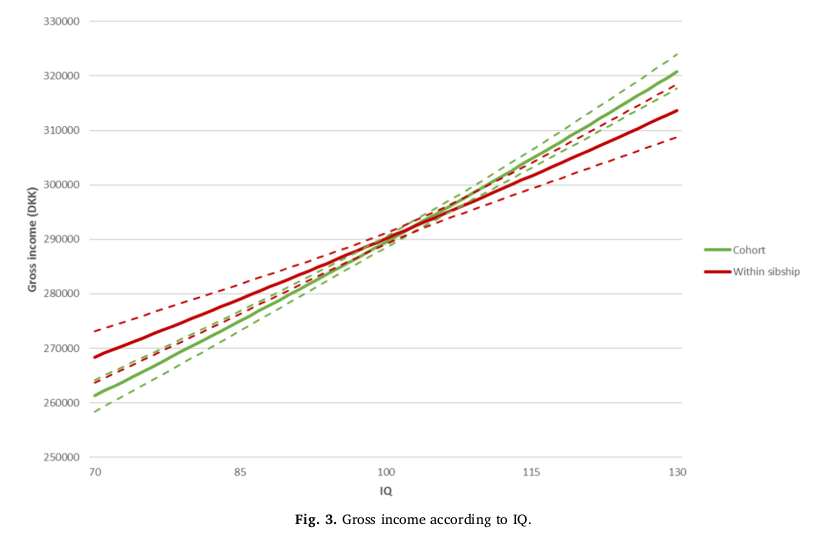 These are the unadjusted results, but they go further and also adjust for some confounders.


 So we see that the within results are slightly to somewhat weaker. This is to be expected because IQ is correlated with many other positive traits between families, but not so much within families. Thus, some of the between family association with IQ and outcomes will result from this confounding.
Strangely, The Bell Curve is not even mentioned nor is the sibling study Murray did later on. Odd! It’s worth reposting because sadly not many people know about it, so here it is:
-
Murray, C. (1998). Income inequality and IQ. AEI Press.
-
Murray, C. (2002). IQ and income inequality in a sample of sibling pairs from advantaged family backgrounds. American Economic Review, 92(2), 339-343.
- This is a reduced version of above.
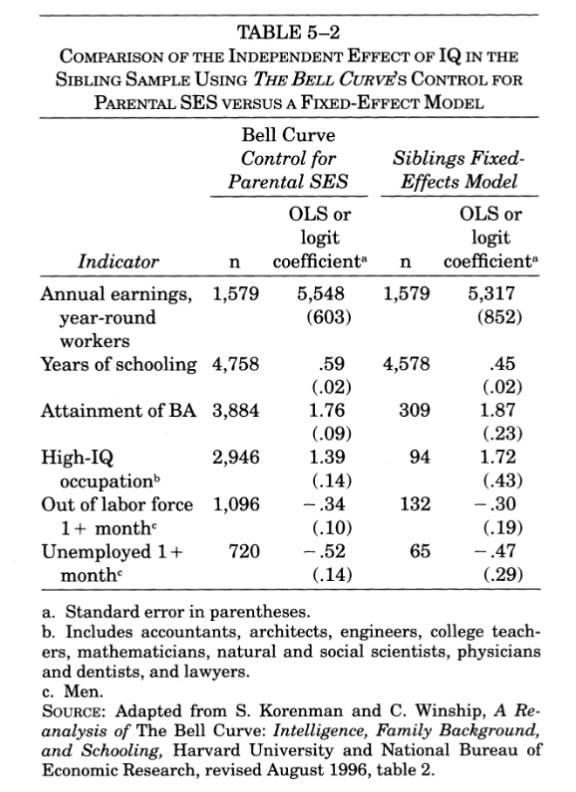
Another lacking with the new Danish study is that they did not provide a nice table like the above, so one could compare the coefficients easily between adjustments, and within/between. Maybe it is hiding in the supplement, which I can’t read (SciHub doesn’t give those… yet). Furthermore, there is no regression for crime, a very important outcome. Fortunately, a large Finnish Swedish study provided that recently:
-
Frisell, T., Pawitan, Y., & Långström, N. (2012). Is the association between general cognitive ability and violent crime caused by family-level confounders?. PloS one, 7(7), e41783.
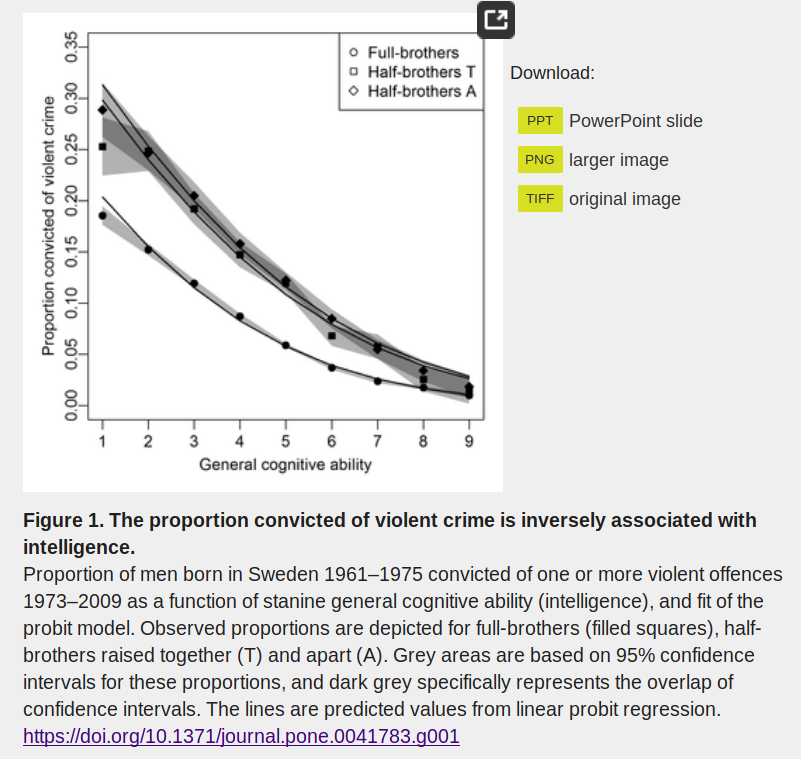
There is similarly some degree of confounding with family effects, but plenty of within family causality.
Finally, a nice thing would be to check whether the IQ gap for ethnic/ancestry groups can explain the social inequality in full, or whether one needs something more. I found earlier this year that one seemingly needs a lot more than IQ to account for this.