Same guy proposed another idea. Wikipedia has data here. However, since i had previously seen that people fudge data on Wikipedia articles (e.g. this one), then maybe it was not a good idea to just rely on Wikipedia. So i did the best thing: fetched both the data from Wiki and the data from the primary source (WHO), and then compared them for accuracy. They were 100 identical for the “total rates”. I did not compare the other variables. But at least this dataset was not fudged. :)
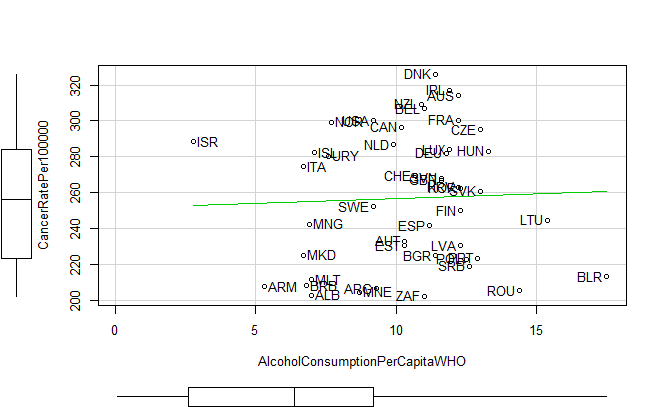
So, then i loaded the data in R and plotted alcohol consumption per capita (age >=15) vs. cancer rates per capita.
source(“merger.R”) #load custom functions
DF.mega = read.mega(“Megadataset_v1.7b.csv”) #load megadataset
#load alcohol
alcohol = read.mega(“alcohol_consumption.csv”) #loads the data
short.names = as.abbrev(rownames(alcohol)) #gets the abbreviated names so it can be merged with megadataset
rownames(alcohol) = short.names #inserts the abbreviated namesDF.mega2= merge.datasets(alcohol,DF.mega) #merge datasets
scatterplot(CancerRatePer100000 ~ AlcoholConsumptionPerCapitaWHO, DF.mega2, #plot it
smoother=FALSE, #no moving average
labels = rownames(DF.mega),id.n=nrow(DF.mega)) #include datapoint names
There is no relationship there. However, it may work in multiple regression:
lm1 = lm(CancerRatePer100000 ~ AlcoholConsumptionPerCapitaWHO+X2012LifeExpectancyatBirth,
DF.mega2)
summary(lm1)Call: lm(formula = CancerRatePer100000 ~ AlcoholConsumptionPerCapitaWHO + X2012LifeExpectancyatBirth, data = DF.mega2) Residuals: Min 1Q Median 3Q Max -48.677 -26.569 0.717 28.486 61.631 Coefficients: Estimate Std. Error t value Pr(>|t|) (Intercept) -91.6149 79.2375 -1.156 0.254 AlcoholConsumptionPerCapitaWHO 1.7712 1.6978 1.043 0.303 X2012LifeExpectancyatBirth 4.2518 0.9571 4.442 6.13e-05 *** --- Signif. codes: 0 ‘***’ 0.001 ‘**’ 0.01 ‘*’ 0.05 ‘.’ 0.1 ‘ ’ 1 Residual standard error: 31.56 on 43 degrees of freedom (227 observations deleted due to missingness) Multiple R-squared: 0.3158, Adjusted R-squared: 0.284 F-statistic: 9.923 on 2 and 43 DF, p-value: 0.0002861
There is seemingly no predictive power of alcohol consumption! But it does cause cancer, right? According to my skim of Wiki, yes, but only 3.5% of cancer cases, so the effect is too small to be seen here.
The data is in megadataset 1.7c.

