Group differences in cognitive scores have generally been found to be g-loaded, i.e. the differences are larger on the items/subtests that load more strongly on the general factor. This is generally called a Jensen effect, and its opposite an anti-Jensen effect. However this can cause linguistic trouble when dealing with (near)-zero correlations or when dealing with effects of unknown direction, at which point we don’t know if we should call them “Jensen effects” or “anti-Jensen effects”. For that reason, I use the term “Jensen coefficient” which can easily be referred to as positive, negative or near-zero.
Generally when studies report factor structure of cognitive data, they remove the effects of age and gender and do not generally report the correlations between age and subtests. Recently, I saw this paper about the standardization of the WISC-IV in Vietnam, where the authors do report them. They differ by subtest. So, this immediately leads someone like me to propose that the effect should be larger on the more g-loaded tests. This is based on the idea that as one grows up, one really gets smarter i.e. increases general intelligence. So the vector correlation should be positive. The Vietnamese study does however not report the g-loadings. So, I have resorted to getting these from some other papers on the same test, in the English language version.
The datafile is here. It has g-loadings from 6 papers yielding 8 estimates. Some papers report more than one because they model the data with more than one model. E.g. four-factor vs. five-factor hierarchical model. The correlations between the g-loadings of these studies and the subtest x age correlation from the Vietnamese study range between .272 and .528, with a median of .427 and mean of .422. If one uses the average g-loading across studies, the correlation with age x subtest is .441.* Using Spearman correlation, it is also .441.
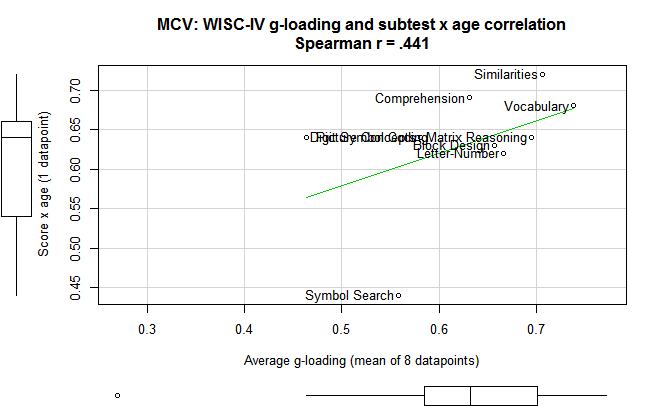
If one removes the Symbol Search outlier, Spearman r=.29, so the relationship is not entirely due to that.
As usual, this research is hampered by a lack of data sharing. 1000s of studies use the WISC and have age data too, but don’t share the data or report the necessary results so one can calculate the correlation. Furthermore, the relatively small selection of subtests make the MCV method error-prone. It would be much better if one had e.g. 20 subtests of more different g-loadings, e.g. reaction time tests.
It is also possible that a large change in some non-g ability can throw the MCV results off. General intelligence is probably not the only ability that changes as one grows up. MCV is sensitive to these other abilities changing too.
Where to go from here
Next steps:
- Find more studies reporting g-loadings of WISC-IV subtests.
- Find more studies that report age x subtest correlations.
- Find open datasets where (1-2) can be calculated.
- Write to authors and ask them if they can provide results for (1-2) or send data (3).
- Find other commonly used tests for children and do (1-4). Also interesting are age declines later on.
I have contacted some authors.
* Google Drive Sheets calculates the r as .439 instead. I don’t know why.
##R code for doing the analyses and plotting
wisc.data = read.table("clipboard", sep="\t",header=TRUE, row.names=1) #load data from clipboard
library(Hmisc) #needed for rcorr
rcorr(as.matrix(wisc.data)) #get correlations
cor(wisc.data, use="pair") #use the other function to verify
rcorr(as.matrix(wisc.data), type = "spearman") #spearman

library(car) #for scatterplot
scatterplot(r.x.age ~ avg..g.loading, wisc.data, smoother=FALSE, id.n=nrow(wisc.data),
            main = "MCV: WISC-IV g-loading and subtest x age correlation\nSpearman r = .441",
            xlab = "Average g-loading (mean of 8 datapoints)",
            ylab = "Score x age (1 datapoint)") #plot it
wisc.data2 = wisc.data[-10,] #exclude outlier symbol search
rcorr(as.matrix(wisc.data2), type = "spearman") #spearman
References
Bodin, D., Pardini, D. A., Burns, T. G., & Stevens, A. B. (2009). Higher order factor structure of the WISC-IV in a clinical neuropsychological sample. Child Neuropsychology, 15(5), 417-424.
Chen, H., Keith, T., Chen, Y., & Chang, B. (2009). What does the WISC-IV measure? Validation of the scoring and CHC-based interpretative approaches. Journal of Research in Education Sciences, 54(3), 85-108.
Keith, T. Z., Fine, J. G., Taub, G. E., Reynolds, M. R., & Kranzler, J. H. (2006). Higher order, multisample, confirmatory factor analysis of the Wechsler Intelligence Scale for Children—Fourth Edition: What does it measure. School Psychology Review, 35(1), 108-127.
Dang, H. M., Weiss, B., Pollack, A., & Nguyen, M. C. (2011). Adaptation of the Wechsler Intelligence Scale for Children-IV (WISC-IV) for Vietnam. Psychological studies, 56(4), 387-392.
Weiss, L. G., Keith, T. Z., Zhu, J., & Chen, H. (2013). WISC-IV and clinical validation of the four-and five-factor interpretative approaches. Journal of Psychoeducational Assessment, 31(2), 114-131.
Watkins, M. W. (2006). Orthogonal higher order structure of the Wechsler Intelligence Scale for Children–. Psychological Assessment, 18(1), 123.
Watkins, M. W., Wilson, S. M., Kotz, K. M., Carbone, M. C., & Babula, T. (2006). Factor structure of the Wechsler Intelligence Scale for Children–Fourth Edition among referred students. Educational and Psychological Measurement, 66(6), 975-983.