There was some talk on Twitter around prison rates and inequality:
And IQ and inequality:
But then what about prison data beyond those given above? I have downloaded the newest data from here ICPS (rate data, not totals).
Now, what about all three variables?
#load mega20d as the datafile
ineqprisoniq = subset(mega20d, select=c("Fact1_inequality","LV2012estimatedIQ","PrisonRatePer100000ICPS2015"))
rcorr(as.matrix(ineqprisoniq),type = "spearman")
                            Fact1_inequality LV2012estimatedIQ PrisonRatePer100000ICPS2015
Fact1_inequality                        1.00             -0.51                        0.22
LV2012estimatedIQ                      -0.51              1.00                        0.16
PrisonRatePer100000ICPS2015             0.22              0.16                        1.00

n
                            Fact1_inequality LV2012estimatedIQ PrisonRatePer100000ICPS2015
Fact1_inequality                         275               119                         117
LV2012estimatedIQ                        119               275                         193
PrisonRatePer100000ICPS2015              117               193                         275
So IQ is slightly positively related to prison rates and so is equality. Positive? Isn’t it bad having people in prison? Well, if the alternative is having them dead… because the punishment for most crimes is death. Although one need not be excessive as the US is. Somewhere in the middle is perhaps best?
What if we combine them into a model?
model = lm(PrisonRatePer100000ICPS2015 ~ Fact1_inequality+LV2012estimatedIQ,ineqprisoniq)
summary = summary(model)
library(QuantPsyc)
lm.beta(model)
prediction = as.data.frame(predict(model))
colnames(prediction) = "Predicted"
ineqprisoniq = merge.datasets(ineqprisoniq,prediction,1)
scatterplot(PrisonRatePer100000ICPS2015 ~ Predicted, ineqprisoniq,
            smoother=FALSE,id.n=nrow(ineqprisoniq))
> summary

Call:
lm(formula = PrisonRatePer100000ICPS2015 ~ Fact1_inequality +
    LV2012estimatedIQ, data = ineqprisoniq)

Residuals:
    Min      1Q  Median      3Q     Max
-153.61  -75.05  -31.53   44.62  507.34

Coefficients:
                  Estimate Std. Error t value Pr(>|t|)
(Intercept)       -116.451     88.464  -1.316  0.19069
Fact1_inequality    31.348     11.872   2.640  0.00944 **
LV2012estimatedIQ    3.227      1.027   3.142  0.00214 **
---
Signif. codes:  0 ‘***’ 0.001 ‘**’ 0.01 ‘*’ 0.05 ‘.’ 0.1 ‘ ’ 1

Residual standard error: 113.6 on 114 degrees of freedom
  (158 observations deleted due to missingness)
Multiple R-squared:  0.09434,	Adjusted R-squared:  0.07845
F-statistic: 5.938 on 2 and 114 DF,  p-value: 0.003523

> lm.beta(model)
Fact1_inequality LV2012estimatedIQ
        0.2613563         0.3110241
This is a pretty bad model (var%=8), but the directions held from before but were stronger. Standardized betas .25-.31. The R2 seems to be awkwardly low to me given the betas.
More importantly, the residuals are clearly not normal as can be seen above. The QQ-plot is:
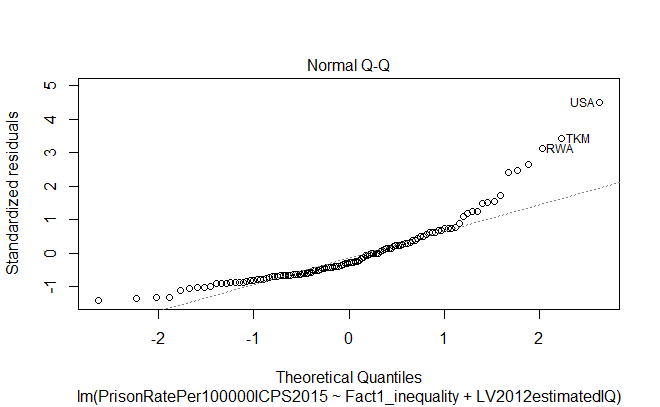
It is concave, so data distribution isn’t normal. To get diagnostic plots, simply use “plot(model)”.
Perhaps try using rank-order data:
ineqprisoniq = as.data.frame(apply(ineqprisoniq,2,rank,na.last="keep")) #rank order the data
And then rerunning model gives:
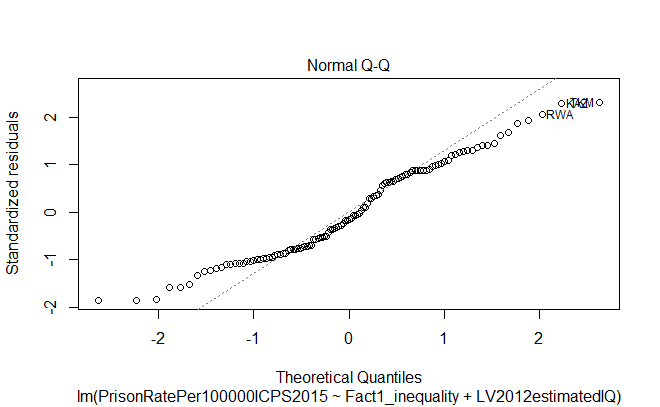
> summary

Call:
lm(formula = PrisonRatePer100000ICPS2015 ~ Fact1_inequality +
    LV2012estimatedIQ, data = ineqprisoniq)

Residuals:
     Min       1Q   Median       3Q      Max
-100.236  -46.753   -8.507   46.986  125.211

Coefficients:
                  Estimate Std. Error t value Pr(>|t|)
(Intercept)        1.08557   18.32052   0.059    0.953
Fact1_inequality   0.84766    0.16822   5.039 1.78e-06 ***
LV2012estimatedIQ  0.50094    0.09494   5.276 6.35e-07 ***
---
Signif. codes:  0 ‘***’ 0.001 ‘**’ 0.01 ‘*’ 0.05 ‘.’ 0.1 ‘ ’ 1

Residual standard error: 54.36 on 114 degrees of freedom
  (158 observations deleted due to missingness)
Multiple R-squared:  0.2376,	Adjusted R-squared:  0.2242
F-statistic: 17.76 on 2 and 114 DF,  p-value: 1.924e-07

> lm.beta(model)
 Fact1_inequality LV2012estimatedIQ
        0.4757562         0.4981808
Much better R2, directions the same but betas are stronger, and residuals look normalish from the above. QQ plot shows them not to be even now.
Prediction plots based off the models:
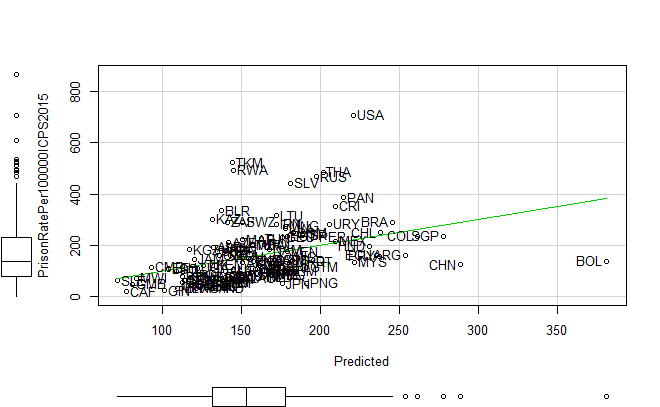
![]()
So is something strange going on with the IQ, inequality and prison rates? Perhaps something nonlinear. Let’s plot them by IQ bins:
bins = cut(unlist(ineqprisoniq["LV2012estimatedIQ"]),5) #divide IQs into 5 bins
ineqprisoniq["IQ.bins"] = bins
describeBy(ineqprisoniq["PrisonRatePer100000ICPS2015"],bins)
library(gplots)
plotmeans(PrisonRatePer100000ICPS2015 ~ IQ.bins, ineqprisoniq,
          main = "Prison rate by national IQ bins",
          xlab = "IQ bins (2012 data)", ylab = "Prison rate per 100000 (2014 data)")
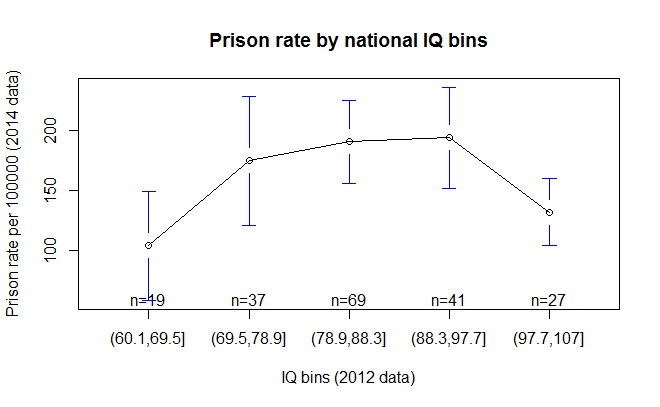
That looks like “bingo!” to me. We found the pattern.
What about inequality? The trouble is that the inequality data is horribly skewed with almost all countries have a low and near identical inequality compared with the extremes. The above will (does not) work well. I tried with different bins numbers too. Results look something like this:
bins = cut(unlist(ineqprisoniq["Fact1_inequality"]),5) #divide IQs into 5 bins
ineqprisoniq["inequality.bins"] = bins
plotmeans(PrisonRatePer100000ICPS2015 ~ inequality.bins, ineqprisoniq,
          main = "Prison rate by national inequality bins",
          xlab = "inequality bins", ylab = "Prison rate per 100000 (2014 data)")
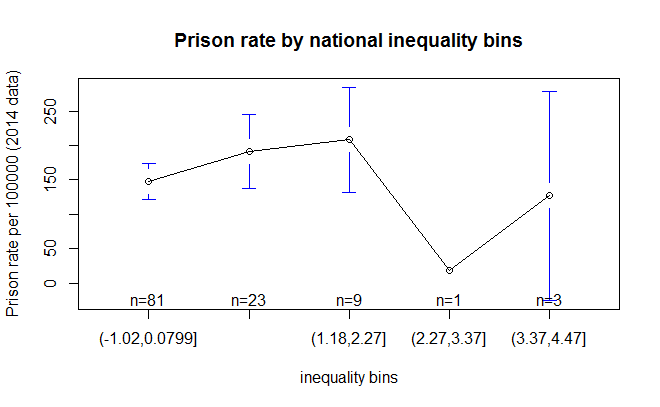
So basically, the most equal countries to the left have low rates, somewhat higher in the unequal countries within the main group and varying and on average lowish among the very unequal countries (African countries without much infrastructure?).
Perhaps this is why the Equality Institute limited their analyses to the group on the left, otherwise they don’t get the nice clear pattern they want. One can see it a little bit if one uses a high number of bins and ignores the groups to the right. E.g. 10 bins:

Among the 3 first groups, there is a slight upward trend.