UNFINISHED ANALYSIS. POSTED HERE TO ESTABLISH PRIORITY. MORE TO FOLLOW! Updated 2015-12-04
Remains to be done:
- Admixture analysis (doing)
- Proofreading and editing
- Deciding how to control for age and scanner (technical question)
Abstract
I explore a large (N≈1000), open dataset of brain measurements and find a general factor of brain size (GBSF) that covers all regions except possibly the amygdala (loadings near-zero, 3 out of 4 negative). It is very strongly correlated with total brain size volume and surface area (rs>.9). The factor was (near)identical across genders after adjustments for age were made (factor congruence 1.00).
GBSF had similar correlations to cognitive measures as did other aggregate brain size measures: total cortical area and total brain volume. I replicated the finding that brain measures were associated with parental income and educational attainment.
Introduction
A recent paper by Noble et al (2015) has gotten considerable attention in the media. An interesting fact about the paper is that most of the data was published in the paper, perhaps inadvertently. I was made aware of this fact by an observant commenter, FranklinDMadoff, on the blog of James Thompson (Psychological Comments). In this paper I make use of the same data, revisit their conclusions as well do some of my own.
The abstract of the paper reads:
Socioeconomic disparities are associated with differences in cognitive development. The extent to which this translates to disparities in brain structure is unclear. We investigated relationships between socioeconomic factors and brain morphometry, independently of genetic ancestry, among a cohort of 1,099 typically developing individuals between 3 and 20 years of age. Income was logarithmically associated with brain surface area. Among children from lower income families, small differences in income were associated with relatively large differences in surface area, whereas, among children from higher income families, similar income increments were associated with smaller differences in surface area. These relationships were most prominent in regions supporting language, reading, executive functions and spatial skills; surface area mediated socioeconomic differences in certain neurocognitive abilities. These data imply that income relates most strongly to brain structure among the most disadvantaged children.
The results are not all that interesting, but the dataset is very large for a neuroscience study, the median sample size of median samples sizes in a meta-analysis of 49 meta-analysis is 116.5 (Button et al, 2013; based on the data in their Table 1). Furthermore, they provide a very large set of different, non-overlapping brain measurements which are useful for a variety of analyses, and they provide genetic admixture data which can be used for admixture mapping.
Why their results are as expected
The authors give their results (positive relationships between various brain size measures and parental educational and economic variables) environmental interpretations. For instance:
It is possible that, in these regions, associations between parent education and children’s brain surface area may be mediated by the ability of more highly educated parents to earn higher incomes, thereby having the ability to purchase more nutritious foods, provide more cognitively stimulating home learning environments, and afford higher quality child care settings or safer neighborhoods, with more opportunities for physical activity and less exposure to environmental pollutants and toxic stress3, 37. It will be important in the future to disambiguate these proximal processes by measuring home, family and other environmental mediators21.
However, one could also expect the relationship to be due to general cognitive ability (GCA; aka. general intelligence) and its relationship to favorable educational and economic outcomes, as well as brain measures. Figure 1 illustrates this expected relationship:

The purple line is the one the authors are often arguing for based on their observed positive relationships. As can be seen in the figure, this positive relationship is also expected because of parental education/income’s positive relationship to parental GCA, which is related to parental brain properties which are highly heritable. Based on these well-known relationships, we can estimate some expected correlations. The true score relationship between adult educational attainment and GCA is somewhere around .56 (Strenze, 2007).
The relationship between GCA and whole brain size is around .24-.28, depending on whether one wants to use the unweighted mean, n-weighted mean or median, and which studies one includes of those collected by Pietschnig et al (2014). I used healthy samples (as opposed to clinical) and only FSIQ. This value is uncorrected for measurement error of the IQ test, typically assumed to be around .90. If we choose the conservative value of .24 and then correct with .90, we get .27 as an estimated true score correlation.
The heritability of whole brain size is very high. Bouchard (2014) summarized a few studies: one found cerebral total h^2 of = .89, another whole-brain grey matter .82, whole-brain white matter .87, and a third total brain volume .80. Perhaps there is some publication bias in these numbers, so we can choose .80 as an estimate. We then correct this for measurement error and get .89. None of the previous studies were corrected for restriction of range which is fairly common because most studies use university students (Henrich et al, 2010) who average perhaps 1 standard deviation above the population mean in GCA. If we multiply these numbers we get an estimate of r=.13 between parental education and total brain volume or a similar measure. As for income, the expected correlation is somewhat lower because the relationship between GCA and income is weaker, perhaps .23 (Strenze, 2007). This gives .05. However, Strenze did not account for the non-linearity of the income x GCA relationship, so it is probably somewhat higher.
Initial analyses
Analysis was done in R. Code file, figures, and data are available in supplementary material
Collecting the data
The authors did not just publish one datafile with comments about the variables, but instead various excel files were attached to parts of the figures. There are 6 such files. They all contain the same number of cases and they overlap completely (as can be seen by the subjectID column). The 6 files however do not overlap completely in their columns and some of them have unique columns. These can all be merged into one dataset.
Dealing with missing data
The original authors dealt with this simply by relying on the complete cases only. This method can bias the results when the data is not missing completely at random. Instead, it is generally better to impute missing data (Sterne et al, 2009). Figure 1 shows the matrixplot of the data file.

The red areas mean missing data, except in the case of nominal variables which are for some reason always colored red (an error I think). Examining the structure of missing data showed that it was generally not possible to impute the data, since many cases were missing most of their values. One will have to exclude these cases. Doing so reduces the sample size from 1500 to 1068. The authors report having 1099 complete cases, but I’m not sure where the discrepancy arises.
Dealing with gender
Since males have much larger brain volumes than females, even after adjustment for body size, there is the question of how to deal with gender (no distinction is being made here between sex and gender). The original authors did this by regressing the effect out. However, in my experience, regression does not always accomplish this perfectly, so when possible one should just split the sample by gender and calculate results in each one-gender sample. One cannot do the sampling splitting when one is interested in the specific regression effect of gender, or when the resulting samples would be too small.
Dealing with age
This problem is tricky. The original authors used age and age2 to deal with age in a regression model. However, since I wanted to visualize the relationships between variables, this option was not useful to me because it would only give me the summary statistics with the effects of age, not the data. Instead, I calculated the residuals for all variables of interest after they were regressed on age, age2 and age3. The cubic age was used to further catch non-linear effects of age, as noted by e.g. Jensen (2006: 132-133).
Dealing with scanning site
One peculiar feature of the study not discussed by the authors was the relatively effect of different scanners on their results, see e.g. their Table 3. To avoid scanning site influencing the results, I also regressed this out (as a nominal variable with 13 levels).
Dealing with size
The dataset does not have size measures thus making it impossible to adjust for body size. This is problematic as it is known that body size correlates with GCA both within and between species. We are interested in differences in brain size holding body size equal. This cannot be done in the present study.
Factor analyzing brain size measurements
Why would one want to factor analyze brain measures?
The short answer is the same as that to the question: why would one want to factor analyze cognitive ability data? The answer: To explore the latent relationships in the data not immediately obvious. A factor analysis will reveal whether there is a general factor of some domain, which can be a theoretically very important discovery (Dalliard, 2013; Jensen, 1998:chapter 2). If there is no general factor, this will also be revealed and may be important as well. This is not to say that general factors or the lack thereof are the only interesting thing about the factor structure, multifactor structures are also interesting, whether orthogonal (uncorrelated) or as part of a hierarchical solution (Jensen, 2002).
The long answer is that human psychology is fundamentally a biological fact, a matter of brain physics and chemistry. This is not to say that important relationships can not fruitfully be described better at higher-levels (e.g. cognitive science), but that ultimately the origin of anything mental is biology. This fact should not be controversial except among the religious, for it is merely the denial of dualism, of ghosts, spirits, gods and other immaterial beings. As Jensen (1997) wrote:
Although the g factor is typically the largest component of the common factor variance, it is the most “invisible.” It is the only “factor of the mind” that cannot possibly be described in terms of any particular kind of knowledge or skill, or any other characteristics of psychometric tests. The fact that psychometric g is highly heritable and has many physical and brain correlates means that it is not a property of the tests per se. Rather, g is a property of the brain that is reflected in observed individual differences in the many types of behavior commonly referred to as “cognitive ability” or “intelligence.” Research on the explanation of g, therefore, must necessarily extend beyond psychology and psychometrics. It is essentially a problem for brain neurophysiology. [my emphasis]
If GCA is a property of the brain, or at least that there is an analogous general brain performance factor, it may be possible to find it with the same statistical methods that found the GCA. Thus, to find it, one must factor analyze a large, diverse sample of brain measurements that are known to correlate individually with GCA in the hope that there will be a general factor which will correlate very strongly with GCA. There is no guarantee as I see it that this will work, as I see it, but it is something worth trying.
In their chapter on brain and intelligence, Colom and Thompson (2011) write:
The interplay between genes and behavior takes place in the brain. Therefore, learning the language of the brain would be crucial to understand how genes and behavior interact. Regarding this issue, Kovas and Plomin (2006) proposed the so -called “ generalist genes ” hypothesis, on the basis of multivariate genetic research findings showing significant genetic overlap among cognitive abilities such as the general factor of intelligence ( g ), language, reading, or mathematics. The hypothesis has implication for cognitive neuroscience, because of the concepts of pleiotropy (one gene affecting many traits) and polygenicity (many genes affecting a given trait). These genetic concepts suggest a “ generalist brain ” : the genetic influence over the brain is thought to be general and distributed.
Which brain measurements have so far been found to correlate with GCA (or its IQ proxy)?
Below I have compiled a list of brain measurements that have at some point been found to be correlated with GCA IQ scores:
- Brain evoked potentials: habituation time (Jensen, 1998:155)
- Brain evoked potentials: complexity of waveform (Deary and Carol, 1997)
- Brain intracellular pH-level (Jensen, 1998:162)
- Brain size: total and brain regions (Jung and Haier, 2007)
- Of the above, grey matter and white matter separate
- Cortical thickness (Deary et al, 2010)
- Cortical development (Shaw, P. et al. 2006)
- Nerve conduction velocity (Deary and Carol, 1997)
- Brain wave (EEG) coherence (Jensen, 2002)
- Event related desynchronization of brain waves (Jensen, 2002)
- White matter lesions (Turken et al, 2008)
- Concentrations of N-acetyl aspartate (Jung, et al. 2009)
- Water diffusion parameters (Deary et al, 2010)
- White matter integrity (Deary et al, 2010)
- White matter network efficiency (Li et al. 2009)
- Cortical glucose metabolic rate during mental activity / Neural efficiency (Neubauer et al, 2009)
- Uric acid level (Jensen, 1998:162)
- Density of various regions (Frangou et al 2004)
- White matter fractional anisotropy (Navas‐Sánchez et al 2014; Kim et al 2014)
- Reliable responding to changing inputs (Euler et al, 2015)
Most of the references above lead to the reviews I relied upon (Deary and Carol, 1997; Jensen, 1998, 2002; Deary et al, 2010). There are surely more, and probably a large number of the above are false-positives. Some I could not find a direct citation for. We cannot know which are false positives until large datasets are compiled with these measures as well as a large number of cognitive tests. A simple WAIS battery won’t suffice, there needs to be elementary cognitive tests too, and other tests that vary more in content, type and g-loading. This is necessary if we are to use the method of correlated vectors as this does not work well without diversity in factor indicators. It is also necessary if we are to examine non-GCA factors.
My hypothesis is that if there is a general brain factor, then it will have a hierarchical structure similar to GCA. Figure 2 shows a hypothetical structure of this.
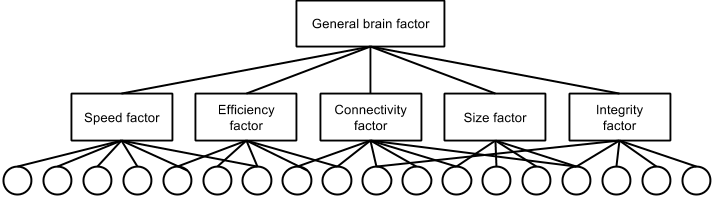
Notes: Where squares at latent variables and circles are observed variables. I am aware this is opposite of normal practice (e.g. Beaujean, 2014) but text is difficult to fit into circles.
Of these, the speed factor has to do with speed of processing which can be enhanced in various ways (nerve conduction velocity, higher ‘clock’ frequency). Efficiency has to do with efficient use of resources (primarily glucose). Connectivity has to do with better intrabrain connectivity, either by having more connections, less problematic connections or similar. Size has to do with having more processing power by scaling up the size. Some areas may matter more than others for this. Integrity has to do with withstanding assaults, removing garbage (which is known to be the cause of many neurodegenerative diseases) and the like. There are presumably more factors, and some of mine may need to be split.
Previous studies and the present study
Altho factor analysis is common in differential psychology and related fields, it is somewhat rare outside of those. And when it is used, it is often done in ways that are questionable (see e.g. controversy surrounding Hampshire et al (2012): Ashton et al (2014a), Hampshire et al (2014), Ashton et al (2014b), Haier et al (2014a), Ashton et al (2014c), Haier et al (2014b)). On the other hand, factor analytic methods have been used in a surprisingly diverse collection of scientific fields (Jöreskog 1996; Cudeck and MacCallum, 2012).
I am only familiar with one study applying factor analysis to different brain measures and it was a fairly small study at n=132 (Pennington et al, 2000). They analyzed 13 brain regions and reported a two-factor solution. It is worth quoting their methodology section:
Since the morphometric analyses yield a very large number of variables per subject, we needed a data reduction strategy that fit with the overall goal of exploring the etiology of individual differences in the size of major brain structures. There were two steps to this strategy: (1) selecting a reasonably small set of composite variables that were both comprehensive and meaningful; and (2) factor analyzing the composite variables. To arrive at the 13 composite variables discussed earlier, we (1) picked the major subcortical structures identified by the anatomic segmentation algorithms, (2) reduced the set of possible cortical variables by combining some of the pericallosal partitions as described earlier, and (3) tested whether it was justifiable to collapse across hemispheres. In the total sample, there was a high degree of correlation (median R=.93, range=.82-.99) between the right and left sides of any given structure; it thus seemed reasonable to collapse across hemispheres in creating composites. We next factor-analyzed the 13 brain variables in the total sample of 132 subjects, using Principal Components factor analysis with Varimax rotation (Maxwell & Delaney, 1990). The criteria for a significant factor was an eigenvalue>l.0, with at least two variables loading on the factor.
The present study makes it possible to perform a better analysis. The sample is about 8 times larger and has 27 non-overlapping measurements of brain size, broadly speaking. The major downside of the variables in the present study is that the cerebral is not divided into smaller areas as done in their study. Given the very large sample size, one could use 100 variables or more.
The available brain measures are:
- cort_area.ctx.lh.caudalanteriorcingulate
- cort_area.ctx.lh.caudalmiddlefrontal
- cort_area.ctx.lh.fusiform
- cort_area.ctx.lh.inferiortemporal
- cort_area.ctx.lh.middletemporal
- cort_area.ctx.lh.parsopercularis
- cort_area.ctx.lh.parsorbitalis
- cort_area.ctx.lh.parstriangularis
- cort_area.ctx.lh.rostralanteriorcingulate
- cort_area.ctx.lh.rostralmiddlefrontal
- cort_area.ctx.lh.superiortemporal
- cort_area.ctx.rh.caudalanteriorcingulate
- cort_area.ctx.rh.caudalmiddlefrontal
- cort_area.ctx.rh.fusiform
- cort_area.ctx.rh.parsopercularis
- cort_area.ctx.rh.parsorbitalis
- cort_area.ctx.rh.parstriangularis
- cort_area.ctx.rh.rostralanteriorcingulate
- cort_area.ctx.rh.rostralmiddlefrontal
- vol.Left.Cerebral.White.Matter
- vol.Left.Cerebral.Cortex
- vol.Left.Hippocampus
- vol.Left.Amygdala
- vol.Right.Cerebral.White.Matter
- vol.Right.Cerebral.Cortex
- vol.Right.Hippocampus
- vol.Right.Amygdala
I am not expert in neuroscience, but as far as I know, the above measurements are independent and thus suitable for factor analysis. They reported additional aggregate measures such as total surface area and total volume. They also reported total cranial volume, which permits the calculations of another two brain measurements: the non-brain volume of the cranium (subtracting total brain volume from total intracranial volume), and the proportion of intracranial volume used for brain.
The careful reader has perhaps noticed something bizarre about the dataset, namely that there is an unequal number of left hemisphere (“lh”) and right hemisphere (“rh”) regions (11 vs. 8). I have no idea why this is, but it is somewhat problematic in factor analysis since this weights some variables twice as well as weighting the left side a bit more.
The present dataset is inadequate for properly testing the general brain factor hypothesis because it only has measurements from one domain: size. The original authors may have more measurements they did not publish. However, one can examine the existence of the brain size factor, as a prior test of the more general hypothesis.
Age and overall brain size
As an initial check, I plotted the relationship between total brain size measures and age. These are shown in Figure 3 and 4.


Curiously, these show that the size increase only occurs up to about age 8 and 10, or so. I was under the impression that brain size continued to go up until the body in general stopped growing, around 15-20 years. This study does not appear to be inconsistent with others (e.g. Giedd, 1999). The relationship is clearly non-linear, so one will need to use the age corrections described above. To see if the correction worked, we plot the total size variables and age. There should be near-zero correlation. Results in Figures 5 and 6.


Instead we still see a slight correlation for both genders, both apparently due to a single outlier. Very odd. I examined these outliers (IDs: P0009 and P0010) but did not see anything special about them. I removed them and reran the residualization from the original data. This produced new outliers similar to before (with IDs following them). When I removed them, new ones. I figure it is due to some error with the residualization process. Indeed, a closer look revealed that the largest outliers (positive and negative) were always the first two indexes. I thus removed these before doing more analyses. The second largest outliers had no particular index. I tried removing more age outliers, but it was not possible to completely remove the correlations between age and the other variables (usually remained near r=.03). Figure 6a shows the same as Figure 6 just without the two outliers.

The genders are somewhat displaced on the age variable, but if one looks at the x-axis, one an see that this is in fact a very, very small difference.
General brain size factor with and without residualization
Results for the factor analysis without residualization are shown in Figure 7. I used the fa() function from the psych package with default settings: 1 factor extracted with the minimum residuals method. Previous studies have shown factor extraction method to be of little importance as long as it isn’t principal components with a smaller number of variables (Kirkegaard, 2014).
We see that the factors are quite similar (factor congruence .95) but that the male factor is quite a bit stronger (var% M/F 26 vs. 16). This suggests that the factor either works differently in the genders, or there is error in the results. If it is error, we should see an improvement after removing some of it. Figure 8 shows the same plot using the residualized data.
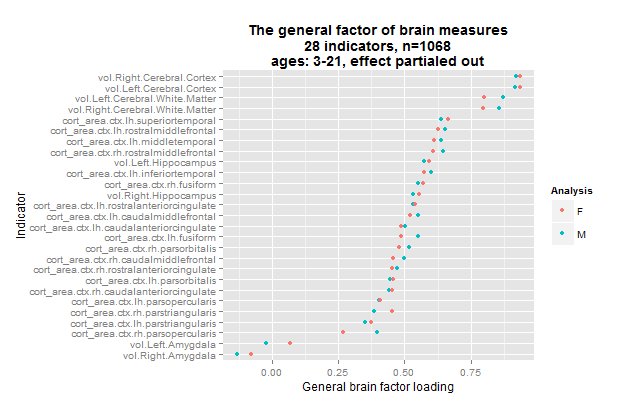
The results were more similar now and stronger for both genders (var% M/F = 34 vs. 33).
The amygdala results are intriguing, suggesting that this region does not increase in size along with the rest of the brain. The right amygdala even had negative loadings in both genders.
Using all that’s left
The next thing one might want to do is extract multiple factors. I tried extracting various solutions with nfactors 3-5. These however are bogus models due to the near-1 correlation between the brain sides. This results in spurious factors that load on just 2 variables (left and right versions) with loadings near 1. One could solve this by either averaging those with 2 measurements, or using only those from the left side. It makes little difference because they correlate so highly. It should be noted tho that doing this means one can’t see any lateralization effects such as that suggested for the right amygdala.
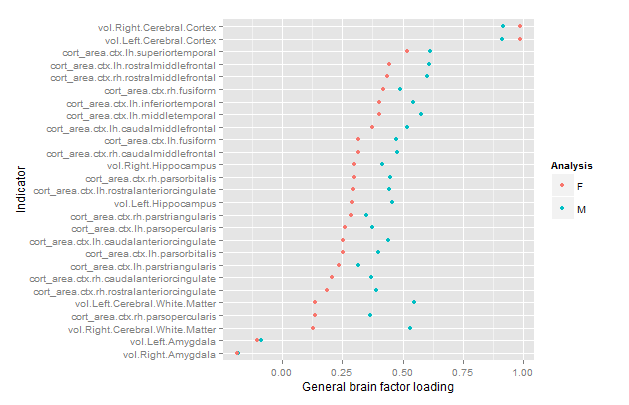
I redid all the results using the left side variables only. Figure 9 shows the results.

Now all regions had positive loadings and the var% increased a bit for both genders to 36/36. Factor congruence was 1.00, even for the non-residualized data. It thus seems that the missing measures of the right side or the use of near-doubled measures had a negative impact on the results as well.
One can calculate other measures of factor strength/internal reliability, such as the average intercorrelation, Cronbach’s alpha, Guttman’s G6. These are shown in Table 1.
| Sample | Mean r | Alpha (raw) | Alpha (std.) | G6 |
| Male | .33 | .48 | .88 | .90 |
| Female | .34 | .45 | .89 | .90 |
Multiple factors
We are now ready to explore factor solutions with more factors. Three different methods suggested extracted at most 5 factors both datasets (using nScree() from nFactors package). I extracted solutions for 2 to 6 factors for each dataset, the last included by accident. All of these were extracted with oblique rotation method of oblimin thus possibly returning correlated factors. The prediction from a hierarchical model is clear: factors extracted in this way should be correlated. Figures 10 to 14 show the factor loadings of these solutions.


So it looks like results very pretty good with 4 factors and not too good with the others. The problem with this method is that the factors extracted may be similar/identical but not in the same order and with the same name. This means that the plots above may plot the wrong factors together which defeats the entire purpose. So what we need is an automatic method of pairing up the factors correctly if possible. The exhaustive method is trying all the pairings of factors for each number of factors to extract, and then calculating some summary metrics or finding the best overall pairing combination. This would involve quite a lot of comparisons, since e.g. one can pair up set 2 sets of, say, 5 factors in 5*4/2 ways (10).
I settled for a quicker solution. For each factor solution pair, I calculated all the cross-analysis congruence factors. Then for each factor, I found the factor from the other analysis it had the highest congruence with and saved this information. This method can miss some okay but not great solutions, but I’m not overly concerned about those. In a good fit, the factors found in each analysis should map 1 to 1 to each other such that their highest congruence is with the analog factor from the other analysis.
From this information, I calculated the mean of the best congruence pairs, the minimum, and whether there was a mismatch. A mismatch occurs when two or more factors from one analysis maps to (has the highest congruence) with the same factor from the other analysis. I calculated three metrics for all the analyses performed above. The results are shown in Table 2.
| Factors.extracted | mean.best.cong | min.best.cong | factor.mismatch |
| 2 | 0.825 | 0.73 | FALSE |
| 3 | 0.713 | 0.37 | TRUE |
| 4 | 0.960 | 0.93 | FALSE |
| 5 | 0.720 | 0.35 | TRUE |
| 6 | 0.765 | 0.58 | FALSE |
As can be seen, the two analyses with 4 factors were a very good match. Those with 3 and 5 terrible as they produced factor mismatches. The analyses with 2 and 6 were also okay.
The function for going thru all the oblique solutions for two samples also returns the necessary information to match up the factors if they need reordering. If there is a mismatch, this operation is nonsensical, so I won’t re-do all the plots. The plot above with 4 factors just happens to already be correctly ordered. This however need not be the case. The only plot that needs to be redone is that with 6 factors. It is shown in Figure 15.

Compare with figure 14 above. One might wonder whether the 4 or 6 factor solutions are the best. In this case, the answer is the 4 factor solutions because the female 6 factor solution is illegal — one factor loading is above 1 (“a Heywood case”). At present, given the relatively few regional measures, and the limitation to only volume and surface measures, I would not put too much effort into theorizing about the multifactor structure found so far. It is merely a preliminary finding and may change drastically when more measures are added or measures are sampled differently.
A more important finding from all the multifactor solutions was that all produced correlated factors, which indicates a general factor.
Aggregate measures and the general brain size factor
So, the general brain size factor (GBSF) may exist, but is it useful? At first, we may want to correlate the various aggregate variables. Results are in Table 3.
| cort_area.ctx.total | cort_area.ctx.lh.total | vol.WholeBrain | vol.IntracranialVolume | GBSF | |
| cort_area.ctx.total | 0.997 | 0.869 | 0.746 | 0.953 | |
| cort_area.ctx.lh.total | 0.997 | 0.867 | 0.751 | 0.953 | |
| vol.WholeBrain | 0.832 | 0.832 | 0.822 | 0.923 | |
| vol.IntracranialVolume | 0.638 | 0.642 | 0.798 | 0.776 | |
| GBSF | 0.950 | 0.950 | 0.905 | 0.711 |
Notes: Correlations above diagonal are males, below females.
The total areas of the brain are almost symmetrical: the correlation of the total surface area and left side only is a striking .997. Intracranial volume is a decent proxy (.822) for whole brain volume, but is somewhat worse for total surface area (.746). GBSF has very strong correlations with the surface areas (.95), but not quite as strong as the analogous situation in cognitive data: IQ and extracted general factor (GCA factor) usually correlate .99 with a reasonable sample of subtests: Ree and Earles (1991) reported that an average GCA factor correlated .991 with an unweighted sum score in a sample of >9k, Kirkegaard (2014b) found a .99 correlation between extracted GCA and an unweighted sum in a Dutch university sample of ~500.
Correlations with cognitive measures
The authors have data for 4 cognitive tests, however, data are only public for 2 of them. These are in the authors’ words:
Flanker inhibitory control test (N = 1,074).
The NIH Toolbox Cognition Battery version of the flanker task was adapted from the Attention Network Test (ANT). Participants were presented with a stimulus on the center of a computer screen and were required to indicate the left-right orientation while inhibiting attention to the flankers (surrounding stimuli). On some trials the orientation of the flankers was congruent with the orientation of the central stimulus and on the other trials the flankers were incongruent. The test consisted of a block of 25 fish trials (designed to be more engaging and easier to see to make the task easier for children) and a block of 25 arrow trials, with 16 congruent and 9 incongruent trials in each block, presented in pseudorandom order. Participants who responded correctly on 5 or more of the 9 incongruent trials then proceeded to the arrows block. All children age 9 and above received both the fish and arrows blocks regardless of performance. The inhibitory control score was based on performance on both congruent and incongruent trials. A two-vector method was used that incorporated both accuracy and reaction time (RT) for participants who maintained a high level of accuracy (>80% correct), and accuracy only for those who did not meet this criteria. Each vector score ranged from 0 to 5, for a maximum total score of 10 (M = 7.67, s.d. = 1.86).
List sorting working memory test (N = 1,084).
This working memory measure requires participants to order stimuli by size. Participants were presented with a series of pictures on a computer screen and heard the name of the object from a speaker. The test was divided into the One-List and Two-List conditions. In the One-List condition, participants were told to remember a series of objects (food or animals) and repeat them in order, from smallest to largest. In the Two-List condition, participants were told to remember a series of objects (food and animals, intermixed) and then again report the food in order of size, followed by animals in order of size. Working memory scores consisted of combined total items correct on both One-List and Two-List conditions, with a maximum of 28 points (M = 17.71, s.d. = 5.39).
I could not locate a factor analytic study for the Flanker test, so I don’t know how g-loaded it is. Working memory (WM) is known to have a strong relationship to GCA (Unsworth et al, 2014). The WM variable should probably be expected to be the most g-loaded of the two. The implication given the causal hypothesis of brain size for GCA is that the WM test should show higher correlations to the brain measures. Figures X and X show the histograms for the cognitive measures.


Note that the x-values do not have any interpretation as they are the residual raw values, not raw values. For the Flanker test, we see that it is bimodal. It seems that a significant part of the sample did not understand the test and thus did very poorly. One should probably either remove them or use a non-parametric measure if one wanted to rely on this variable. I decided to remove them since the sample was sufficiently large that this wasn’t a big problem. The procedure reduced the skew from -1.3/-1.1 to -.2/-.1 respectively for the male and female samples. The sample sizes were reduced from 548/516 to 522/487 respectively. One could plausibly combine them into one measure which would perhaps be a better estimate of GCA than either of them alone. This would be the case if their g-loading was about similar. If however, one is much more g-loaded than the other, it would degrade the measurement towards a middle level. I combined the two measures by first normalizing them (to put them on the same scale) and then averaging them.
Given the very high correlations between the GBSF of these data and the other aggregate measures, it is not expected that the GBSF will correlate much more strongly with cognitive measures than the other aggregate brain measures. Table X shows the correlations.
| Variable | WM | Flanker | Combined | WM | Flanker | Combined |
| Males | Females | |||||
| WM | ||||||
| Flanker | 0.407 | 0.393 | ||||
| WM.Flanker.mean | 0.830 | 0.847 | 0.824 | 0.845 | ||
| cort_area.ctx.total | 0.302 | 0.138 | 0.235 | 0.236 | 0.201 | 0.237 |
| cort_area.ctx.lh.total | 0.302 | 0.137 | 0.235 | 0.239 | 0.203 | 0.238 |
| vol.WholeBrain | 0.263 | 0.103 | 0.201 | 0.158 | 0.120 | 0.146 |
| vol.IntracranialVolume | 0.213 | 0.101 | 0.170 | 0.154 | 0.101 | 0.137 |
| GBSF | 0.311 | 0.147 | 0.252 | 0.223 | 0.181 | 0.218 |
As for the GBSF, given that it is a ‘distillate’ (Jensen’s term), one would expect it to have slightly higher correlations with the cognitive measures than the merely unweighted ‘sum’ measures. This was the case for males, but not females. In general, the female correlations were weaker, especially the whole brain volume x WM (.263 vs. .158). Despite the large sample sizes, this difference is not very certain, the 95% confidence intervals are -.01 to .22. A larger sample is necessary to examine this question. The finding is intriguing is that if real, it would pose an alternative solution to the Ankney-Rushton anomaly, that is, the fact that males have greater brain size and this is related to IQ scores, but do not consistently perform better on IQ tests (Jackson and Rushton, 2006). Note however that the recent large meta-analysis of brain size x IQ studies did not find an effect of gender, so perhaps the above results are a coincidence (Pietschnig et al 2014).
We also see that the total cortical area variables were stronger correlates of cognitive measures than whole brain volume, but a larger sample is necessary to confirm this pattern.
Lastly, we see a moderately strong correlation between the two cognitive measures (≈.4). The combined measure was a weaker correlate of the criteria variables, which is what is expected if the Flanker test was a relatively weaker test of GCA than the WM one.
Correlations with parental education and income
It is time to revisit the results reported by the original authors, namely correlations between educational/economic variables and brain measures. I think the correlations between specific brain regions and criteria variables is mostly a fishing expedition of chance results (multiple testing) and of no particular interest unless strong predictions can be made before looking at the data. For this reason, I present only correlations with the aggregate brain measures, as seen in Table X.
| Variable | ED | ln_Inc | Income | ED | ln_Inc | Income |
| Males | Females | |||||
| WM | 0.131 | 0.192 | 0.175 | 0.170 | 0.229 | 0.174 |
| Flanker | 0.163 | 0.180 | 0.188 | 0.118 | 0.131 | 0.106 |
| WM.Flanker.mean | 0.168 | 0.215 | 0.206 | 0.178 | 0.215 | 0.165 |
| cort_area.ctx.total | 0.104 | 0.217 | 0.207 | 0.128 | 0.173 | 0.154 |
| cort_area.ctx.lh.total | 0.108 | 0.215 | 0.208 | 0.133 | 0.170 | 0.152 |
| vol.WholeBrain | 0.103 | 0.190 | 0.195 | 0.064 | 0.112 | 0.078 |
| vol.IntracranialVolume | 0.126 | 0.157 | 0.159 | 0.086 | 0.104 | 0.100 |
| GBSF | 0.109 | 0.206 | 0.204 | 0.100 | 0.157 | 0.137 |
| ED | 0.559 | 0.542 | 0.561 | 0.513 | ||
| ln_Inc | 0.559 | 0.866 | 0.561 | 0.855 | ||
| Income | 0.542 | 0.866 | 0.513 | 0.855 | ||
Here the correlations of the combined cognitive measure was higher than WM, unlike before, so perhaps the diagnosis from before was wrong. In general, the correlations of income and brain measures were stronger than that for education. This is despite the fact that GCA is more strongly correlated to educational attainment than income. This was however not the same in this sample: correlations of WM and Flanker were stronger with the economic variables. Perhaps there is more range restriction in the educational variable than the income one. An alternative environmental interpretation is that it is the affluence that causes the larger brains.
If we recall the theoretic predictions of the strength of the correlations, the incomes are stronger than expected (actual .19/.09 M/F, predicted about .05), while the educational ones are a bit weaker than expected (actual .1/.6, predicted about .13). However, the sample sizes are not larger enough for these results to be certain enough to question the theory.
Racial admixture
To me surprise, the sample had racial admixture data. This is surprising because such data has been available to testing the genetic hypothesis of group differences for many years, apparently without anyone publishing something on the issue. As I argued elsewhere, this is odd given that a good dataset would be able to decisively settle the ‘race and intelligence’ controversy (Dalliard, 2014; Rote and Rodgers, 2005; Rushton and Jensen, 2005). It is actually very good evidence for the genetic hypothesis because if it was false, and these datasets showed it, it would have been a great accomplishment for a mainstream scientist to publish a paper decisively showing that it was indeed false. However, if it was true, then any mainstream scientist could not publish it without risking personal assaults, getting fired and possibly pulled in court as were academics who previously researched that topic (Gottfredson, 2005; Intelligence 1998; Nyborg 2011; 2003).
The genomic data however appeared to be an either/or (1 or 0) variable in the released data files. Oddly, some persons had no value for any racial group. It turns out that the data was merely rounded in the spreadsheet file. This explained why some persons had 0 for all groups: These persons did not belong at least 50% to any racial group, and thus they were assigned a 0 in every case.
I can think of two ways to count the number of persons in the main categories. One can count the total ‘summed’ persons. In this way, if person A has 50% ancestry from race R, and person B has 30%, this would sum to .8 persons. One can think of it as the number of pure-breed persons’ worth of ancestry from that that group. Another way is to count everybody as 1 who is above some threshold for ancestry. I chose to use 20% and 80% for thresholds, which correspond with persons with substantial ancestry from that racial cluster, and persons with mostly ancestry from that cluster. One could choose other values of course, and there is a degree of arbitrariness, but it is not important what the particular values are.
Results are in Table X.
| Racial group | European | African | Amerindian | East Asian | Oceanian | Central Asia | Sum |
| Summed ancestry ‘persons’ | 686.364 | 134.2714 | 48.31457 | 163.49868 | 8.59802 | 26.95408 | 1068.00075 |
| Persons with >20% | 851 | 187 | 89 | 238 | 8 | 30 | 1403 |
| Persons with >80% | 647 | 105 | 3 | 121 | 0 | 21 | 897 |
Note that the number 1068 is the exact number of persons in the complete sample, which means that the summed ancestry for all groups has an error of a mere .00075.
Another way of understanding the data is to plot histograms of each racial group. These are shown below in Figures X to X.


Since European ancestry is the largest, the other plots are mostly empty except for the 0% bar. But we do see a fair amount of admixture in the dataset.
Regression, residualization, correlation and power
There are a couple of different methods one could use to examine the admixture data. A simple correlation is justified when dealing with a group that only has 2 sources of ancestry. This is the easiest case to handle. For this to work, the groups most have a different genotypic mean of the trait in question (GCA and brain size variables in this case) and there must be a substantially admixtured population. Even given a large hypothesized genotypic difference, the expected correlation is actually quite small. For African Americans (such as those in the sample), their European ancestry% is about 15-25% depending on the exact sample. The standard deviation of their European ancestry% is not always reported, but one can calculate it if one has some data, which we do.
The first problem with this dataset is that there are no sociological race categories (“white”, “African American”, “Hispanic”, “Asian” etc.), but only genomic data. This means that to get an African American subsample, we must create one based on actual actual ancestry. There are two criteria that needs to be met for inclusion in that group: 1) the person must be substantially African, 2) the person must be mostly a mix of European and African ancestry. Going with the values from before, this means that the person must be at least 20% African, and at least 80% combined European and African.
Dealing with scanner and site
There are a variety of ways to use the data and they may or may not give similar results. First is the question of which variables to control for. In the earlier sections of this paper, I controlled for Age, Age2, Age3, Scanner (12 different). For producing the above ancestry plots and results I did not control for anything. Controlling the ancestry variables for scanner is problematic as people from different races live in different places. Controlling for this thus removes the racial differences for no reason. One could similarly control for site where the scanner is (I did not do this earlier). We can compare this to scanner by a contingency table, as shown in Table X below:
| Site/scanner | 0 | 1 | 10 | 11 | 12 | 2 | 3 | 4 | 5 | 6 | 7 | 8 | 9 |
| Cornel | 0 | 0 | 0 | 96 | 0 | 0 | 0 | 0 | 0 | 0 | 0 | 0 | 0 |
| Davis | 0 | 0 | 0 | 0 | 0 | 0 | 0 | 0 | 0 | 0 | 114 | 0 | 0 |
| Hawaii | 0 | 0 | 0 | 0 | 0 | 0 | 0 | 0 | 0 | 202 | 0 | 0 | 0 |
| KKI | 0 | 0 | 0 | 0 | 0 | 0 | 103 | 0 | 0 | 0 | 0 | 0 | 0 |
| MGH | 0 | 0 | 0 | 0 | 0 | 0 | 0 | 0 | 115 | 0 | 0 | 0 | 13 |
| UCLA | 0 | 0 | 27 | 0 | 22 | 0 | 0 | 10 | 0 | 0 | 0 | 0 | 0 |
| UCSD | 109 | 93 | 0 | 0 | 0 | 0 | 0 | 0 | 0 | 0 | 0 | 0 | 0 |
| UMMS | 0 | 0 | 0 | 0 | 0 | 56 | 0 | 0 | 0 | 0 | 0 | 0 | 0 |
| Yale | 0 | 0 | 0 | 0 | 0 | 0 | 0 | 0 | 0 | 0 | 0 | 108 | 0 |
As we can see, these are clearly inter-dependent, given the obvious fact that the scanners have a particular location and was not moved around (all columns have only 1 cell with value>0). Some sites however have multiple scanners, some have only one. E.g. UCSD has two scanners (#0 and #1), while KKI has only one (#3).
Controlling for scanner however makes sense if we are looking at brain size variables, as this removes differences between measurements due to differences in the scanning equipment or (post-)processing. So perhaps one would want to control brain measurements for scanner and age effects, but only control the remaining variables for age affects.
Dealing with gender
As before
To be continued…
References
-
Ashton, M. C., Lee, K., & Visser, B. A. (2014a). Higher-order g versus blended variable models of mental ability: Comment on Hampshire, Highfield, Parkin, and Owen (2012). Personality and Individual Differences, 60, 3-7.
-
Ashton, M. C., Lee, K., & Visser, B. A. (2014b). Orthogonal factors of mental ability? A response to Hampshire et al. Personality and Individual Differences, 60, 13-15.
-
Ashton, M. C., Lee, K., & Visser, B. A. (2014c). Further response to Hampshire et al. Personality and Individual Differences, 60, 18-19.
-
Beaujean, A. A. (2014). Latent Variable Modeling Using R: A Step by Step Guide: A Step-by-Step Guide. Routledge.
- Bouchard Jr, T. J. (2014). Genes, Evolution and Intelligence. Behavior genetics, 44(6), 549-577.
-
Button, K. S., Ioannidis, J. P., Mokrysz, C., Nosek, B. A., Flint, J., Robinson, E. S., & Munafò, M. R. (2013). Power failure: why small sample size undermines the reliability of neuroscience. Nature Reviews Neuroscience, 14(5), 365-376.
-
Colom, R., & Thompson, P. M. (2011). Intelligence by Imaging the Brain. The Wiley-Blackwell handbook of individual differences, 3, 330.
-
Cudeck, R., & MacCallum, R. C. (Eds.). (2012). Factor analysis at 100: Historical developments and future directions. Routledge.
- Dalliard, M. (2013). Is Psychometric g a Myth?. Human Varieties.
- Dalliard, M. (2014). The Elusive X-Factor: A Critique of J. M. Kaplan’s Model of Race and IQ. Open Differential Psychology.
-
Deary, I. J., & Caryl, P. G. (1997). Neuroscience and human intelligence differences. Trends in Neurosciences, 20(8), 365-371.
-
Deary, I. J., Penke, L., & Johnson, W. (2010). The neuroscience of human intelligence differences. Nature Reviews Neuroscience, 11(3), 201-211.
- Dekaban, A.S. and Sadowsky, D. (1978). Changes in brain weights during the span of human life: relation of brain weights to body heights and body weights, Ann. Neurology, 4:345-356.
-
Euler, M. J., Weisend, M. P., Jung, R. E., Thoma, R. J., & Yeo, R. A. (2015). Reliable Activation to Novel Stimuli Predicts Higher Fluid Intelligence. NeuroImage.
-
Frangou, S., Chitins, X., & Williams, S. C. (2004). Mapping IQ and gray matter density in healthy young people. Neuroimage, 23(3), 800-805.
-
Giedd, J. N., Blumenthal, J., Jeffries, N. O., Castellanos, F. X., Liu, H., Zijdenbos, A., … & Rapoport, J. L. (1999). Brain development during childhood and adolescence: a longitudinal MRI study. Nature neuroscience, 2(10), 861-863.
- Gottfredson, L. S. (2005). Suppressing intelligence research: Hurting those we intend to help. In R. H. Wright & N. A. Cummings (Eds.), Destructive trends in mental health: The well-intentioned path to harm (pp. 155-186). New York: Taylor and Francis.
-
Haier, R. J., Karama, S., Colom, R., Jung, R., & Johnson, W. (2014a). A comment on “Fractionating Intelligence” and the peer review process. Intelligence, 46, 323-332.
-
Haier, R. J., Karama, S., Colom, R., Jung, R., & Johnson, W. (2014b). Yes, but flaws remain. Intelligence, 46, 341-344.
-
Hampshire, A., Highfield, R. R., Parkin, B. L., & Owen, A. M. (2012). Fractionating human intelligence. Neuron, 76(6), 1225-1237.
-
Hampshire, A., Parkin, B., Highfield, R., & Owen, A. M. (2014). Response to:“Higher-order g versus blended variable models of mental ability: Comment on Hampshire, Highfield, Parkin, and Owen (2012)”. Personality and Individual Differences, 60, 8-12.
-
Henrich, J., Heine, S. J., & Norenzayan, A. (2010). The weirdest people in the world?. Behavioral and brain sciences, 33(2-3), 61-83.
- Intelligence. (1998). Special issue dedicated to Arthur Jensen. Volume 26, Issue 3.
-
Jackson, D. N., & Rushton, J. P. (2006). Males have greater g: Sex differences in general mental ability from 100,000 17-to 18-year-olds on the Scholastic Assessment Test. Intelligence, 34(5), 479-486.
-
Jensen, A. R., & Weng, L. J. (1994). What is a good g?. Intelligence, 18(3), 231-258.
- Jensen, A. R. (1997). The psychometrics of intelligence. In H. Nyborg (Ed.), The scientific study of human nature: Tribute to Hans J. Eysenck at eighty. New York: Elsevier. Pp. 221—239.
- Jensen, A. R. (1998). The g Factor: The Science of Mental Ability. Preager.
-
Jensen, A. R. (2002). Psychometric g: Definition and substantiation. The general factor of intelligence: How general is it, 39-53.
-
Jensen, A. R. (2006). Clocking the mind: Mental chronometry and individual differences. Elsevier.
- Jung, R. E. & Haier, R. J. (2007). The Parieto-Frontal Integration Theory (P-FIT) of intelligence: converging neuroimaging evidence. Behav. Brain Sci. 30, 135–154; discussion 154–187.
- Jung, R. E. et al. (2009). Imaging intelligence with proton magnetic resonance spectroscopy. Intelligence 37, 192–198.
-
Jöreskog, K. G. (1996). Applied factor analysis in the natural sciences. Cambridge University Press.
-
Kim, S. E., Lee, J. H., Chung, H. K., Lim, S. M., & Lee, H. W. (2014). Alterations in white matter microstructures and cognitive dysfunctions in benign childhood epilepsy with centrotemporal spikes. European Journal of Neurology, 21(5), 708-717.
-
Kirkegaard, E. O. W. (2014a). The international general socioeconomic factor: Factor analyzing international rankings. Open Differential Psychology.
- Kirkegaard, E. O. W. (2014b). The personal Jensen coefficient does not predict grades beyond its association with g. Open Differential Psychology.
- Li, Y. et al. (2009). Brain anatomical network and intelligence. PLoS Comput. Biol. 5, e1000395.
-
Navas‐Sánchez, F. J., Alemán‐Gómez, Y., Sánchez‐Gonzalez, J., Guzmán‐De‐Villoria, J. A., Franco, C., Robles, O., … & Desco, M. (2014). White matter microstructure correlates of mathematical giftedness and intelligence quotient. Human brain mapping, 35(6), 2619-2631.
- Neubauer, A. C. & Fink, A. (2009). Intelligence and neural efficiency. Neurosci. Biobehav. Rev. 33, 1004–1023.
-
Noble, K. G., Houston, S. M., Brito, N. H., Bartsch, H., Kan, E., Kuperman, J. M., … & Sowell, E. R. (2015). Family income, parental education and brain structure in children and adolescents. Nature Neuroscience.
-
Nyborg, H. (2003). The sociology of psychometric and bio-behavioral sciences: A case study of destructive social reductionism and collective fraud in 20th century academia. Nyborg H.(Ed.). The scientific study of general intelligence. Tribute to Arthur R. Jensen, 441-501.
-
Nyborg, H. (2011). The greatest collective scientific fraud of the 20th century: The demolition of differential psychology and eugenics. Mankind Quarterly, Spring Issue.
-
Pennington, B. F., Filipek, P. A., Lefly, D., Chhabildas, N., Kennedy, D. N., Simon, J. H., … & DeFries, J. C. (2000). A twin MRI study of size variations in the human brain. Journal of Cognitive Neuroscience, 12(1), 223-232.
-
Pietschnig, J., Penke, L., Wicherts, J. M., Zeiler, M., & Voracek, M. (2014). Meta-Analysis of Associations Between Human Brain Volume And Intelligence Differences: How Strong Are They and What Do They Mean?. Available at SSRN 2512128.
-
Ree, M. J., & Earles, J. A. (1991). The stability of g across different methods of estimation. Intelligence, 15(3), 271-278.
-
Rowe, D. C., & Rodgers, J. E. (2005). Under the skin: On the impartial treatment of genetic and environmental hypotheses of racial differences. American Psychologist, 60(1), 60.
- Rushton, J. P., & Jensen, A. R. (2005). Thirty years of research on race differences in cognitive ability. Psychology, public policy, and law, 11(2), 235.
- Shaw, P. et al. (2006). Intellectual ability and cortical development in children and adolescents. Nature 440, 676–679 (2006).
-
Sterne, J. A., White, I. R., Carlin, J. B., Spratt, M., Royston, P., Kenward, M. G., … & Carpenter, J. R. (2009). Multiple imputation for missing data in epidemiological and clinical research: potential and pitfalls. Bmj, 338, b2393.
-
Strenze, T. (2007). Intelligence and socioeconomic success: A meta-analytic review of longitudinal research. Intelligence, 35(5), 401-426.
- Turken, A. et al. (2008). Cognitive processing speed and the structure of white matter pathways: convergent evidence from normal variation and lesion studies. Neuroimage 42, 1032–1044
-
Unsworth, N., Fukuda, K., Awh, E., & Vogel, E. K. (2014). Working memory and fluid intelligence: Capacity, attention control, and secondary memory retrieval. Cognitive psychology, 71, 1-26.