Suppose you have some dataset where you know or suspect that the real generating function is actually a piecewise function with k pieces each of which is a standard linear model. How does you find these? This is the problem presented to me from a friend. I came up with this method:
- Find all the ways, w, to chop up the dataset into 3 groups, each with at least 3 datapoints in it.
- For each w, fit a linear model to each sub-dataset. Calculate the n-weighted R2 for the three fits. Save this.
- Sort the ways of splitting the data by the weighted R2 value.
The reason to have at least 3 datapoints is that linear regression does not work with 2. The reason to use weighted R2s is that otherwise the function would tend to overfit by choosing small pieces with perfect fit.
Does the method work? Well, to find out, I also had to write a test data generator. This will generate data following the above model, and also with specific and predictable slopes for each of the pieces. It can also add noise. For example, here’s an example dataset, colored for convenience.
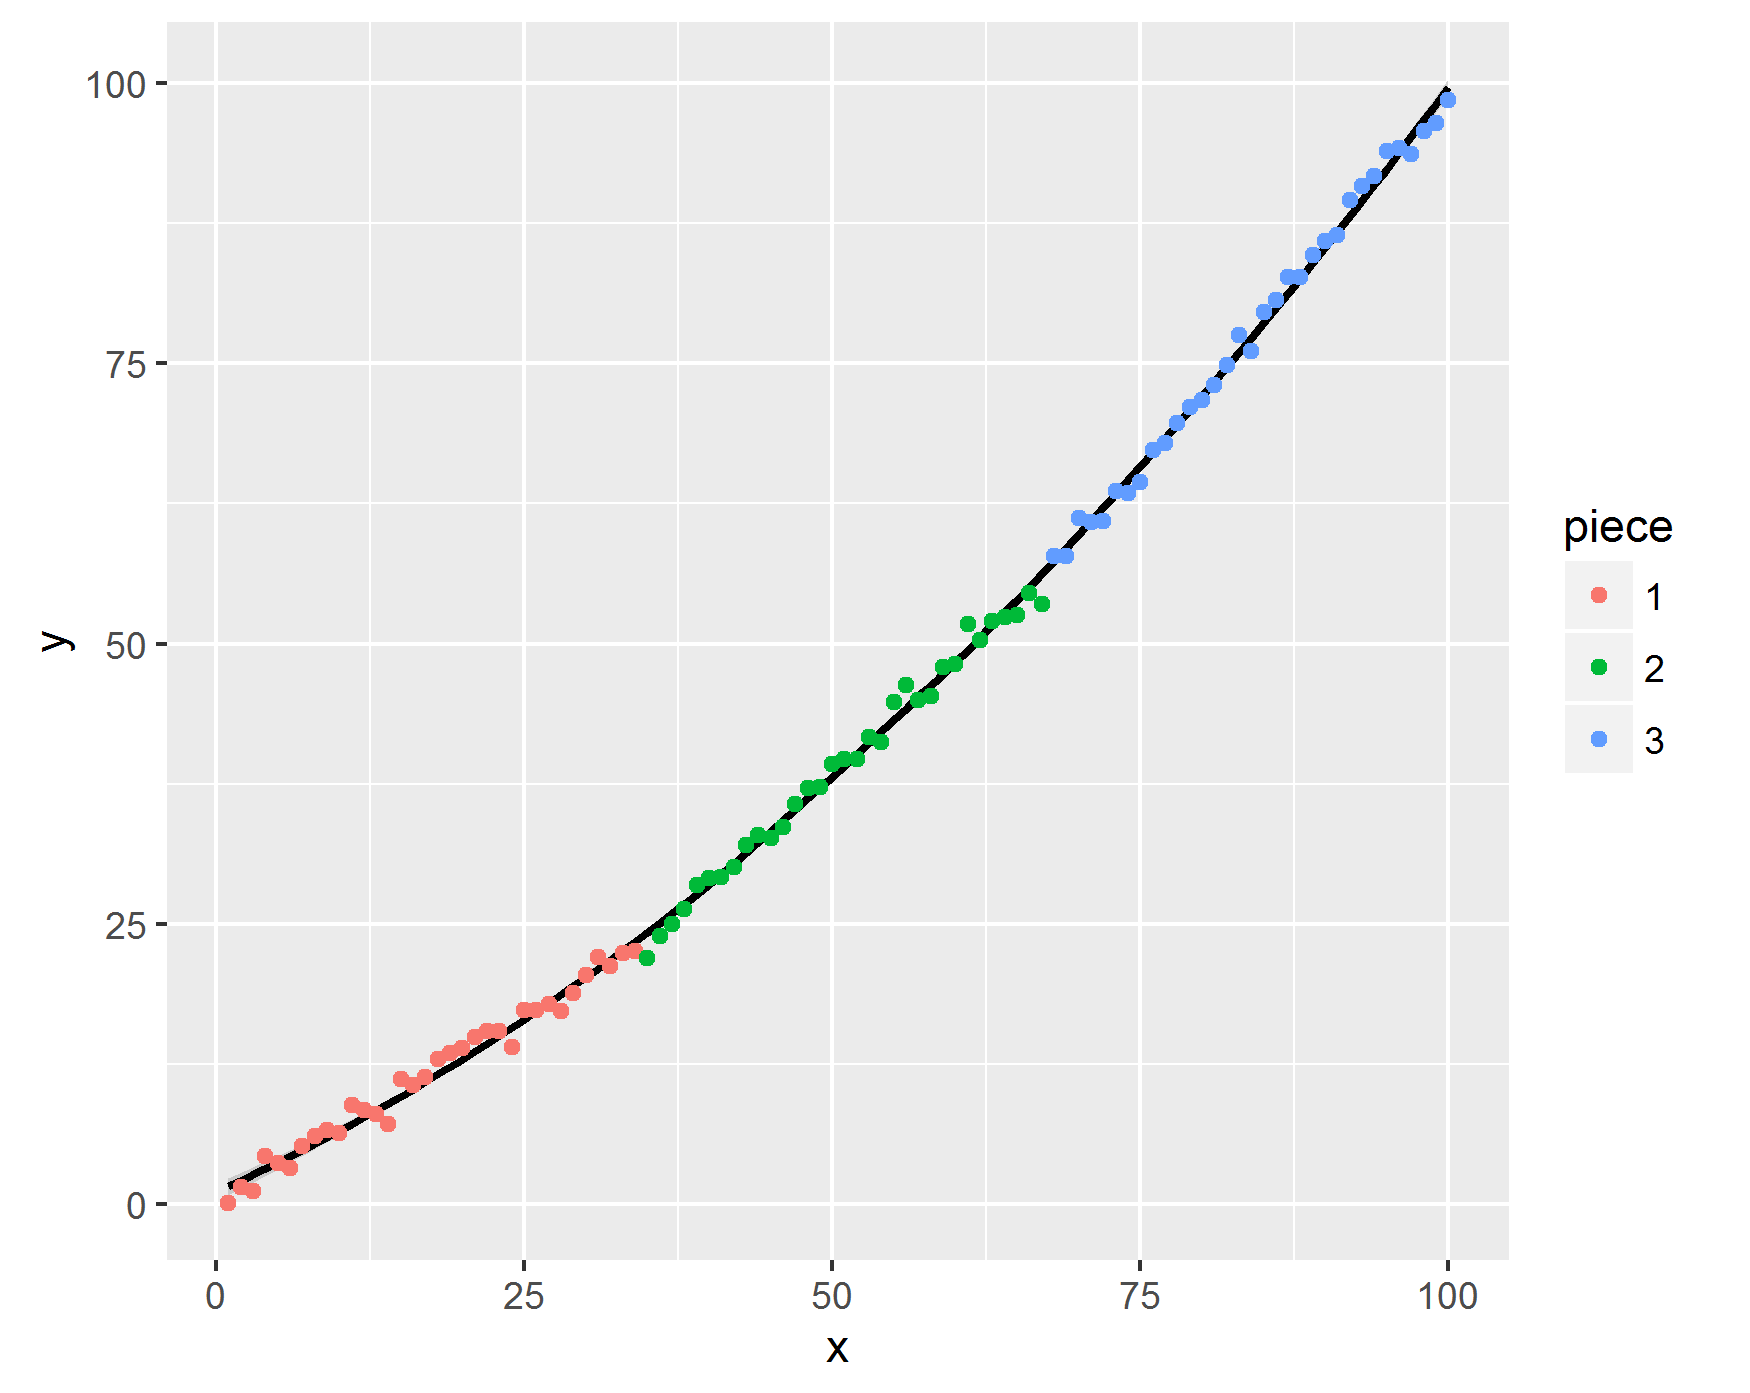
The generator function always generates data in this format, i.e. where there is a constant increase in the slopes. This is because this is how his data approximately looks like. This kind of data is more difficult to handle. If the data instead had a /\/ format, it would be much easier to find the breakpoints.
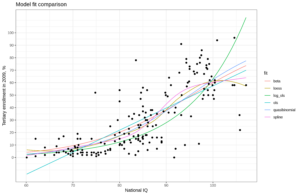
Fitting the piecewise linear models to this, we get the following estimated best fits:
| Split# | cutoff_1 | cutoff_2 | r2 |
| 7539 | 39 | 76 | 0.98985 |
| 6638 | 38 | 67 | 0.989844 |
| 6639 | 39 | 67 | 0.989829 |
| 7538 | 38 | 76 | 0.989816 |
| 6438 | 38 | 65 | 0.98981 |
| 6439 | 39 | 65 | 0.989761 |
| 4846 | 46 | 49 | 0.989736 |
| 6435 | 35 | 65 | 0.989722 |
| 6538 | 38 | 66 | 0.989706 |
| 7439 | 39 | 75 | 0.989703 |
So, we see that the R2 values are all nearly the same. Still, the estimates generally agree that the best way to split the data is around value 39 and 67-76. Looking back at the plot, we see that these are about the right values: they are 35 and 68.
split # 4846 is clearly the type of solution I was trying to avoid using the weighted R2s, but apparently not entirely successful.
Combinatorial explosion
One problem with the developed method is that it quickly gets very slow. In the case where we have 100 observations and 3 pieces, there are an initial 1003 = 10,000 ways to split the data to check. Some of these are impossible because the breaks are in an impossible order: e.g., the breakpoint that separates piece 1 and 2 must be before the breakpoint that separates piece 2 and 3. After removing these, there are 4950 ways to split left. Others are impossible because they result in sub-datasets with fewer than 3 observations. Still, this leaves us with 4278. For each of these, one must fit 3 linear models, so that’s about 13,000 linear models to fit. With parallel processing (from plyr package with doParallel) this takes about 10 seconds in total. However, it quickly takes much longer if we specify that there are more pieces or more data.
To get around this problem for larger datasets, one could trim the possible splits. Or one could use genetic algorithms to explore the space faster.
Code
https://osf.io/6zn7p/files/