In many ways, my science — and my colleagues’ science — generally involves collecting evidence for obvious hypotheses that are mainly denied by leftist-leaning people (more precisely, egalitarian). Here’s a brief review.
Stereotypes about major demographic groups are quite accurate
Jussim of course already showed this, but since it’s still frequently denied, seems that we need more evidence still. We added some to this about immigrant groups in Denmark (Kirkegaard & Bjerrekær 2016). Aggregate stereotype accuracy for use of welfare was high. In a figure:
Stereotypes are biased in favor of Muslim groups
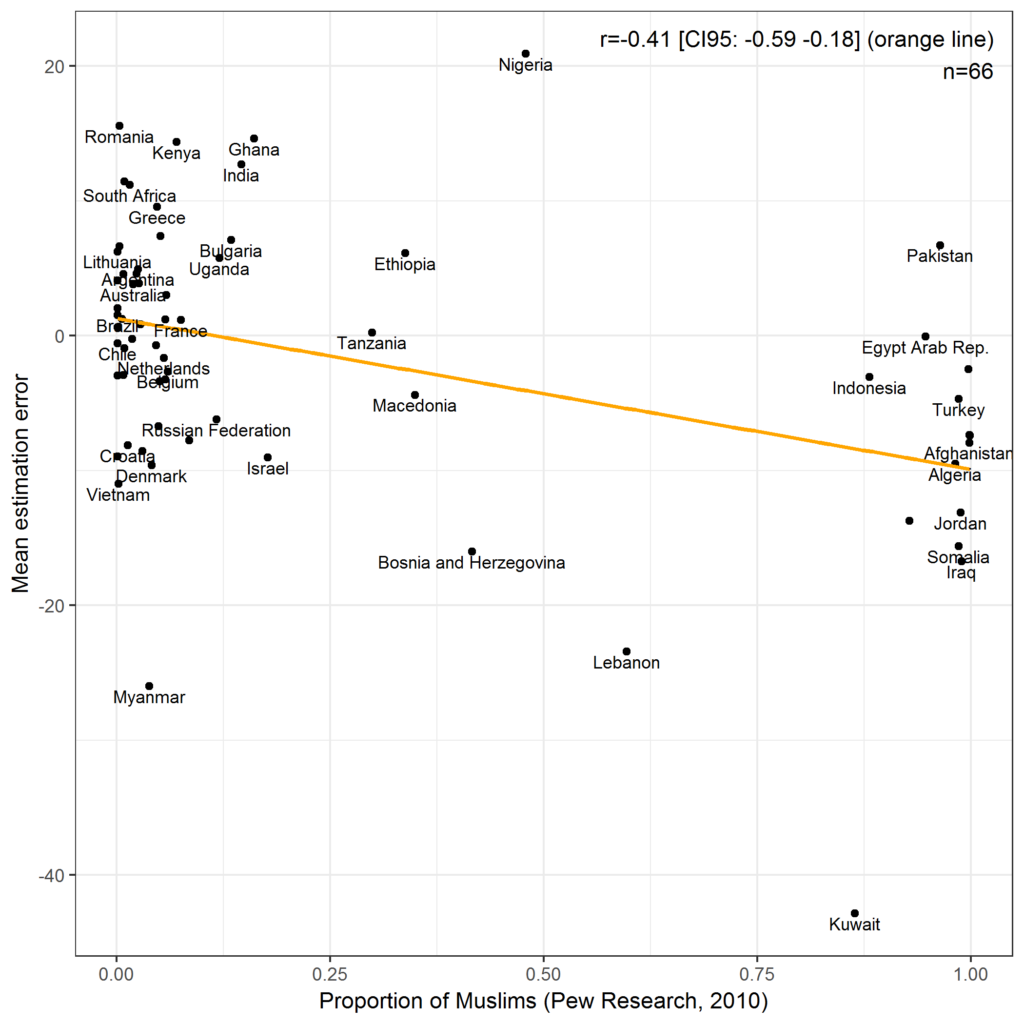
When stereotypes deviate from the truth, they do so in a way that is in favor of Muslims (same study as above). In a figure:
So, on average, the average estimate of mostly Muslim groups’ use of welfare was off by about -10%points, i.e. they use welfare about 10%points more than people on average think they do.
Using accurate stereotypes makes for more accurate judgments
Jussim has discussed this in detail (see this post) but it’s really quite simple. Stereotypes can be used to inform the prior in a judgment, and since stereotypes tend to be more accurate than nothing, this has the effect of boosting the accuracy of judgments. It’s a straightforward application of Bayes’ theorem.
(Unfortunately, no neat visualization of this)
People form social policies based on their accurate stereotypes to inform their policy decisions
This is basically a corollary of the above, but since people have somewhat accurate ideas of which groups perform well in society, it stands to reason they use these beliefs to inform which immigrants they would like more of and which they don’t. Noah Carl (2016) tested this rather obvious idea in British data. In a figure:
Intelligence matters at the group level, a lot
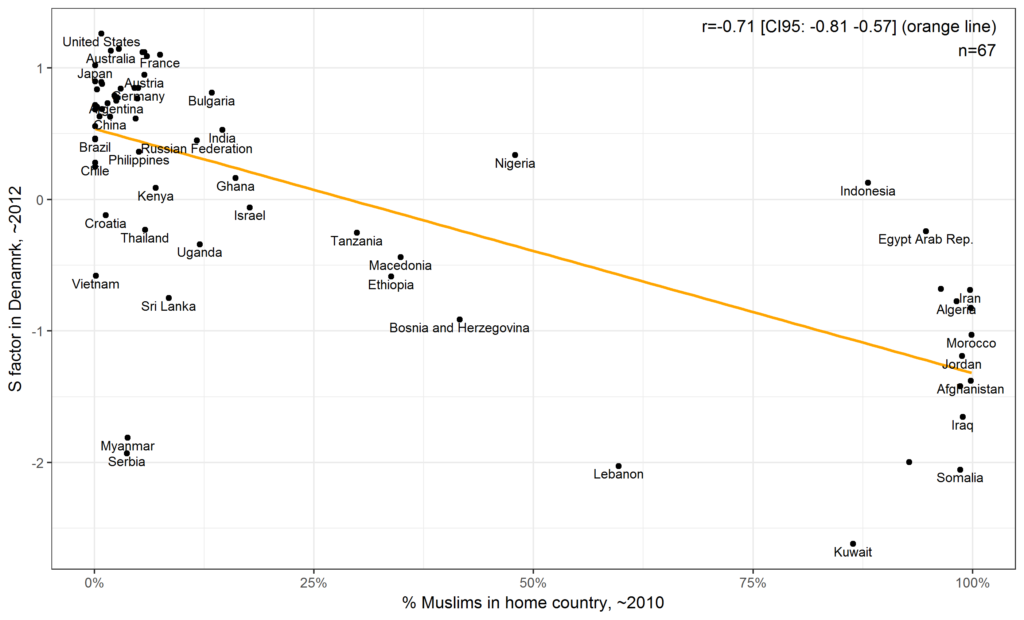
Decades of research shows intelligence (general cognitive ability etc.) to be important at the individual level. Aggregating data tends to aggregate effect sizes because other sources of variation cancel out. So, is intelligence important at the group level too? Sure thing. National level (Kirkegaard 2014):
(Here S factor is an aggregate measure of social indicators.)
A particular annoyance is when researchers consistently rely on small, easy to get datasets and basically produce a lot of unreliable findings. The most common example of this is probably US states, n=50, to which people fit endless numbers of complicated regression models. So I gathered county-level data from the US, n≈3100 (Kirkegaard 2016). What do they show?
In general, it does not matter much which country one examines. Here’s Noah Carl’s (2016) data for UK ‘local authorities’:
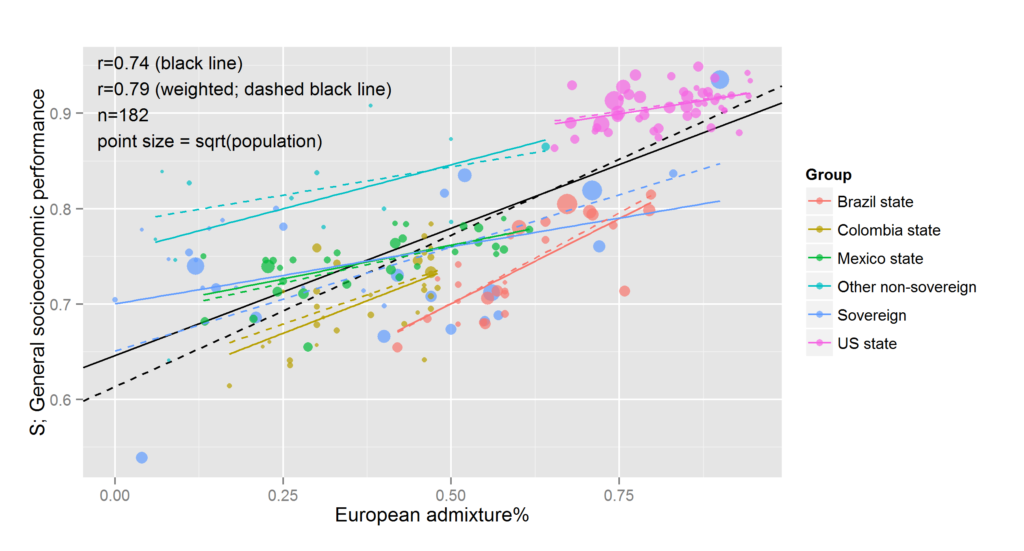
Here’s the main results from our rather large pan-American study, using both national and subnational units (Fuerst & Kirkegaard, 2016):
(Unfortunately, did not make a plot with colors for subnational units for the IQ x S relationship.)
Group performance is mostly just average individual performance
This one is pretty obvious, but people like to posit all kinds of weird causes, see neat recent study by Bates and Gupta (2017). Looks like this:
This finding will need more replication because the original study has by now already received 700 citations or something and has been cited endlessly for social policy. In general, it’s wise to wait for a meta-analysis of and some pre-registered large-scale replications of something before trying to use it for policy.
Immigrant group performance is easy to predict
A related finding to the above is that immigrant group performance is easy to predict. Since immigrant groups differ a lot in intelligence and in their % of Muslims, and these both seem to be important causes in explaining relative social performance, one gets results like these (Kirkegaard & Fuerst 2014):
These results were also found for a bunch of other countries including Norway, Germany, Netherlands, Finland, and the US. More are on their way.
More Muslims means more Muslim terrorism
Noah has been playing with fire lately (Noah Carl 2016). We know that Muslims commit a lot of terrorism, and thus it stands to reason that if some place has more Muslims, they are likely to have more Muslim terrorism too. It’s essentially the claim that Muslims have some fairly stable per capita terrorism rate (see also). Obviously, there’s a lot of noise because terrorism is rare and many countries have few Muslims i.e. little variation in the predictor. Still, we get findings like these:
The second plot shows the also rather obvious idea that if your country takes part in military actions against Muslim countries, Muslims get upset and attack your country back. If you don’t want to get attacked, don’t attack other people!
Lately, Noah’s been extending these findings to the worldwide national level, which produced similar findings (In review).
This is not to say that other groups don’t also commit terrorism. If we had some good measures of standard leftist ‘meeting terrorism’ (ANTIFA and friends) and number of leftist extremists, I’m sure these would also relate strongly. Presumably also the same for nationalist extremists, but there’s so few of them in Western Europe that it would be hard to spot the signal.
Group differences in intelligence and S are to a large extent genetic in origin
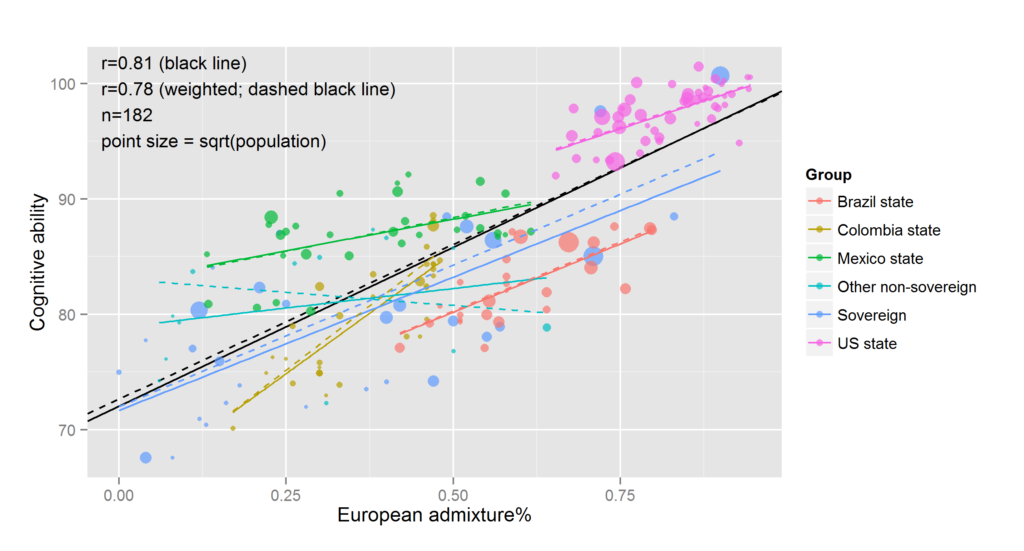
The evidence for this was strong in 1973 (Jensen 1973), but it only got stronger over time. There’s still no final nail in the coffin, but we’re getting close. Interesting aggregate-level data comes from looking at national and subnational levels of ancestry and relating this to intelligence or social performance measures. For the Americas, looks like this (Fuerst & Kirkegaard 2016):
Economists were able to work out the same results too (Putterman and Weil 2010).
Traditional environmental predictors turn out to be non-causal
Here we must hand it to Amir Sariaslan for showing the way. The problem is that traditional epidemiological studies rely on non-familial data meaning that it’s difficult to control for all genetic and familial environment effects (when they use familial data, they usually only use a single type of relationship — parent-child — which is ambiguous by itself). These are thus unmeasured confounders in the models making them suffer from omitted variable bias. However, there are a number of clever ways to take into account these unmeasured familial effects, such as looking at siblings or looking at within person associations. Here’s one study with the sibling approach:
Background
Low socioeconomic status in childhood is a well-known predictor of subsequent criminal and substance misuse behaviours but the causal mechanisms are questioned.
Aims
To investigate whether childhood family income predicts subsequent violent criminality and substance misuse and whether the associations are in turn explained by unobserved familial risk factors.
Method
Nationwide Swedish quasi-experimental, family-based study following cohorts born 1989-1993 (ntotal = 526 167, ncousins = 262 267, nsiblings = 216 424) between the ages of 15 and 21 years.
Results
Children of parents in the lowest income quintile experienced a seven-fold increased hazard rate (HR) of being convicted of violent criminality compared with peers in the highest quintile (HR = 6.78, 95% CI 6.23-7.38). This association was entirely accounted for by unobserved familial risk factors (HR = 0.95, 95% CI 0.44-2.03). Similar pattern of effects was found for substance misuse.
Conclusions
There were no associations between childhood family income and subsequent violent criminality and substance misuse once we had adjusted for unobserved familial risk factors.
What’s the logic of this kind of design? Well, if we look at full siblings and their parents, then since the parental income is not static, siblings will not grow up with the exact same levels of parental income. However, the variation in parental income cannot cause differences in their children’s genetics because this is essentially random, and other parental variables say about constant (e.g. education). So, we are thus able to account for some or all of the unmeasured confounding. When we do that, we find no association with childhood income and later crime levels. That’s inconsistent with a causal effect of childhood income, which was never strong to begin with.
Similar studies find that neighborhood deprivation does not cause crime, substance abuse or schizophrenia either. Nor does it cause health problems. Nor does education cause better mental health.
Of course, behavioral geneticists have been saying that these traditional non-familial methods are methodologically broken for decades (because the ‘environmental’ measures are heritable too), but it’s nice to actually show that they produce incorrect results and find out what the real effect sizes are. These could have been larger than zero and it’s not possible to tell before doing an actually informative study.
Next up?
So, what’s next? There’s a lot to do, but one thing I’ve been thinking of is showing that Muslim populations are actually growing a lot faster than many claim. The reason they claim these low levels of growth is because they rely on official statistics and these data tend to convert 2nd and later generation people into the ‘native’ categories, thus effectively hiding them. However, Muslims are nice enough to use distinctive names, so one can count the number of persons with such names over time and this will show a more realistic growth rate. Preliminary results for Denmark indicate an official stats-based growth rate of 2.5%, whereas first names indicate 5.1%. That’s not a small difference. The growth rate of Danish natives is something like -16% per generation which comes out at about -0.5% per year. You don’t have to be a genius to see how 5.1% vs. -0.5% work out in a few decades.
With regards to the question of whether genetics accounts for group differences (to a degree greater than 0%), this is easy enough to find out using genomic data. The last remaining hypothesis to disprove is colorism which is the claim that (White) people discriminate against others based on their skin tone (color), and this explains why e.g. mixed race people with lighter skin have higher incomes, educational attainment, intelligence etc. This hypothesis is totally implausible for intelligence since this trait is very hard to change via interventions (unless you give people heavy metals), but has some plausibility for the social outcomes. It’s possible to disprove with genomic data by simply checking whether measured skin tone mediates the relationship between, say, European ancestry and social outcomes and intelligence. Colorism says it does. The main issue here is obtaining access to the relevant data.
Why attack the incorrect beliefs of leftists so consistently? Well, because there’s a lot more of them in science, so generally speaking, this ideology is the main driver of political bias in the scientific literature. I could spend my time attacking shoddy science by libertarians and conservatives too, but the leftists already do that for me, and some of them quite competently. There’s a lot more low-hanging fruit in the other direction.

