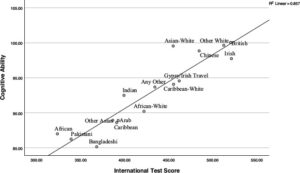
It’s somewhat of an alt right myth that immigrant groups come into the country, and then continuously outbreed the original population even if no more immigration happens. While this maybe have happened historically, it does not generally happen in Western countries because the immigrant groups quickly reduce their fertility levels to the level of the host country (demographic transition). Some years ago, I was curious about this fear, so I obtained some Danish data from directly from Danish Statistics (gov stats body). They are shown below, by generation. I left the names in Danish, but they are pretty readable (I added a new pointers in [brackets]). I included only those with at least 10 births in the period to avoid excessive sampling error, and I lined up the countries that match across generations. The correlation between the fertility rates is .57 (n = 15). Original Danish file. These data cover years 2008-2012 (average).
| First generation | Second generation | ||||
| Origin | Births | Fertility rate | Origin | Births | Fertility rate |
| Tyrkiet | 681 | 2,073 | Tyrkiet | 398 | 1,679 |
| Polen | 501 | 1,635 | Polen | 34 | 1,683 |
| Irak | 459 | 2,248 | |||
| Somalia | 409 | 3,531 | |||
| Libanon | 347 | 2,553 | Libanon | 81 | 1,542 |
| Pakistan | 302 | 2,732 | Pakistan | 171 | 1,772 |
| Tyskland [Germany] |
300 | 1,486 | Tyskland | 20 | 1,616 |
| Norge | 266 | 1,713 | Norge | 15 | 1,596 |
| Bosnien-Hercegovina | 258 | 1,529 | |||
| Afghanistan | 243 | 2,506 | |||
| Thailand | 242 | 1,562 | |||
| Sverige | 239 | 1,826 | Sverige | 16 | 1,445 |
| Vietnam | 226 | 1,989 | Vietnam | 18 | 1,050 |
| Island | 210 | 2,112 | Island | 10 | 2,201 |
| Filippinerne | 201 | 1,050 | |||
| Kina | 195 | 1,372 | |||
| Ukraine | 183 | 1,693 | |||
| Litauen | 164 | 1,567 | |||
| Rumænien | 153 | 1,317 | |||
| Rusland | 148 | 1,737 | |||
| Iran | 143 | 1,290 | |||
| Marokko | 143 | 2,861 | Marokko | 64 | 1,993 |
| Sri Lanka | 135 | 1,744 | |||
| Jugoslavien (eks.) | 130 | 1,763 | Jugoslavien (eks.) | 94 | 1,783 |
| Storbritannien [Great Britain] |
100 | 1,762 | Storbritannien | 12 | 1,898 |
| Indien | 90 | 1,444 | Indien | 14 | 1,445 |
| USA | 84 | 1,396 | |||
| Syrien | 82 | 3,073 | |||
| Letland | 81 | 1,444 | |||
| Nederlandene | 77 | 2,027 | |||
| Brasilien | 73 | 1,559 | |||
| Makedonien | 64 | 2,050 | Makedonien | 15 | 2,166 |
| Frankrig | 60 | 1,450 | |||
| Bulgarien | 53 | 1,280 | |||
| Myanmar (tidl. Burma) | 53 | 3,458 | |||
| Finland | 51 | 1,485 | |||
| Spanien | 43 | 1,088 | |||
| Ghana | 41 | 2,191 | |||
| Jugoslavien. Forb. Rep. | 38 | 2,285 | |||
| Kuwait | 37 | 2,937 | |||
| Ungarn | 34 | 1,123 | |||
| Estland | 33 | 1,605 | |||
| Uganda | 33 | 1,655 | |||
| Nigeria | 32 | 2,972 | |||
| Peru | 31 | 1,972 | |||
| Canada | 30 | 1,511 | |||
| Italien | 29 | 941 | |||
| Jordan | 27 | 3,228 | Jordan | 23 | 2,721 |
| Japan | 26 | 1,114 | |||
| Indonesien | 25 | 1,706 | |||
| Congo. Demokratiske Republik | 22 | 3,421 | |||
| Nepal | 22 | 1,221 | |||
| Etiopien | 22 | 2,117 | |||
| Hviderusland [Belarus] |
22 | 1,655 | |||
| Kenya | 22 | 1,449 | |||
| Kosovo | 22 | 3,353 | |||
| Mexico | 21 | 1,451 | |||
| Australien | 21 | 1,564 | |||
| Serbien og Montenegro | 21 | 1,852 | |||
| Serbien | 20 | 2,856 | |||
| Israel | 20 | 2,370 | |||
| Egypten | 20 | 2,417 | |||
| Tanzania | 19 | 1,932 | |||
| Tjekkiet | 19 | 1,279 | |||
| Burundi | 19 | 2,530 | |||
| Cameroun | 19 | 2,343 | |||
| Bangladesh | 19 | 2,617 | |||
| Tunesien | 19 | 2,815 | |||
| Congo | 18 | 3,005 | |||
| Slovakiet | 18 | 1,214 | |||
| Argentina | 17 | 1,966 | |||
| Sudan | 17 | 2,805 | |||
| Chile | 16 | 1,578 | |||
| Algeriet | 16 | 2,814 | |||
| Belgien | 16 | 1,592 | |||
| Sydafrika | 15 | 1,980 | |||
| Elfenbenskysten [Ivory coast] |
15 | 3,351 | |||
| Venezuela | 15 | 2,010 | |||
| Colombia | 15 | 1,176 | |||
| Østrig [Austria] |
14 | 1,432 | |||
| Zambia | 13 | 2,198 | |||
| Irland | 13 | 1,446 | |||
| Cuba | 13 | 2,070 | |||
| Statsløs | 13 | 2,492 | |||
| Gambia | 12 | 1,778 | |||
| Schweiz | 12 | 1,192 | |||
| Portugal | 12 | 981 | |||
| Mellemøsten uoplyst [unknown middle east] |
11 | 3,414 | |||
| Moldova | 11 | 2,093 | |||
| Malaysia | 11 | 1,371 | |||
| Armenien | 11 | 1,632 | |||
| Sovjetunionen (eks.) | 11 | 1,613 | |||
| Usbekistan | 11 | 3,108 | |||
| Kroatien | 10 | 1,744 | |||
| Sierra Leone | 10 | 2,911 |
If one avoids breaking down by country, one can also get some neat longitudinal data that gives useful perspective with updated data (FERT1 table).

So, current ‘Danish origin’ (some partial foreigners in this group) fertility sits at ~1.8, which is good by comparison with developed countries in general. It can be seen that non-western 1st generations had a large decline since the 1980s and now roughly matches the other groups, though with a slight increase since 2012 or so. Immigrant women from western countries do not have many offspring. These probably represent a lot of power women who come to Denmark to work, and then neglect family life. 2nd generation non-westerns do not have particularly high fertility. This is surprising considering the relative low IQ of this group (85-90), and the known relationship between lower IQ and fertility (r = -.11 according to recent meta-analysis). In this case, the group level factors seem to overwhelm the expectation based on the individual level differences.
Could the 2nd generation figures be misleading due to the tempo effect problem in TFR? That if they have children at an older age the TFR calculation is thrown and can in the short term make the reduction in fertility look larger than it really is?