A friend asked me to give him some pointers to the recent evidence on dysgenics, or the selection against valued traits. Challenge was accepted. This is not an exhaustive review. It’s a summary of stuff I found interesting. If you want a longer and more pessimistic review, read the recent book by Sarraf et al (2019): Modernity and Cultural Decline: A Biobehavioral Perspective. In fact, to gather these studies, I mostly just skimmed the 102 citing papers of Kong et al (2017) since most recent work will cite this. This general reviewing strategy is not fool-proof, but it works well enough.
There are two different categories of evidence:
- Genetic evidence: genetic measures of traits changing over time
- Fertility and traits: people who are more/less X have more/less children
So we can roughly split the scientific findings by this division, except some papers presented data on both, and I will include them in both sections. Generally speaking, the evidence in (2) goes back 100s or 1000s of years, and that in (1) is all published in the last 5 years, but often concern older patterns, though not before 1900 (YET! Archaogenomics meets dysgenics, please can have more??).
Genetic evidence
Let’s start on the positive side:
-
Woodley, M. A., Younuskunju, S., Balan, B., & Piffer, D. (2017). Holocene selection for variants associated with general cognitive ability: Comparing ancient and modern genomes. Twin research and human genetics, 20(4), 271-280.
Human populations living during the Holocene underwent considerable microevolutionary change. It has been theorized that the transition of Holocene populations into agrarianism and urbanization brought about culture-gene co-evolution that favored via directional selection genetic variants associated with higher general cognitive ability (GCA). To examine whether GCA might have risen during the Holocene, we compare a sample of 99 ancient Eurasian genomes (ranging from 4.56 to 1.21 kyr BP) with a sample of 503 modern European genomes (Fst = 0.013), using three different cognitive polygenic scores (130 SNP, 9 SNP and 11 SNP). Significant differences favoring the modern genomes were found for all three polygenic scores (odds ratios = 0.92, p = 001; .81, p = 037; and .81, p = .02 respectively). These polygenic scores also outperformed the majority of scores assembled from random SNPs generated via a Monte Carlo model (between 76.4% and 84.6%). Furthermore, an indication of increasing positive allele count over 3.25 kyr was found using a subsample of 66 ancient genomes (r = 0.22, pone-tailed = .04). These observations are consistent with the expectation that GCA rose during the Holocene.
Ignore the stuff with p > .01, there’s some solid findings here aside from the p-hacking. And, everything else is basically negative, so let’s begin:
-
Beauchamp, J. P. (2016). Genetic evidence for natural selection in humans in the contemporary United States. Proceedings of the National Academy of Sciences, 113(28), 7774-7779.
Recent findings from molecular genetics now make it possible to test directly for natural selection by analyzing whether genetic variants associated with various phenotypes have been under selection. I leverage these findings to construct polygenic scores that use individuals’ genotypes to predict their body mass index, educational attainment (EA), glucose concentration, height, schizophrenia, total cholesterol, and (in females) age at menarche. I then examine associations between these scores and fitness to test whether natural selection has been occurring. My study sample includes individuals of European ancestry born between 1931 and 1953 who participated in the Health and Retirement Study, a representative study of the US population. My results imply that natural selection has been slowly favoring lower EA in both females and males, and are suggestive that natural selection may have favored a higher age at menarche in females. For EA, my estimates imply a rate of selection of about −1.5 mo of education per generation (which pales in comparison with the increases in EA observed in contemporary times). Although they cannot be projected over more than one generation, my results provide additional evidence that humans are still evolving—albeit slowly, especially compared with the rapid changes that have occurred over the past few generations due to cultural and environmental factors.
This is the first of the newer series of studies. Generated a lot of interest by essentially vindicating the eugenicists of early 1900s using modern genetic data. And there was quickly a replication:
-
Kong, A., Frigge, M. L., Thorleifsson, G., Stefansson, H., Young, A. I., Zink, F., … & Stefansson, K. (2017). Selection against variants in the genome associated with educational attainment. Proceedings of the National Academy of Sciences, 114(5), E727-E732.
Epidemiological and genetic association studies show that genetics play an important role in the attainment of education. Here, we investigate the effect of this genetic component on the reproductive history of 109,120 Icelanders and the consequent impact on the gene pool over time. We show that an educational attainment polygenic score, POLYEDU, constructed from results of a recent study is associated with delayed reproduction (P < 10−100) and fewer children overall. The effect is stronger for women and remains highly significant after adjusting for educational attainment. Based on 129,808 Icelanders born between 1910 and 1990, we find that the average POLYEDU has been declining at a rate of ∼0.010 standard units per decade, which is substantial on an evolutionary timescale. Most importantly, because POLYEDU only captures a fraction of the overall underlying genetic component the latter could be declining at a rate that is two to three times faster.
So, polygenic scores for education, and thereby intelligence indirectly, go down and are associated with lower fertility.
-
Mullins, N., Ingason, A., Porter, H., Euesden, J., Gillett, A., Ólafsson, S., … & Stefansson, K. (2017). Reproductive fitness and genetic risk of psychiatric disorders in the general population. Nature communications, 8(1), 1-6.
The persistence of common, heritable psychiatric disorders that reduce reproductive fitness is an evolutionary paradox. Here, we investigate the selection pressures on sequence variants that predispose to schizophrenia, autism, bipolar disorder, major depression and attention deficit hyperactivity disorder (ADHD) using genomic data from 150,656 Icelanders, excluding those diagnosed with these psychiatric diseases. Polygenic risk of autism and ADHD is associated with number of children. Higher polygenic risk of autism is associated with fewer children and older age at first child whereas higher polygenic risk of ADHD is associated with having more children. We find no evidence for a selective advantage of a high polygenic risk of schizophrenia or bipolar disorder. Rare copy-number variants conferring moderate to high risk of psychiatric illness are associated with having fewer children and are under stronger negative selection pressure than common sequence variants.
So, while all psychopathology shows positive genetic correlations, some aspects of it have positive, and others negative selection, in the expected ways. Autism makes you introverted and poor at socializing (but good at science!), and ADHD kinda does the opposite. I recommend Marco del Giudice’s book Evolutionary Psychopathology, and Scott Alexander’s review.
-
Sanjak, J. S., Sidorenko, J., Robinson, M. R., Thornton, K. R., & Visscher, P. M. (2018). Evidence of directional and stabilizing selection in contemporary humans. Proceedings of the National Academy of Sciences, 115(1), 151-156.
Modern molecular genetic datasets, primarily collected to study the biology of human health and disease, can be used to directly measure the action of natural selection and reveal important features of contemporary human evolution. Here we leverage the UK Biobank data to test for the presence of linear and nonlinear natural selection in a contemporary population of the United Kingdom. We obtain phenotypic and genetic evidence consistent with the action of linear/directional selection. Phenotypic evidence suggests that stabilizing selection, which acts to reduce variance in the population without necessarily modifying the population mean, is widespread and relatively weak in comparison with estimates from other species.
This study using the massive UK biobank dataset computed both genetic and phenotypic results for the same traits, as well as by sex.
Another interesting trait is myopia, shortsightedness, which is rapidly increasing in prevalence, leading people to wonder about causes. Screentime? More near-work? Less outside work (less sun?). Whatever the case, there appears to be opposite effects at play:
-
Long, E., & Zhang, J. (2020). Natural selection contributes to the myopia epidemic. National Science Review.
The prevalence of myopia, or nearsightedness, has skyrocketed in the past few decades, creating a public health crisis that is commonly attributed to life-style changes. Here we report an overall increase in the frequencies of myopia-associated mutant alleles over 25 years among participants of the UK Biobank. Although myopia itself appears to be selected against, many of the mutant alleles are associated with reproductive benefits, suggesting that reproduction-related selection inadvertently contributes to the myopia epidemic. We estimate that, in the UK alone, natural selection adds more than 100,000 myopia cases per generation, and argue that antagonistic pleiotropy be broadly considered in explaining the spreads of apparently disadvantageous phenotypes in humans and beyond.
This kind of situation is familiar with educational attainment and Flynn effect — increase of some IQ scores over time. There are papers that attempt to model this:
-
Hong, Z. (2020). Modelling the on-going natural selection of educational attainment in contemporary societies. Journal of theoretical biology, 493, 110210.
There has been substantial increase in education attainment (EA) in both developing and developed countries over the past century. I present a simulation model to examine the potential evolutionary trajectories of EA under current selective pressure in western populations. With the assumption that EA is negatively correlated with fitness and has both a genetic component and a cultural component, I show that when prestige-biased transmission of the EA (i.e. people with more education are more likely to be copied) is present, the phenotype of EA is likely to keep increasing in the short term, yet the genetic component of EA may undergo a constant decline and become the limiting factor in further phenotypic increase.
For the Woodley et al take on these things, there’s a lot of papers, but the book mentioned above summarizes this stuff.
Anyway, to return to our regular program, there’s an updated UK Biobank study in the works:
-
Hugh-Jones, D., & Abdellaoui, A. (2021). Natural Selection in Contemporary Humans is Linked to Income and Substitution Effects (No. 2021-02). School of Economics, University of East Anglia, Norwich, UK..
Natural selection has been documented in contemporary humans, but little is known about the mechanisms behind it. We test for natural selection through the association between 33 polygenic scores and fertility, across two generations, using data from UK Biobank (N = 409,629 British subjects with European ancestry). Consistently over time, polygenic scores associated with lower (higher) earnings, education and health are selected for (against). Selection effects are concentrated among lower SES groups, younger parents, people with more lifetime sexual partners, and people not living with a partner. The direction of natural selection is reversed among older parents (22+), or after controlling for age at first live birth. These patterns are in line with economic theories of fertility, in which higher earnings may either increase or decrease fertility via income and substitution effects in the labour market. Studying natural selection can help us understand the genetic architecture of health outcomes: we find evidence in modern day Great Britain for multiple natural selection pressures that vary between subgroups in the direction and strength of their effects, that are strongly related to the socio-economic system, and that may contribute to health inequalities across income groups.
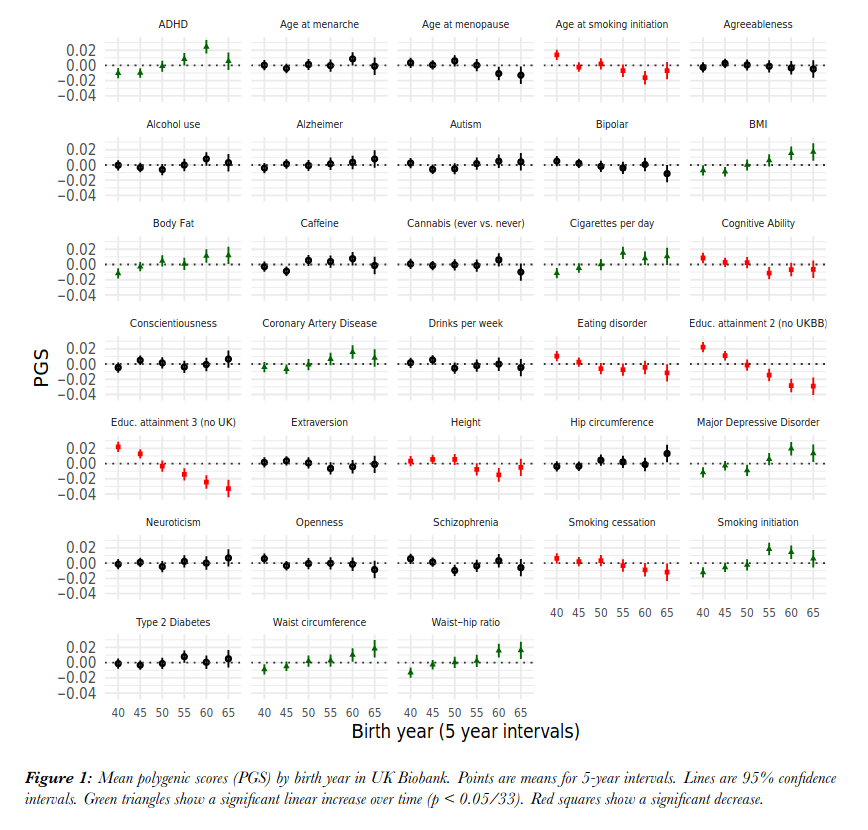
Notice the color coding. Of the 4 things decreasing: age of smoking initiation (start earlier), intelligence (“cognitive ability”), eating disorder (i.e., abnormally thin), educational attainment (one with and without using GWAS results from this sample), height, and smoking stopping. Of the things increasing: ADHD, body fat%, cigarettes per day, coronary artery disease, waist circumference, and waist-hip ratio. So you get the picture: we are genetically breeding for people with poor attention control, lower education and intelligence, who are fatter, shorter and just in general unhealthy. We can look by sex too:
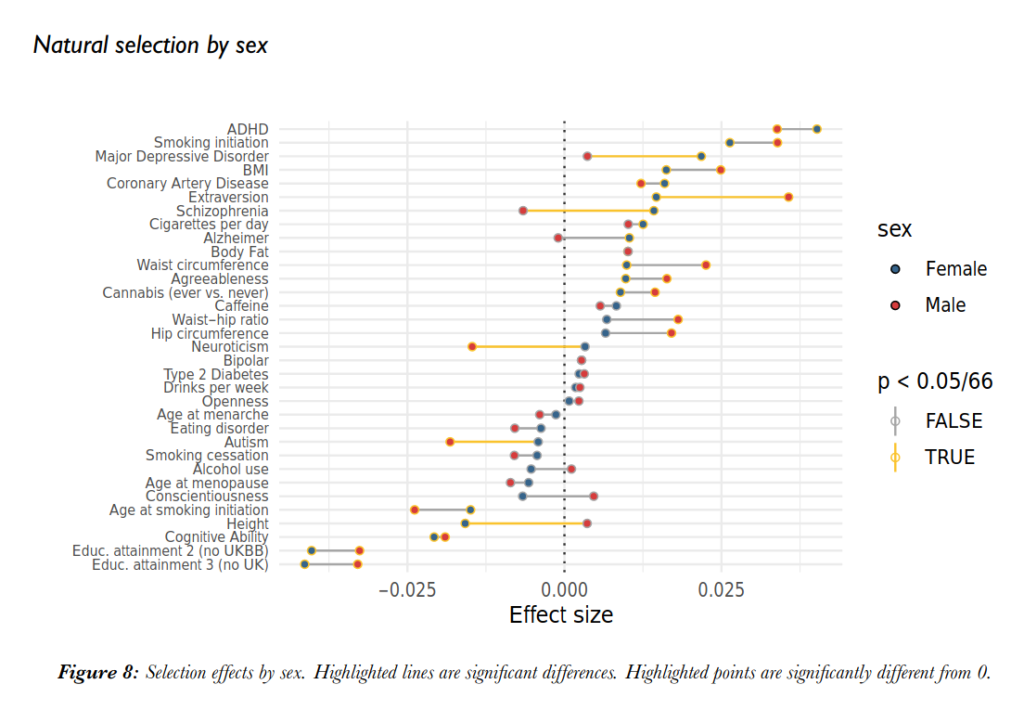
Here we see that both men and women are negative for both intelligence and education, unlike the Scandinavian data (in next section). However, we confirm the opposite direction selection on height. Female selection is stronger, however, so it wins out. Extroversion is a lot stronger for men, not a big surprise since number of (sex) partners is essentially a function of trying hard.
-
Kim, Y., & Lee, J. J. (2019). The genetics of human fertility. Current opinion in psychology, 27, 41-45.
Heritable variation in fitness — survival and reproduction — is the fuel of evolution by natural selection. Many human societies have dramatically reduced mortality before and during the prime reproductive years, making fertility a reasonably good proxy for the whole of fitness in much of our species. For this reason, empirical knowledge regarding the genetics of fertility must be an essential part of any framework for understanding past and ongoing trends in human adaptive evolution. Here we use R.A. Fisher’s analysis of human fertility as a starting point and find strong support from more recent research for his main contentions: fertility is a moderately heritable trait, where much of the genetic influences are shared with psychological characteristics.
Key table:
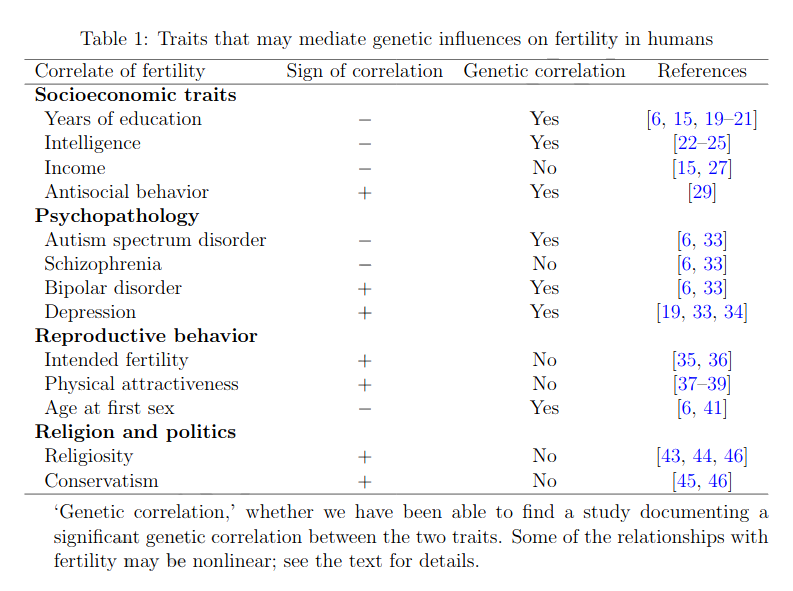
They should have carried out a meta-analysis for each, just a weighted mean/median, so we had effect sizes here instead of only directions, but still.
For those wondering about the religion, politics and fertility findings, see the appendix to this post.
Edited to add (2020-02-20): personality too
I missed this one the first time but it’s relevant so adding it now:
- Berg, V., Lummaa, V., Rickard, I. J., Silventoinen, K., Kaprio, J., & Jokela, M. (2016). Genetic associations between personality traits and lifetime reproductive success in humans. Behavior genetics, 46(6), 742-753.
Personality has been associated with reproductive success in humans and other animals, suggesting potential evolutionary selection pressures. However, studies to date have only examined these associations on a phenotypic level, which may be inadequate in estimating evolutionary change. Using a large longitudinal twin dataset of contemporary Finns, we compared the phenotypic (breeder’s equation) and genetically informed (the Robertson–Price identity) associations between lifetime reproductive success (LRS) and two personality traits—neuroticism and extraversion. Neuroticism was not associated with LRS at the phenotypic nor genetic level, while extraversion was associated with higher LRS in men both phenotypically and genetically. Compared to the univariate phenotypic analysis, the genetic analysis suggested a larger selection response of extraversion, and a selection response of neuroticism due to indirect selection. We estimated that neuroticism decreases by .05 standard deviations and extraversion increases by .11 standard deviations by one generation. Our results highlight the importance of considering genetic associations between personality and fitness and investigating several inter-related personality traits and their covariance with each other to predict responses to selection more accurately.
These are based on weak self-report data and poor GWASs as a result, so these will likely be drastic underestimates.
Fertility and traits
Drawing on the Sanjak et al 2018 above, we see this nice plot for height and fertility:
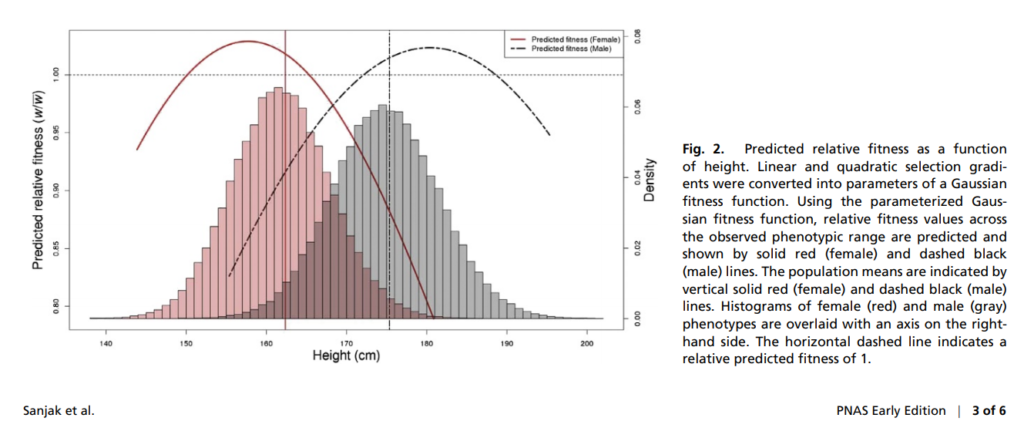
The top (mode) of the probability distributions are away from either sex’s means, meaning that there is directional selection. Note how the direction is opposite: we are selecting men for being taller and women for being shorter. Since the genetic basis of height is mostly shared between sexes (sits on autosomes and is linear-additive), this means the overall selection is weak because canceled out. However, to the extent that sex interacts genetically with height causing variants, this will tend to increase the sex difference in height over time.
The next figure shows the same situation across all the traits analyzed:
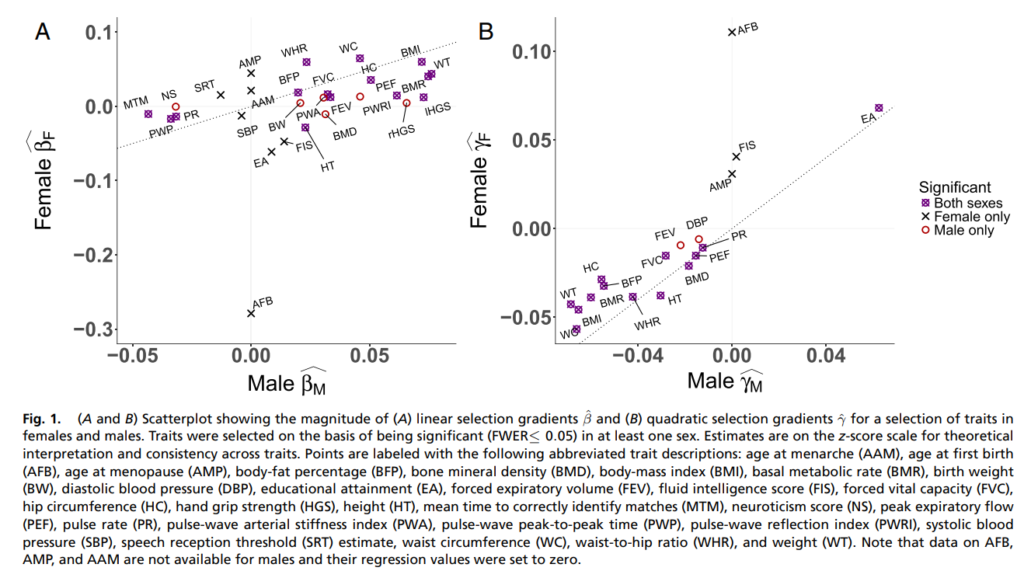
Selection is relatively similar across sexes (correlation is strong), but beware of slope and intercepts! The biggest outlier here is age of first birth, which has null selection in men, but strongly negative in women. Note also that EA (educational attainment, close proxy of intelligence) has opposite selection: negative for women and weakly positive for men. This mirrors the typical findings for intelligence. Actually, there was a prior Dutch paper on this which found much the same (Stulp et al 2015: Does natural selection favour taller stature among the tallest people on earth?).
Returning to more familiar grounds, what is the state of the literature on the intelligence and fertility situation?
-
Reeve, C. L., Heeney, M. D., & of Menie, M. A. W. (2018). A systematic review of the state of literature relating parental general cognitive ability and number of offspring. Personality and Individual Differences, 134, 107-118.
The purpose of this study is to conduct a systematic review of the literature on the relationship between general cognitive ability and fertility among modern humans. Our goals were to (a) evaluate the state of the extant literature, and (b) provide a quantitative summary of effect sizes to the extent possible (given the limitations of the literature). A thorough search identified 17 unique datasets that passed the inclusion criteria. Using a Random Effects Model to evaluate the data, the overall weighted effect was r = −0.11, although the data also indicated a sex effect (stronger correlations among females than males), and a race effect (stronger correlations among Black and Hispanic populations compared to Whites). Importantly, the data suggest the correlation has been increasing in strength throughout the 20th century (and early 21st). Finally, we discovered several notable limitations of the extant literature; limitations that currently prohibit a psychometric meta-analysis. We discuss these issues with emphasis on improving future primary studies to allow for more effective meta-analytic investigations.
Here we should note that William Shockley pointed out the race interaction many decades ago, he wrote in 1972:
The possible relationship of blood type determination of racial mixes of populations and I.Q. may offer a unique opportunity to evaluate the reality of the dysgenic threat. To fail to use a potentially effective means of diagnosis for fear of being called a racist is irresponsible. It may also be a great injustice to black Americans themselves. If those Negroes with the fewest Caucasian genes are in fact the most prolific and also the least intelligent, then genetic enslavement will be the destiny of their next generation.21 The con sequences may be extremes of racism and agony for both blacks and whites.
He is getting this from Arthur Jensen’s famous 1969 book-article (How much can we boost IQ and scholastic achievement):
The factual basis of this concern can be found in a recent article by Moynihan (1966). The differential birth rate, as a function of socioeconomic status (SES), is greater in the Negro than in the white population of the United States. Negro middle- and upper-class families have fewer children than their white counterparts, while Negro lower-class families have more. In 1960, Negro women of ages 35 to 44 who were married to unskilled laborers had 4.7 children as compared with 3.8 for non-Negro women in the same situation. Negro women married to professional or technical workers had only 1.9 cliildren, as against 2.4 for white women in the same circumstances. Negro women below the so-called poverty line, with incomes below $2000, averaged 5.3 children. Three out of four Negroes failing the Armed Forces Qualification Test come from families of four or more children. The poverty rate for families with five or six children is 3-1/2 times as high as that for families with one or two children (Hill & Jaffe, 1966). I would like to see more thought and research given to the possible educational and social implications of these trends for the future. Is there a risk that present welfare policies may lead to the genetic enslavement of a substantial segment of our population? Our failure seriously to investigate these matters may well be viewed by future generations as our society’s greatest injustice to Negro Americans.
Jensen’s wise words were, of course, not heeded. In fact, he did not comment much on this issue again. I speculate that’s because he saw how deranged the critics get when these issues are named, and though his 1969 article only included a few mentions of the verboten E word, it got a lot of attention. Nothing has changed here. Anyway, I digress! (OK, last part! there are also between country effects, which Gerhard Meisenberg studied in 2008. Needs an update!) (LAST PART: Romans apparently had some similar issues. See also Volkmar Weiss historical commentary)
There was a recent, very large scale replication of this using the great Swedish register:
-
Kolk, M., & Barclay, K. (2019). Cognitive ability and fertility among Swedish men born 1951–1967: evidence from military conscription registers. Proceedings of the Royal Society B, 286(1902), 20190359.
We examine the relationship between cognitive ability and childbearing patterns in contemporary Sweden using administrative register data. The topic has a long history in the social sciences and has been the topic of a large number of studies, many reporting a negative gradient between intelligence and fertility. We link fertility histories to military conscription tests with intelligence scores for all Swedish men born 1951–1967. We find a positive relationship between intelligence scores and fertility, and this pattern is consistent across the cohorts we study. The relationship is most pronounced for the transition to a first child, and men with the lowest categories of IQ scores have the fewest children. Using fixed effects models, we additionally control for all factors that are shared by siblings, and after such adjustments, we find a stronger positive relationship between IQ and fertility. Furthermore, we find a positive gradient within groups at different levels of education. Compositional differences of this kind are therefore not responsible for the positive gradient we observe—instead, the relationship is even stronger after controlling for both educational careers and parental background factors. In our models where we compare brothers to one another, we find that, relative to men with IQ 100, the group with the lowest category of cognitive ability have 0.56 fewer children, and men with the highest category have 0.09 more children.
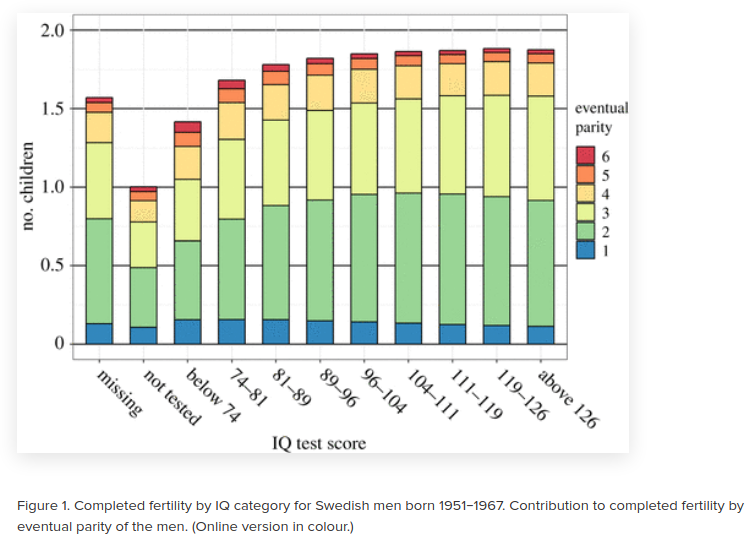
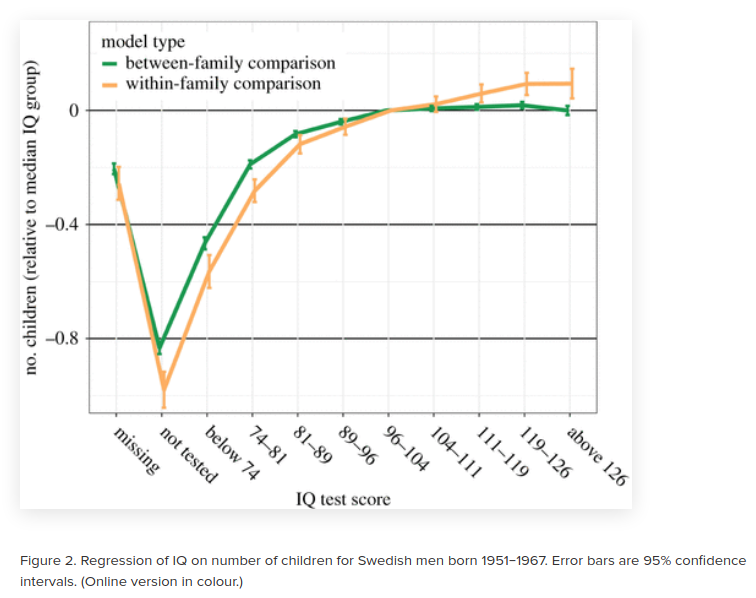
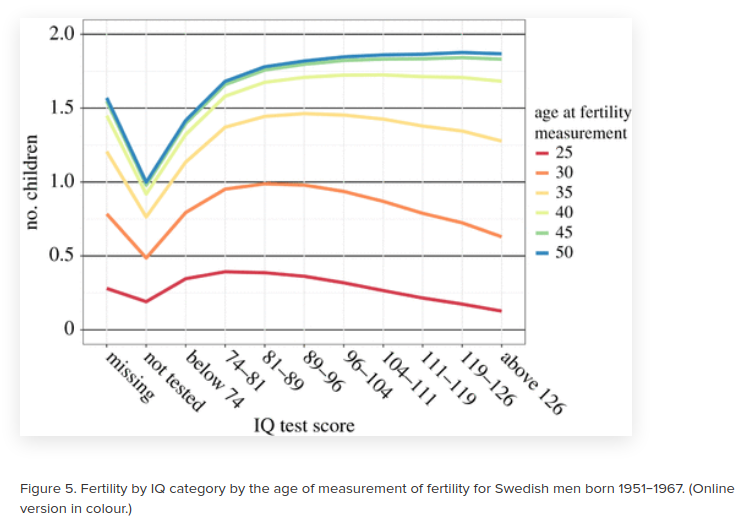
This is men only, but it shows the typical slightly positive effect in an older dataset. This replicated within siblings. In fact, it was stronger within siblings. A very unusual finding, it means that the between-family confounding factors tended to reduce the relationship. Strange? Definitely not what a sociologist would predict (how to predict the future: predict the opposite of what communist sociologists predict, a running series).
Also, there was a Norwegian paper on this before too (Sundet 2014: The Flynn Effect in Families: Studies of Register Data on Norwegian Military Conscripts and Their Families, see tweets).
An amusing way to look at things is to take very old phenotypic data of physical traits and look at who ended up with more kids. Thank you Estonia:
-
Valge, M., Hõrak, P., & Henshaw, J. M. (2020). Natural selection on anthropometric traits of Estonian girls. Evolution and Human Behavior.
Natural selection is a key mechanism of evolution, which results from the differential reproduction of individuals due to differences in phenotype. We describe fecundity selection on 13 anthropometric traits in a sample of 4000–10,000 of Estonian girls, who were born between 1937 and 1962 and measured at around 13 years of age. Direct selection favoured shorter, slimmer and lighter girls with smaller heads, more masculine facial and body shapes and slower rates of sexual maturation. Selection was stabilizing for weight, body mass index and face roundness. Direct selection was absent on two markers of general health and viability – handgrip strength and vital lung capacity – although these traits experience negative indirect selection due to their association with educational attainment. Similarly, indirect selection, mediated by educational attainment, accounted for a significant portion of selection for girls with smaller heads, narrower faces, and higher shoulder/hip ratios. These traits are thus subject to gene-culture coevolution, in that selection on body dimensions arises via cultural and behavioural mechanisms.
Smaller heads confirmed.
Conclusions
To conclude. Our genetics are getting worse. Public perception of genetic causation is linked to public support for corrective action. For those who have some communist aversion to solutions (and reality in general), this fact means one needs to suppress the uncomfortable data one way or another. On public perceptions, see this interesting study:
-
Zigerell, L. J. (2020). Understanding public support for eugenic policies: Results from survey data. The Social Science Journal, 57(3), 281-287.
Little published empirical research has investigated public support for eugenic policies. To add to this literature, a survey on attitudes about eugenic policies was conducted of participants from Amazon Mechanical Turk who indicated residence in the United States (N > 400). Survey items assessed the levels and correlates of support for policies that, among other things, encourage lower levels of reproduction among the poor, the unintelligent, and people who have committed serious crimes and encourage higher levels of reproduction among the wealthy and the intelligent. Analyses of responses indicated nontrivial support for most of the eugenic policies asked about, such as at least 40% support for policies encouraging lower levels of reproduction among poor people, unintelligent people, and people who have committed serious crimes. Support for the eugenic policies often associated with feelings about the target group and with the perceived heritability of the distinguishing trait of the target group. To the extent that this latter association reflects a causal effect of perceived heritability, increased genetic attributions among the public might produce increased public support for eugenic policies and increase the probability that such policies are employed.
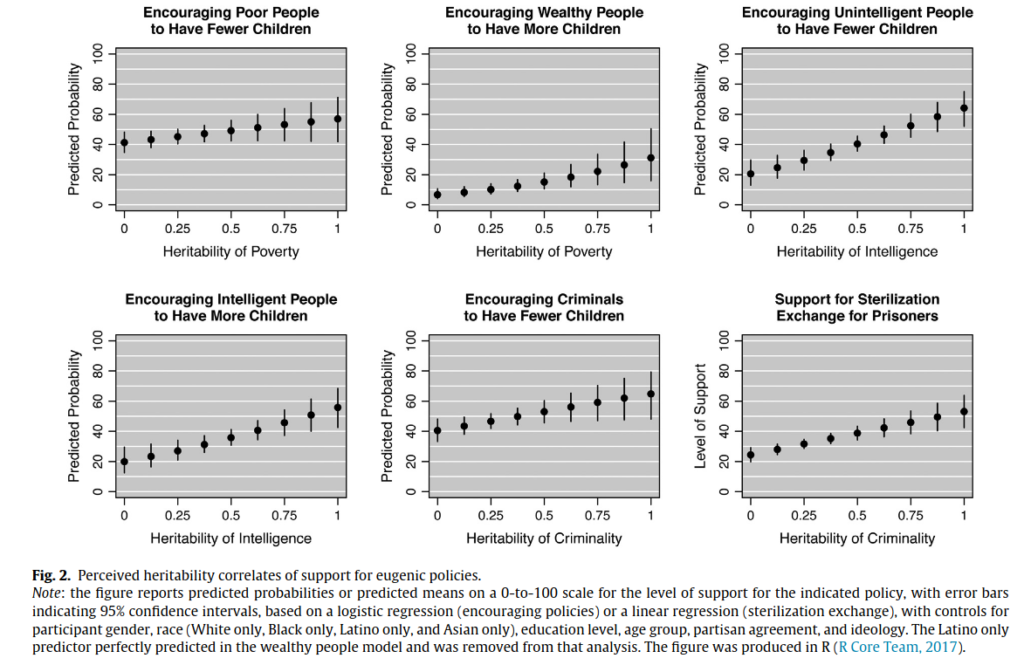
These data are cross-sectional, so we can’t be totally certain about causality here, but it’s likely in this direction: [problems have genetic causes] -> [support for genetic solutions].
As a committed transhumanist, I of course support biotech eugenics á la genetic editing (think CRISPR but better), and selection among natural variation with embryo selection (safer) is the way to go. We should publicly subsidize these technologies as fast as possible. For a book length take on such issues, see Jonathan Anomaly’s 2020 book Creating future people: The ethics of genetic enhancement.
Religion, politics, and children
I didn’t want to go into too many details in the main text, but there’s a thorough study on this topic, phenotypic data only:
-
Fieder, M., & Huber, S. (2018). Political attitude and fertility: Is there a selection for the political extreme?. Frontiers in psychology, 9, 2343.
There is growing evidence that human ideology as well as social and political attitudes also have a genetic basis. In case of some genetic predisposition of political attitude, an association with fertility would be a hint of potential selection on political ideology. We therefore investigated on the basis of men and women that have completed, respectively, almost completed reproduction, of three different data sets (the World Value Survey 1981–2014 covering a wide range of countries and developmental levels, n = 152,380, the Survey of Health, Ageing and Retirement in Europe of 2005, n = 65,912, and the General Social Survey of the United States 1972–2014, n ∼ 6200) whether political attitude is associated with number of children. Overall, in the world wide survey, both extreme political attitudes, albeit more pronounced for right/conservative than for left/liberal attitude, are associated with higher average offspring number compared to intermediate attitudes. If countries are analyzed separately, however, the picture is inconsistent, and in most countries, the association is non-significant. In the European and the US-survey, only the political right is associated with above average number of children. The time series of US data from 1972 to 2014 shows that at least in the US-sample, this pattern emerged during the 1990s: in the 1970s and 1980s, also in the US-sample both political extremes had a reproductive advantage, which vanished for left wing individuals during the 1990s. From an evolutionary perspective, we are not able to draw final conclusions as the association between political attitude and reproduction varies across countries and time. Nonetheless, the overall pattern suggests that in human evolutionary history, both left and right political attitudes may have conveyed fitness benefits so that both attitudes have been kept in the population.
So they analyze 3 large datasets, and these are their findings:
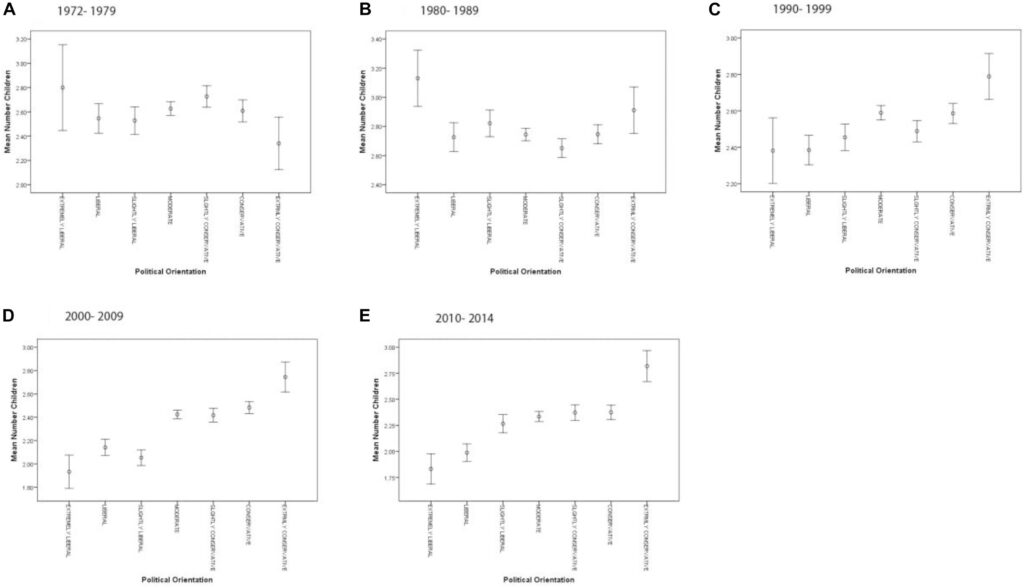
These results are from GSS, the General Social Survey. So these are American data, used for 1000s of studies. These results are generated using a regression model:
We used the GSS of the United States from the years 1972 to 2014, including a total of ∼6200 individuals aged older than 45 years (see Supplementary Table S5). To analyze the time course of the association between political attitude and number of children, we divided this data set into time-intervals 1972–1979, 1980–1989, 1990–1999, 2000–2009, and 2010–2014. We included the following surveyed variables in our analysis: sex (1 = male, 2 = female), number of biological children, political self-positioning (encoded as 1 = extremely liberal, 2 = liberal, 3 = slightly liberal, 4 = moderate, 5 = slightly conservative, 6 = conservative, and 7 = extremely conservative), highest completed education (encoded as: 1 = lower than high school, 2 = high school, 3 = junior college, 4 = bachelor, and 5 = graduate), age at survey in years, income encoded in 12 steps by GSS (see Supplementary Table S6), and the frequency attendance of religious services (encoded as 0 = never, 1 = less once a year, 2 = once a year, 3 = several times a year, 4 = once a month, 5 = 2 × 3 a month, 6 = nearly once a week, 7 = every week, 8 = more than once a week).
We calculated the following general linear mixed models: regressing the number of children (on basis of a Poisson error structure) on political self-positioning, education, and sex as categorical variables, as well as age, frequency attendance of religious services (as numeric variable), and income with year of survey as random factor (i) using the whole data set, (ii) for time intervals 1972–1979, 1980–1989, 1990–1999, 2000–2009, and 2010–2014, and (iii) (in the Supplementary Material) for each survey year separately.
So actually, they over-controlled, since we don’t want to control for religious service attendance or income. They use the full dataset, so that’s why they have an age control. Alternatively, one can look at the old people (e.g., 45+) only, and these should produce very similar results (I didn’t check).
Similarly, for the other 2 datasets:
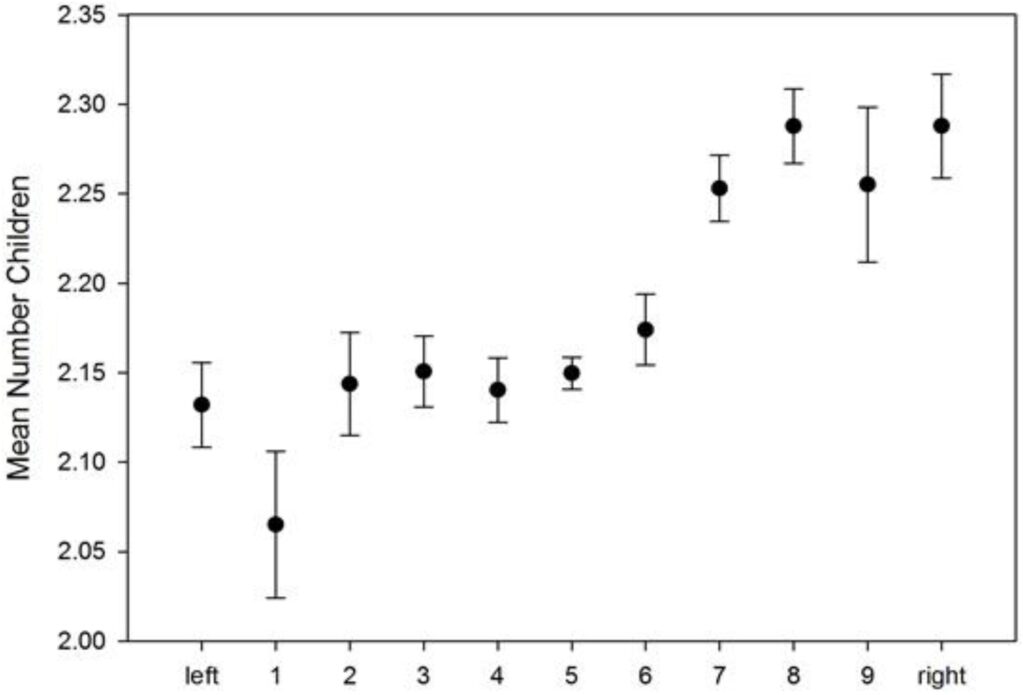
These are from SHARE (Survey of Health, Ageing and Retirement in Europe), a very large pan-European dataset.
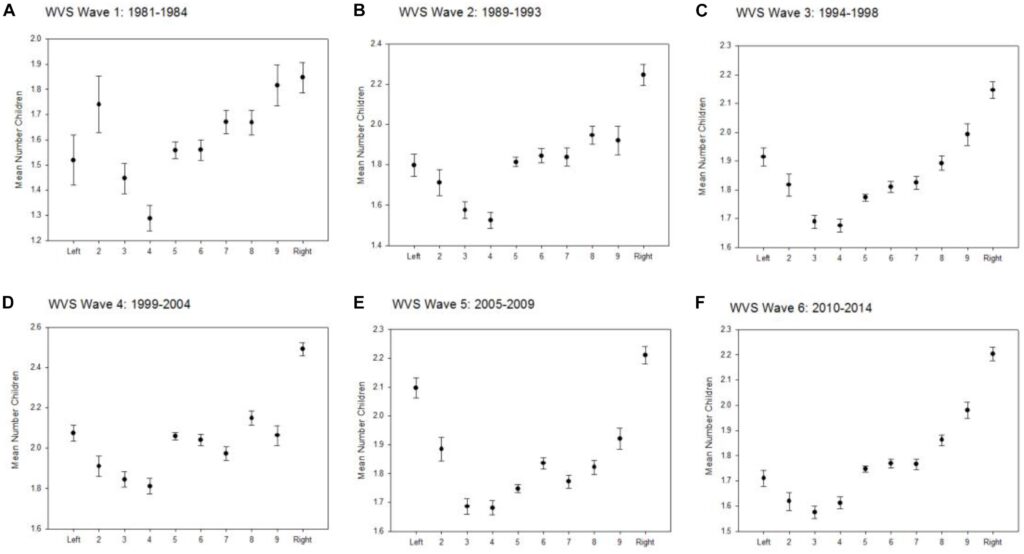
These are from WVS, World Values Survey, which is similar to the GSS, and has been running for a bit shorter time, but has more countries in it. There is also a European Values Survey, and some Eurobar (EU made) surveys, but they probably show about the same.
Anyway, the conclusion from phenotypic data is obvious: conservatives outbreed lefties and their advantage has been growing over time. When using the proper unadjusted numbers, we can see the ratio is nearing 2x the number of kids in recent years! JayMan analyzed GSS data in 2012 to produce:
