Some years ago I came up with a rough model for explaining some curious demographic associations (I later told a friend about it, and he had the same idea independently). The idea is that verbal tilt has independent effects or at least associations with various things. Specifically, verbal tilt shows positive correlations with:
- Creativity
- Political leftism
- Social science preference over hard science, people over things jobs (see many works by Thomas Coyle)
- Mental illness, especially emotional disorders, as well as general neuroticism
- Interpersonal skills, also related to leadership (see 2015 post)
- Interest in politics
- More women%, and womanly behavior (maybe not always like this), including homosexuality in men
- Less scientific mindset
(there are more studies of the above, but I didn’t have time to find them again right now)
Since demographic groups differ both in their overall intelligence levels and in their tilts, one can make specific predictions based on both of these. To put it simply, we can imagine a 2 by 2 matrix:
| High verbal | High nonverbal | |
| High g | High social power/influence, high creativity, mid-high mental illness, political left-wing (woke) | Mid-high social power, mid-high creativity, low mental illness, political center-right (libertarian!) |
| Low g | Low social power, low-mid creativity, high mental illness, political center-left (center-left authoritarian) | Low social power, low creativity, mid mental illness, political right-wing (right-wing authoritarian) |
Very crudely, this is based on associations between both g and tilt, and the various outcomes. Sometimes there are opposite effects, and the stronger score will win out. E.g., for high g, high V group, mental illness will be lower due to high g, but higher due to high V, and which wins out depends on their relative association strengths. I am merely guessing based on my reading of various existing data.
What is the evidence for this? Just a few days ago, a new paper dropped, and it’s great!
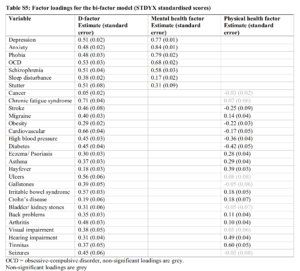
- Rajagopal et al, 2020, Genome-wide association study of school grades identifies a genetic overlap between language ability, psychopathology and creativity. BioRxiv
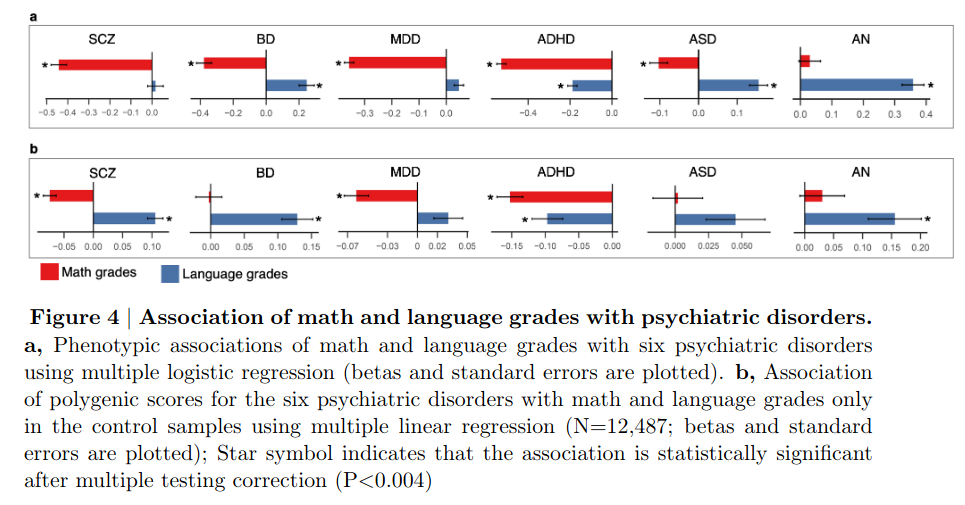
Individuals with psychiatric disorders perform differently in school compared to the general population. Genetic factors contribute substantially to such differences. It is however unclear if differential performance is seen across all cognitive domains such as math and language. Here we report a genome-wide association study (GWAS) of school grades in 30,982 individuals (18,495 with and 12,487 without one or more of six major psychiatric disorders) and a replication study in 4,547 individuals. GWAS of overall school performance yielded results that were highly similar to the results of a previous GWAS of educational attainment. Analyzing subject specific grades, we observed that math performance was severely affected whereas language performance (Danish and English) was relatively unaffected or enhanced in those with psychiatric disorders compared to controls. We found that the genetic variants associated with poor math performance, but better language performance were also associated with increased risk for multiple psychiatric disorders. The same variants were also associated with creativity, which we show through a polygenic score analysis of 2953 creative professionals and 164,622 controls. The results overall suggest that risk for psychiatric disorders, language ability and creativity might have overlapping genetic roots.
In particular:
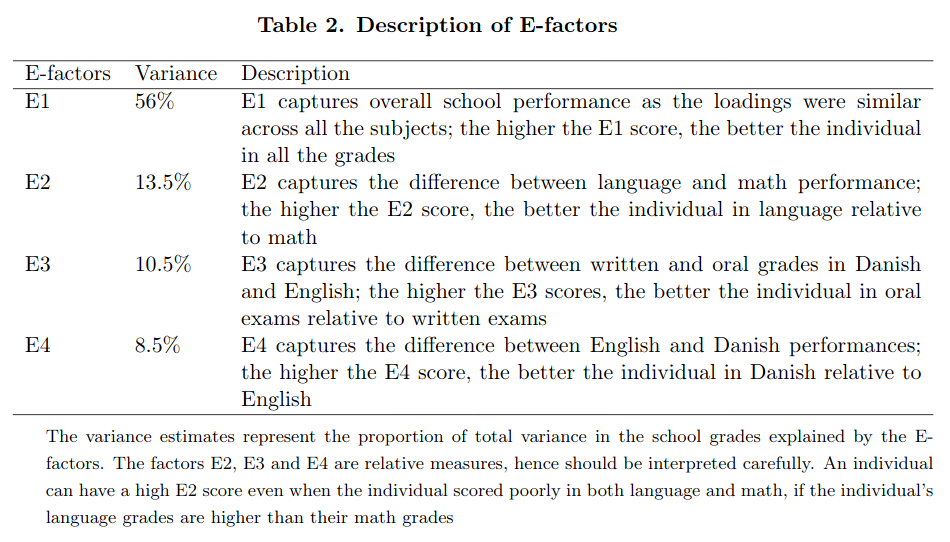

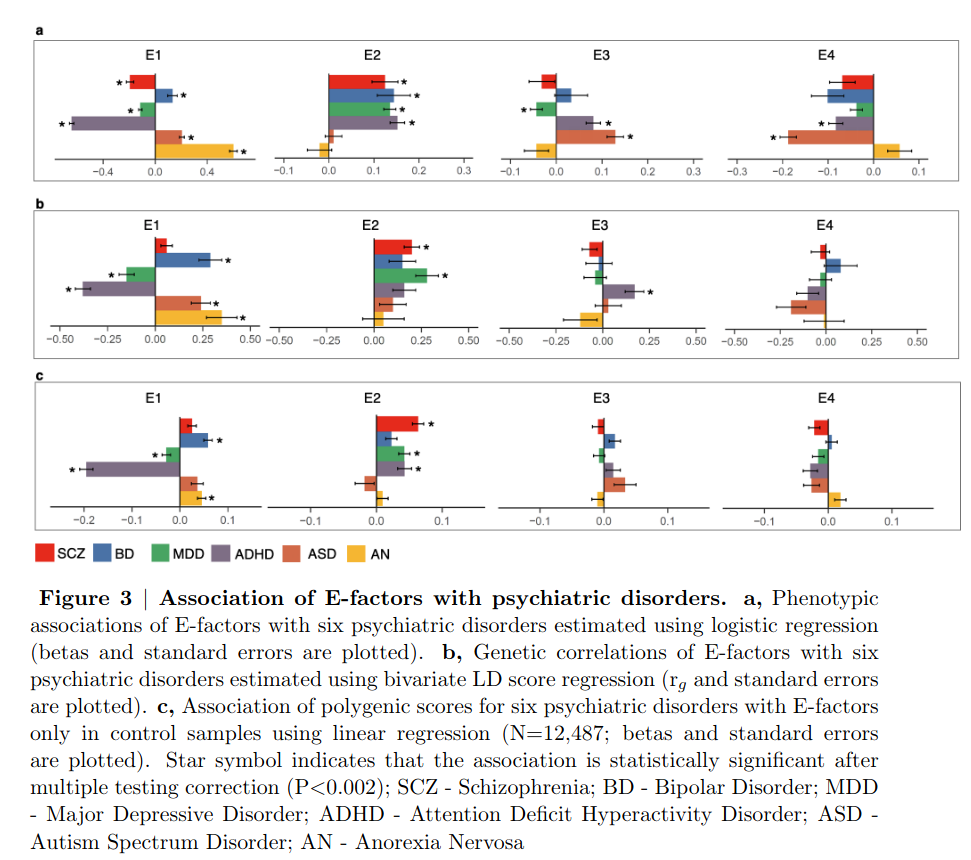
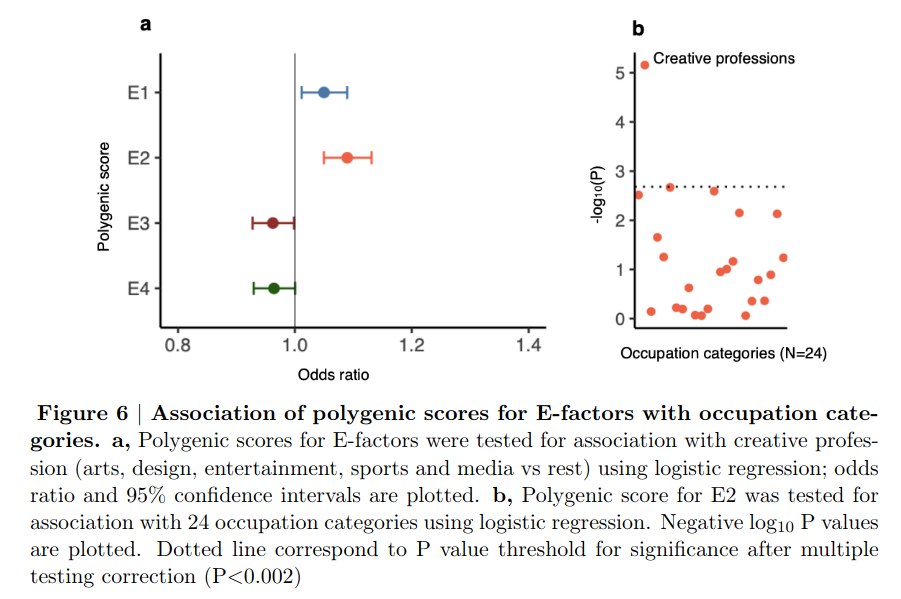
So, E1 is a mix of education ability and g. E2 is verbal tilt vs. math tilt. E3 is dyslexia tilt or perhaps laziness, and E4 is native vs. foreign language. Importantly, the latter can be taken as an index of political nationalism vs. globalism (globalists in Denmark speak very good English). So based on tilt model, we expect some mixed associations for E1, as intelligence has previously been shown to relate differently to different diagnoses: slight positive with weak forms of autism, and bipolar, negative with schizophrenia like issues. We get this pattern here as well. E2, verbal tilt, shows positive associations with schizophrenia, bipolar, depression, and ADHD — just as expected. There are no associations with autism-light (ASD). E4, nationalism proxy, shows negative associations with everything but eating disorder. This is also what we expect.
A different way is to enter verbal ability and math ability into a regression side by side. This results in issues insofar as these don’t have equal reliability, and the more reliable predictor will tend to take on the role of g, but in general, it does confirm the pattern:
But there’s more. They also looked at who works in creative professions (full of woke people), and they do show up as having relation to verbal tilt, as well as a smaller relation to g:
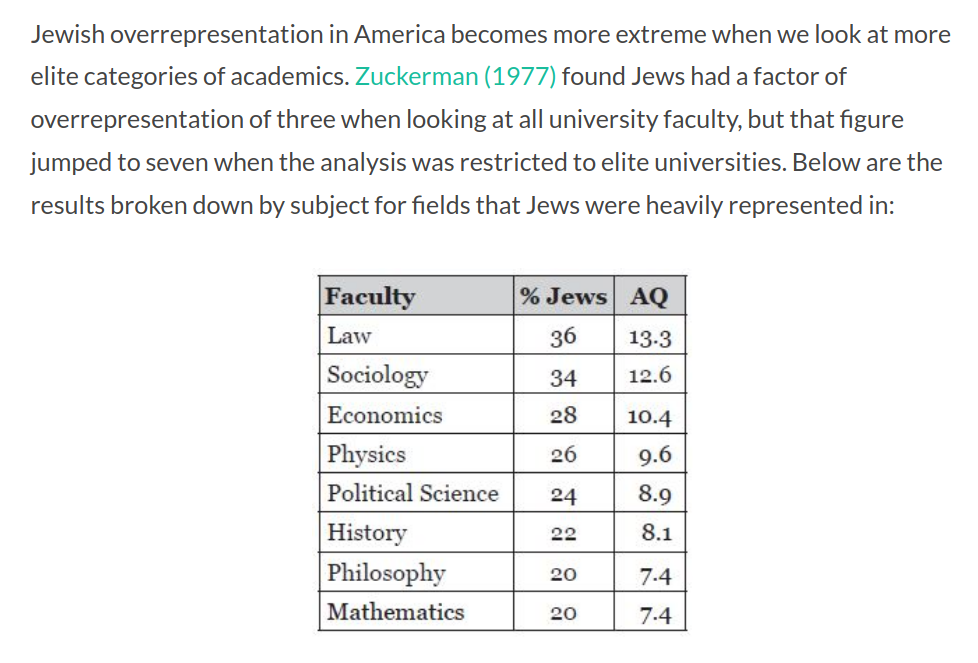
Academic fields
Back in 2013 (!), I reposted mean GRE scores via Razib Khan for US university entrance testing:
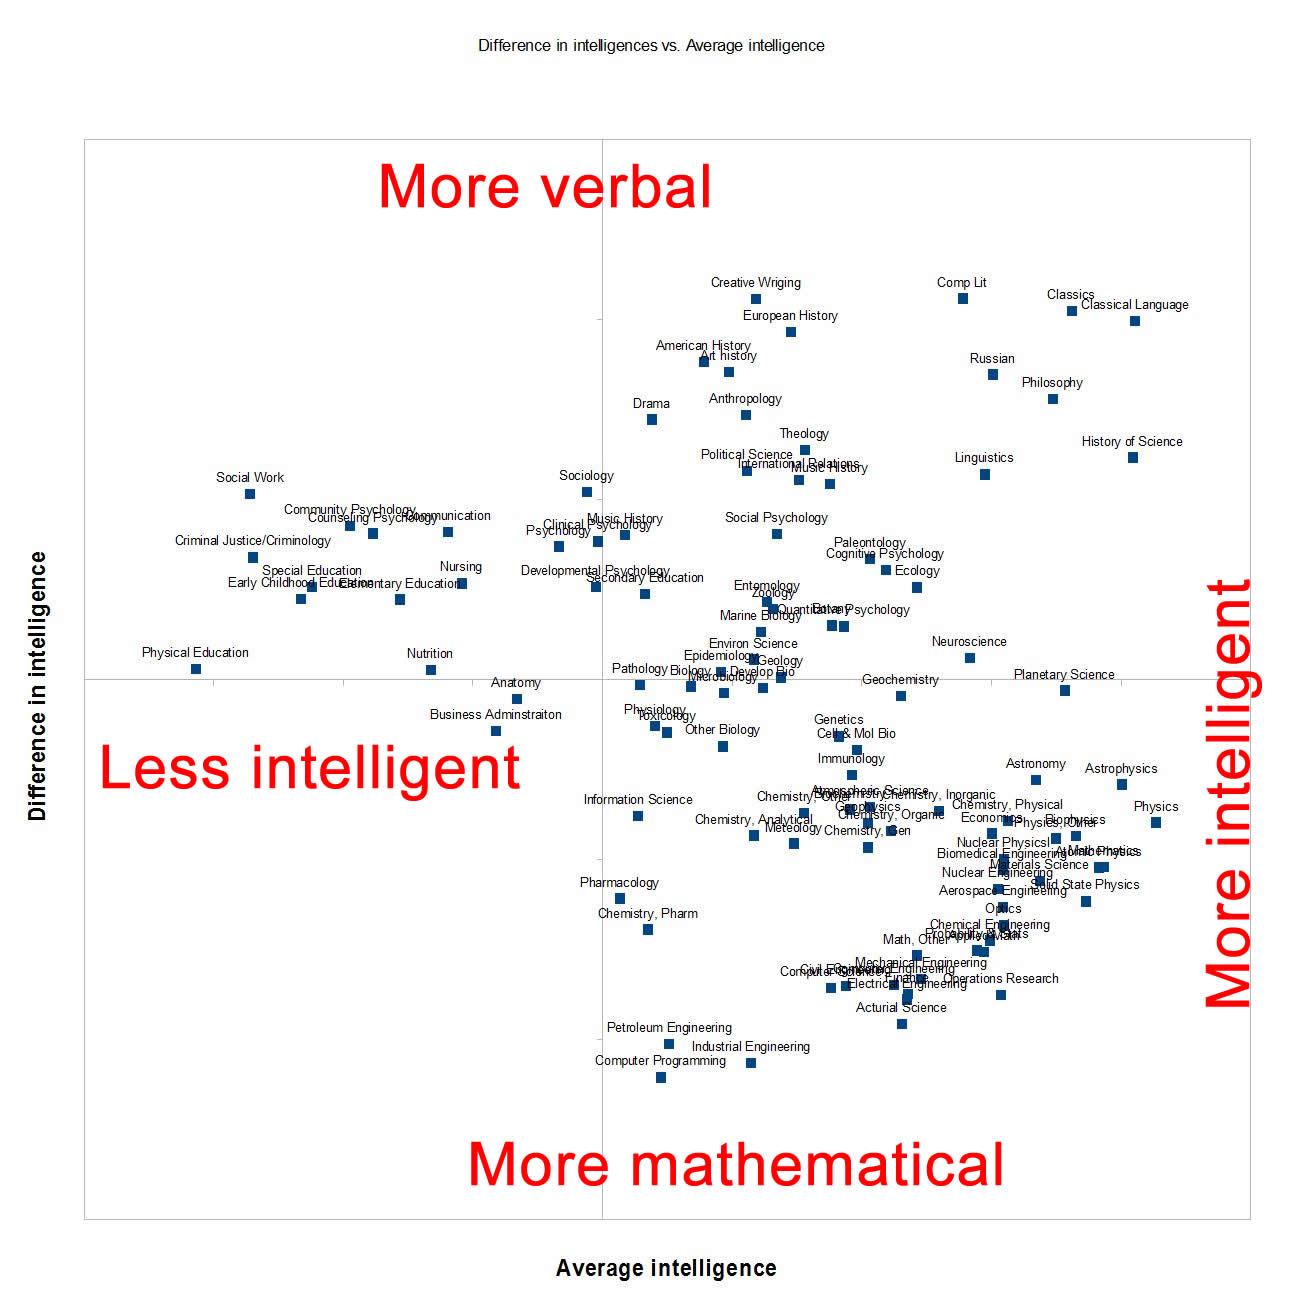
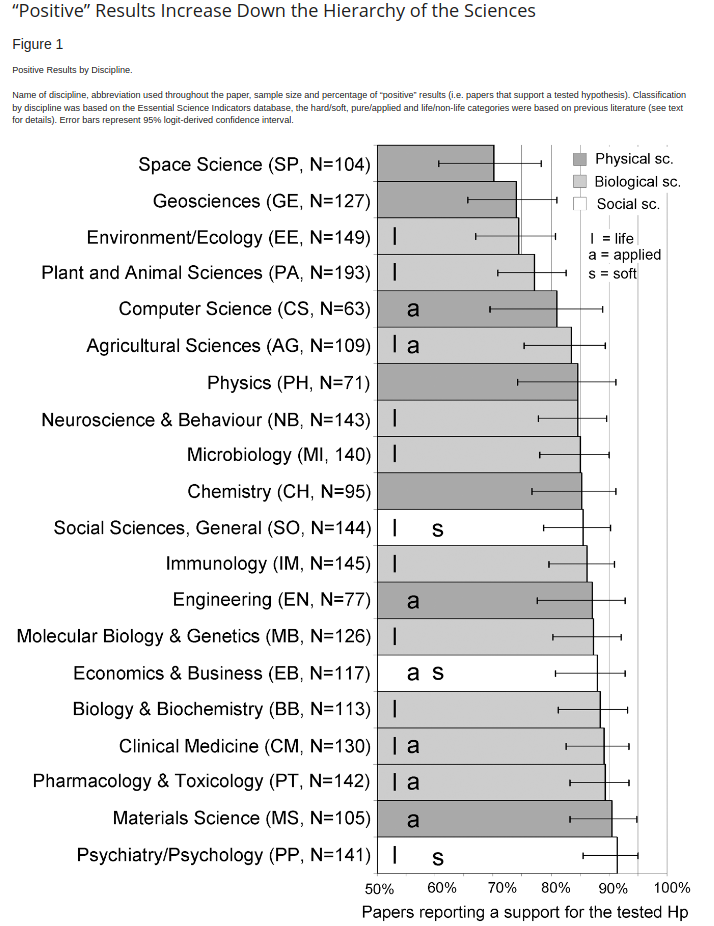
I bet that if checked the above associations for students and professors in these fields, one would confirm the pattern. Importantly, the verbal tilt ones will be more political left-wing and woke (except for classics! also why all the alt-right memes with Romans), and they will have more mentally ill people. They will also have worse scientific rigor measured in many ways. This is not surprising because scientific rigor is strongly related to quantitative skills, whereas verbal skills are also likely to just help you delude yourself with verbal arguments (typical of high g high V people). To give some examples, the more quantitative areas of psychology have fewer issues with replication crisis (IQ research, the poster child for empirical quantitative psychology vs. social psychology, super left-wing and terrible stats). It should be possible to gather data on these because there are studies published which have scientific rigor by field, e.g. the classic paper by Fenelli 2010:
This study has quite small samples, but it is possible to automate measures of scientific rigor from papers, as I have written about before (e.g. in 2018,
Wanted: scientific immune system to identify weak studies getting lots of attention). Of course, the above method of looking at the level of p-hacking does not work for fields that don’t even try doing statistical tests (much of humanities). For this, one will need a broader metric, such as density of numbers and equations in texts of papers, proportion of space devoted to figures and tables, and similar. Studies along these lines already exist.
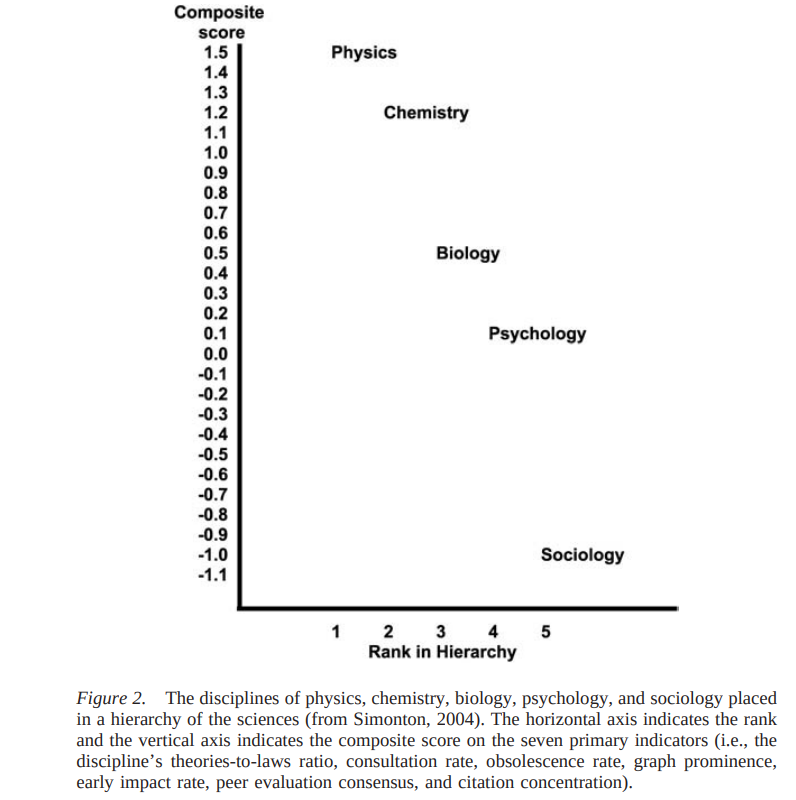
I also bet that if one asked people in general, and PhD students, they would have pretty accurate stereotypes about the relative scientific rigor of academic fields. Here’s a plot from Simonton 2004, aggregating various measures of scientificness of a field:
Notably:
Rated disciplinary hardness: Smith et al. (2000) had psychologists rate disciplines on the degree to which they could be considered “hard” versus “soft.” The respondents used a 10-point Likert scale, with 10 indicating the highest degree of hardness. Seven disciplines were so rated, namely physics, chemistry, biology, medicine, psychology, economics, and sociology. Smith et al. (2000) showed that this subjective assessment correlated .97 with Cleveland’s (1984) measure of graph use. In addition, the investigators showed that the assessment correlated .94 with an independent measure of paradigm development in various disciplines (Ashar & Shapiro, 1990). This measure, although subjective, was included to determine whether the objective assessments concur with more intuitive attitudes about the relative status of different scientific disciplines.
Race and intelligence and verbal tilt
I believe the above model is roughly right and will have certain implications:
It implies that races with verbal tilts will be relatively more represented in creative professions, left-wing groups, and leadership roles: Ashkenazis Jews (not the others, but tentative data), blacks, and I think tentatively Indians (Brahmins in western countries, a priest class). East Asian and Amerindians are the only races I know of with nonverbal tilt (all relative to ordinary Europeans).
I haven’t done any systematic data collection, but generally, it seems that the verbal tilt groups above are relatively more common in leadership roles in Sillycon Valley relative to expected levels by their g and population fraction. Lot of Indian CEOs, not a lot of East Asian CEOs (many of which are half-European or half-Ashkenazi).
In particular, I think the above is a key part of the explanation for the extreme Ashkenazi over-representation in some areas. In general, based on a simple g advantage model, we would expect Ashkenazis to be the most over-representated in the most g demanding fields in academia and life. This is not what we see, we see this, cross-posting from Sean Last’s impressive summary data post on the Jewish question: