A lot of national intelligence criticism focuses on the measurement validity. Are the scores really comparable across countries? Most of the criticism is armchair stuff, or vaguer claims based on smaller studies such as this one:
However, there are proper statistical methods for evaluating this question, i.e., measurement invariance (MI) methods. One can do these either at item level (called DIF, differential item functioning) or test level (with MGCFA, multi-group confirmatory factor analysis), depending on what data one has. Test level data usually is easier to find in the published literature, but the large assessment surveys — PISA, TIMSS, PIAAC etc. — usually have a lot of public item data. For whatever reason, no one has published large measurement invariance studies using these, which is, … odd? Whatever the case, there are a few published test level studies.
-
Bowden, S. C., Saklofske, D. H., & Weiss, L. G. (2011). Augmenting the core battery with supplementary subtests: Wechsler Adult Intelligence Scale—IV measurement invariance across the United States and Canada. Assessment, 18(2), 133-140.
-
Bowden, S. C., Saklofske, D. H., & Weiss, L. G. (2011). Invariance of the measurement model underlying the Wechsler Adult Intelligence Scale-IV in the United States and Canada. Educational and Psychological Measurement, 71(1), 186-199.
This is a salami published study finding that MI holds for USA and Canada comparison. Boring but a start.
Examination of measurement invariance provides a powerful method to evaluate the hypothesis that the same set of psychological constructs underlies a set of test scores in different populations. If measurement invariance is observed, then the same psychological meaning can be ascribed to scores in both populations. In this study, the measurement model including core and supplementary subtests of the Wechsler Adult Intelligence Scale—Fourth edition (WAIS-IV) were compared across the U.S. and Canadian standardization samples. Populations were compared on the 15 subtest version of the test in people aged 70 and younger and on the 12 subtest version in people aged 70 or older. Results indicated that a slightly modified version of the four-factor model reported in the WAIS-IV technical manual provided the best fit in both populations and in both age groups. The null hypothesis of measurement invariance across populations was not rejected, and the results provide direct evidence for the generalizability of convergent and discriminant validity studies with the WAIS-IV across populations. Small to medium differences in latent means favoring Canadians highlight the value of local norms.
-
Wu, A. D., Zhen, L., & Zumbo, B. D. (2007). Decoding the meaning of factorial invariance and updating the practice of multi-group confirmatory factor analysis: A demonstration with TIMSS data. Practical Assessment, Research, and Evaluation, 12(1), 3.
Measurement invariance (MI) has been developed in a very technical language and manner that is generally not widely accessible to social and behavioral researchers and applied measurement specialists. Primarily relying on the widely known concepts in regression and linear statistical modeling, this paper decoded the concept of MI in the context of factor analysis. The paper began by describing what is MI (and lack of MI) and how the concept can be realized in the context of factor analysis. Next, we explained the need for modeling the mean and covariance structure (MACS), instead of the traditionally applied covariance structure, in detecting factorial invariance. Along the way, we addressed the related matter of statistically testing for MI using the Chi-squared likelihood ratio test and fit indices in multi-group MACS confirmatory factor analysis. Bringing to bear current developments by Cheung and Rensvold (2002) and others, we provided an update on the practice of using change in fit statistics to test for MI. Throughout the paper we concretized our discussion, without lack of generality to other constructs and research settings, with an example of 21 cross-country MI comparisons of the 1999 TIMSS mathematics scores.
This is an important study on the failure of MI for countries. In fact, it fails only for some comparisons and the expected ones. It is in fact less damning that one should initially think. That’s because there are only a few tests in their dataset and they use the simplest possible model: g-only

Since nations differ not just in g (or G) but also in non-g ability factors, we expect such failures when these are sizable and ignored (like in this study for sex differences in g).
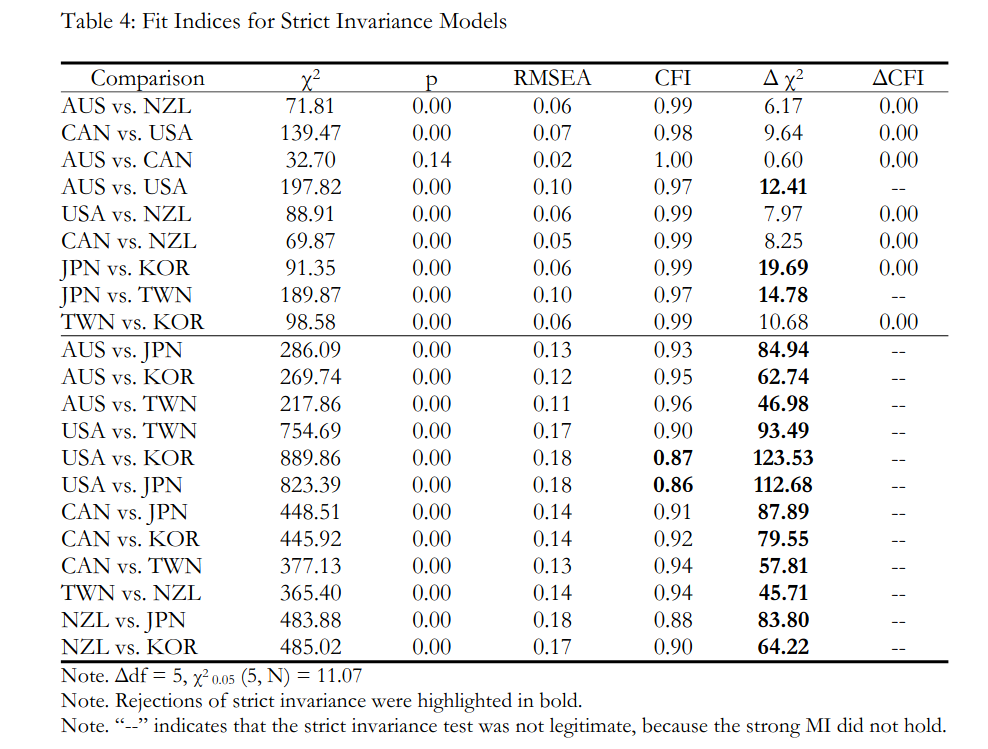
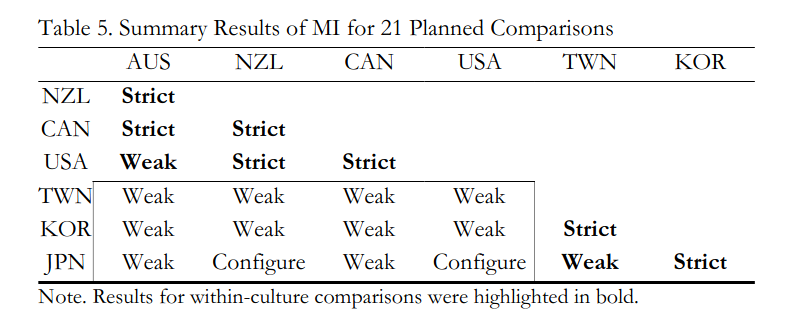
So what their study shows is that within the western group, things are pretty MI, and within the developed Northeast Asians, likewise, but not between. There is of course a well known difference in group factors for these groups related to visual-spatial ability, which is relevant for some math tests and thus would show up in TIMSS dataset. Similarly, doing Spearman Hypothesis testing using Jensen’s method often yields weak results for the same reason. (This problem does not show up when using same method on items from a single test.)
We have several upcoming research projects in this area. Note that I expect to find a lot of item level bias (DIF with p < .001 or whatever), but generally not directional bias at test level because the item bias will be in mostly random direction and thus cancel out at the test level (see this paper, use the mirt package). Academic usually ignore the test level result. One can speculate why: this allows them to publish endless numbers of papers finding DIF in items in test T. Big concern! More research needed! (Give more grant money!) The test level results I have seen in all my DIF analyses so far have all been ~0.