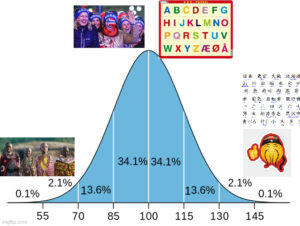
I have not, but Lynn has noted that East Asians have a relative advantage in visual-spatial ability, and that’s their written language, possibly some gene-culture co-evolution. One study shows East Asians who speak English still show this ability tilt. It’s here in his Race Differences in Intelligence, 2nd edition:
Visual memory is not normally assessed in intelligence tests. There have been four studies of the visual memory of the Japanese, the results of which are summarized in Table 10.7.
Table 10.7. Differences Between Northeast Asians and Europeans in Visual Memory
N
AGE
TEST
IQ
REFERENCE
1
760
5–10
MFFT
107
Salkind et al., 1978
2
48
23
Vis. Mem
105
3
72
19
Vis. Mem
110
Flaherty, 1997
4
316
16–74
Vis. Repr.
113
Sugishita & Omura, 2001
Row 1 gives a Japanese IQ of 107 for five- to 10-year-olds on the MFFT, calculated from error scores compared with an American sample numbering 2,676. The MFFT consists of the presentation of drawings of a series of objects, e.g., a boat, hen, etc., that have to be matched to an identical drawing among several that are closely similar. The task entails the memorization of the details of the drawings in order to find the perfect match. Performance on the task correlates 0.38 with the performance scale of the WISC (Plomin and Buss, 1973), so that it is a weak test of visualization ability and general intelligence as well as a test of visual memory. Row 2 shows a visual memory IQ of 105 for ethnic Japanese-Americans, compared with American Whites, on two tests of visual memory; they consist of the presentation of 20 objects for 25 seconds (which are then removed); the task was to remember and rearrange their positions. In Row 3, we have a visual memory IQ of 110, obtained by comparing a sample of Japanese high-school and university students with a sample of 52 European students at University College, Dublin. In Row 4, we find a visual memory IQ of 113, for the visual reproduction subtests of the Wechsler Memory Scale-Revised, obtained from the Japanese standardization of the test compared with the American standardization sample. The test involves the drawing from memory of geometric designs presented for 10 seconds. The authors suggest that the explanation for the Japanese superiority may be that Japanese children learn kanji, the Japanese idiographic script, and this develops visual-memory capacity. This hypothesis was apparently disproved by a study by Mary Flaherty and Martin Connolly (1996), whose results are shown in Row 2. Some of the ethnic Japanese-American participants had a knowledge of kanji, while others did not; there was no difference in visual memory between those who knew and those who did not know kanji, disproving this essentially environmentalist theory.
Lynn goes too far based on that small study, n = 48. Still, an interesting idea. There is a potential here that visual ability evolved due to an initially idiosyncratic cultural choice of ideograms/logograms or similar scripts, and then since written skills were important for survival, later this language feature resulted in a stronger selection for this particular mental skill, beyond g. This model predicts that East Asians will continue to show the visual advantage even when they have no knowledge of their ancestral languages.
In another way, of course, we know that language families are very strongly related to genetic differences. A nice study, the PC on race aside:
-
Baker, J. L., Rotimi, C. N., & Shriner, D. (2017). Human ancestry correlates with language and reveals that race is not an objective genomic classifier. Scientific reports, 7(1), 1-10.
Genetic and archaeological studies have established a sub-Saharan African origin for anatomically modern humans with subsequent migrations out of Africa. Using the largest multi-locus data set known to date, we investigated genetic differentiation of early modern humans, human admixture and migration events, and relationships among ancestries and language groups. We compiled publicly available genome-wide genotype data on 5,966 individuals from 282 global samples, representing 30 primary language families. The best evidence supports 21 ancestries that delineate genetic structure of present-day human populations. Independent of self-identified ethno-linguistic labels, the vast majority (97.3%) of individuals have mixed ancestry, with evidence of multiple ancestries in 96.8% of samples and on all continents. The data indicate that continents, ethno-linguistic groups, races, ethnicities, and individuals all show substantial ancestral heterogeneity. We estimated correlation coefficients ranging from 0.522 to 0.962 between ancestries and language families or branches. Ancestry data support the grouping of Kwadi-Khoe, Kx’a, and Tuu languages, support the exclusion of Omotic languages from the Afroasiatic language family, and do not support the proposed Dené-Yeniseian language family as a genetically valid grouping. Ancestry data yield insight into a deeper past than linguistic data can, while linguistic data provide clarity to ancestry data.

