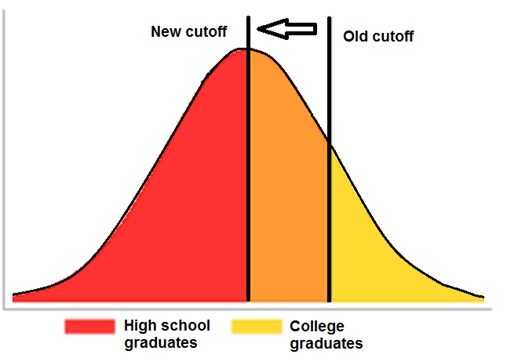
One very basic fact of humans is that ability to do anything varies. This is also true for ability to do cognitively demanding jobs of which the main requirement is general intelligence. This trait follows a well known normalish distribution in the population. In general, then, it follows that the more people society dedicates to some activity, the lower average ability, and in this case, intelligence, of these people. This is equally true whether we are talking about dentists, mechanics, or various kinds of students. Thus, when we increase the proportion of the population that enrolls in some level of academic study, the lower average ability of such students. A lot of confusion in the literature results from ignoring this consequence and comparing just the educational levels as if these were invariant indicators over time. For instance, this gives us headlines such as The value of a high school degree has collapsed since 1980 with conclusions:
- The average income of high school grads has declined 12% during the past 40 years.
- Advanced degree holders, meanwhile, have enjoyed an 18% increase in income during the same time.
- The value of a high school degree has declined along with a loss of manufacturing jobs and an increase in low-wage service jobs.
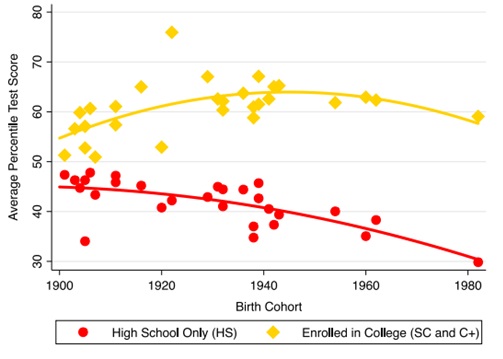
It is a rather trivial consequence of the falling human capital levels of people with just completed high school. In a nice 2014 blogpost, Todd Schoellman and Lutz Hendricks explain this with graphs:
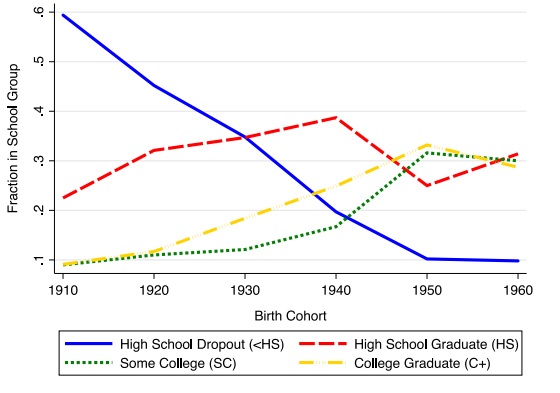
Over at Audacious Epigone, we can find the mean IQs by degree over time:

The increased uptake of course also means that the curriculum and associated exams must be continuously made easier for the students to keep up their pass rates. They don’t make them like they used to do.
The main reason, though, I am writing this post is due to this pretty cool study using Danish data:
-
Akcigit, U., Pearce, J. G., & Prato, M. (2020). Tapping into talent: Coupling education and innovation policies for economic growth (No. w27862). National Bureau of Economic Research.
How do innovation and education policy affect individual career choice and aggregate productivity? This paper analyzes the various layers that connect R&D subsidies and higher education policy to productivity growth. We put the development of scarce talent and career choice at the center of a new endogenous growth framework with individual-level heterogeneity in talent, frictions, and preferences. We link the model to micro-level data from Denmark and uncover a host of facts about the links between talent, higher education, and innovation. We use these facts to calibrate the model and study counterfactual policy exercises. We find that R&D subsidies, while less effective than standard models, can be strengthened when combined with higher education policy that alleviates financial frictions for talented youth. Education and innovation policies not only alleviate different frictions, but also impact innovation at different time horizons. Education policy is also more effective in societies with high income inequality.
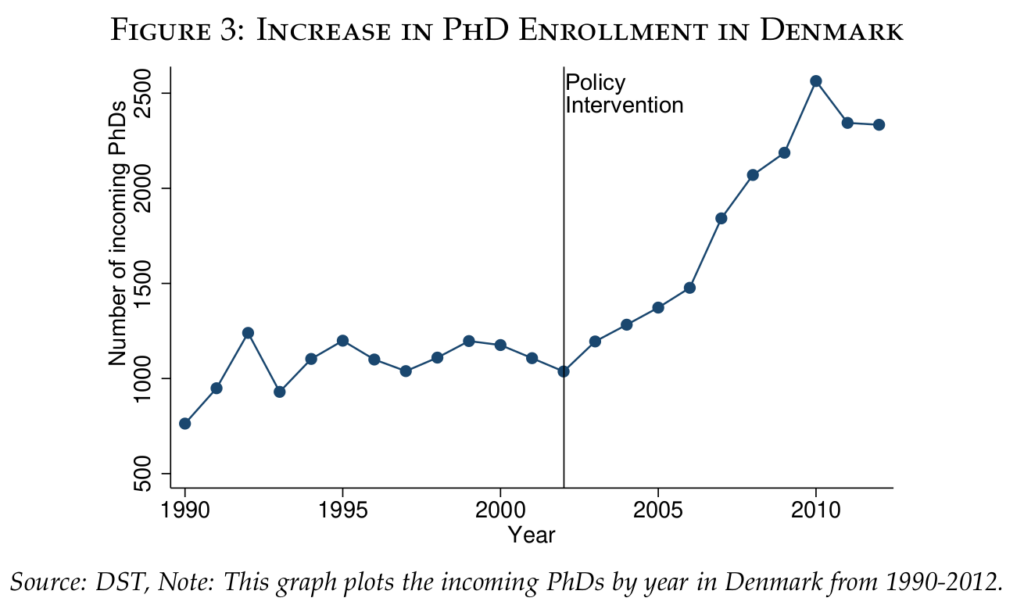
The key figure:

As authors explain:
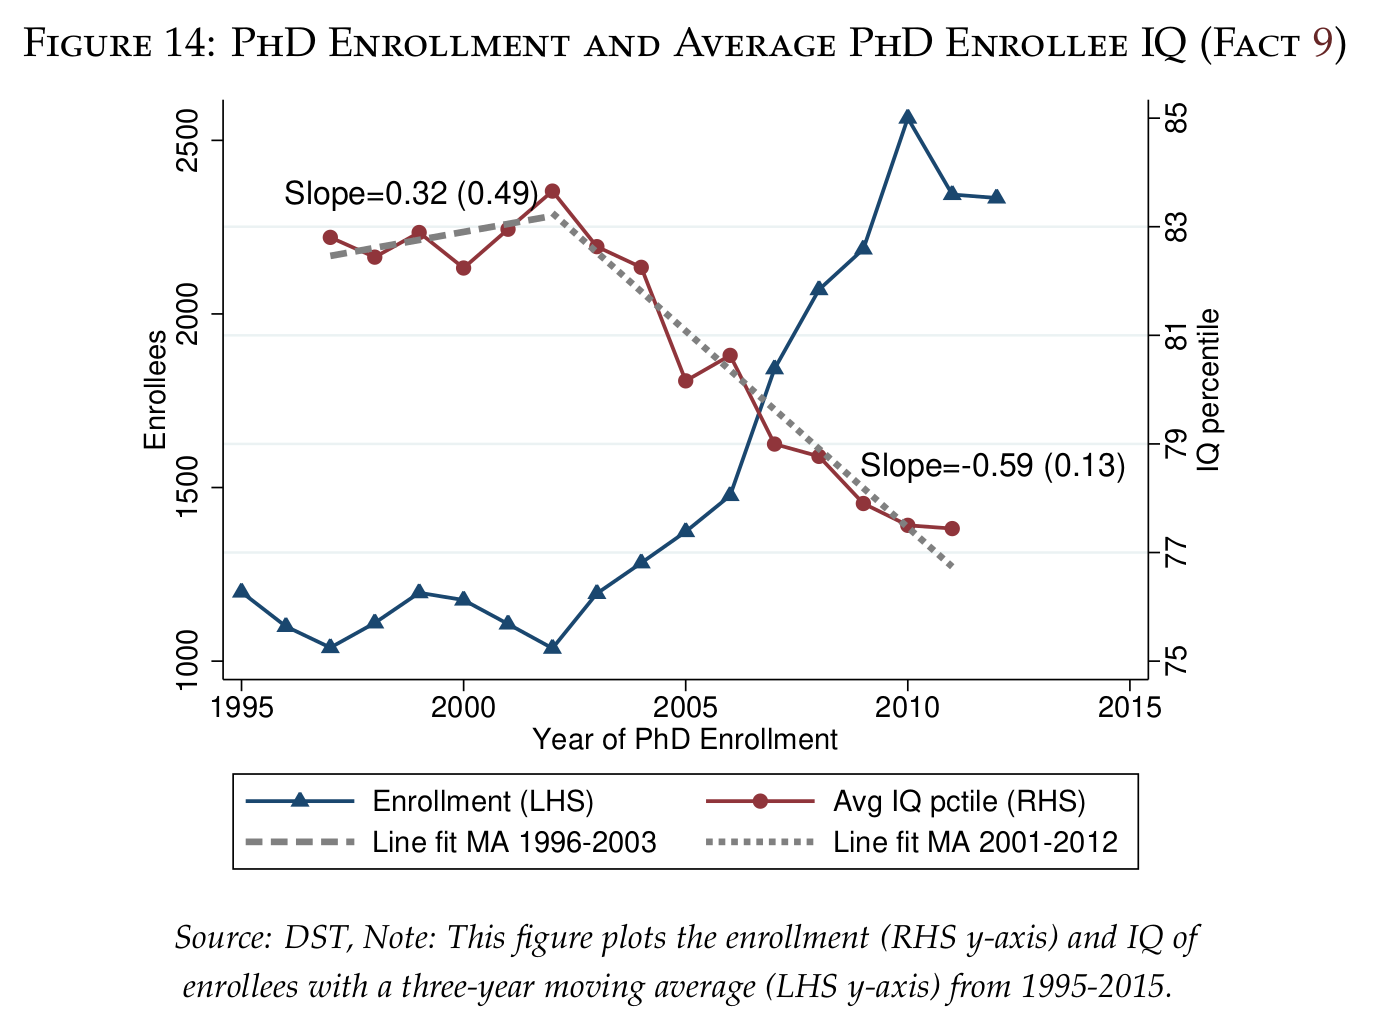
Starting in 2002, the Danish Government required the universities to increase the number of PhD slots, as part of a larger initiative to support education and innovation in Denmark (see Section 2 for further institutional details). Figure 14 shows that as the number of slots for PhDs increases, the average IQ of the enrolling students falls. This indicates that there is heterogeneous quality of enrollees and expanding slots may draw in a marginal researcher less talented than the average researcher from the existing pool. Thus, even though policy can increase the supply of researchers, there is a trade-off between expanding the pool of PhDs and the average talent of PhDs in the economy.
The authors method of treating the IQ data is seemingly inappropriate. One has to take the mean of IQs, then transform to centile. Taking the mean of centiles produces a negative downwards bias. With this in mind, we see that the average IQ centile decreased from about 83th to 77th in less than 10 years after this policy change. This represents a drop from about 114.3 to 111.1 IQ (in R; qnorm(c(.83, .77), 100, 15)). These IQs are quite low already. I did some simulations to see how large this bias is, but it seems to be only about 1 IQ point, so not a big deal here. Other plots from the paper:
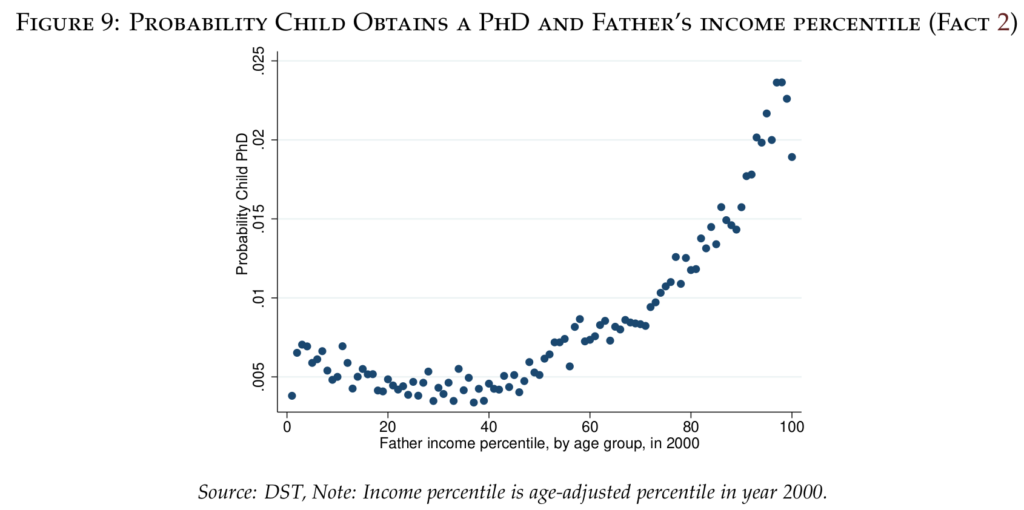
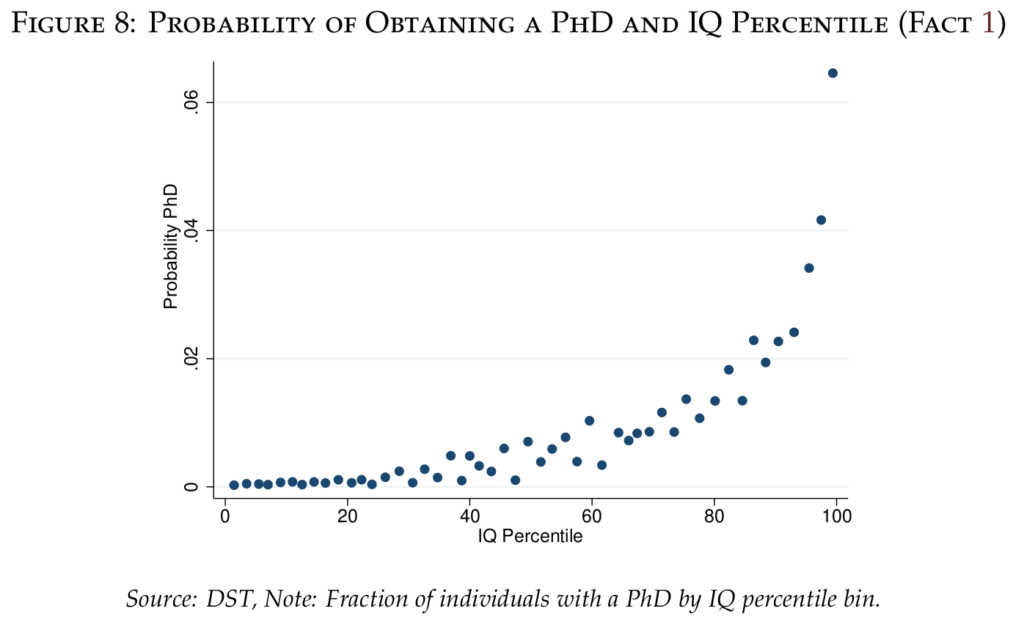
The main thing to note here is simply the values on the Y axis. Having a father in 99th income centile gives about 2.2% chance of obtaining a PhD, but having an IQ in the 99th centile gives about 6.5% chance, or nearly 3x the effect size.