Some time ago, I published a 50 minutes long video walkthrough of some research on economics effects of immigration for Nordic countries. Since some people don’t really watch videos, I thought a written summary might also be handy, so here we go. For those who prefer video, it is here:
Slides here. In fact, we will be reusing material from the slides, and adding in some more recent research on top.
First, let’s begin with what the experts say, at least in public. There’s this juicy survey of top economists from the IGM Forum (whatever that is). The survey is from 2017, so just after the 2015ish migrant invasion into Europe. The specific statement the economists were asked to show their agreement or disagreement with was:
The influx of refugees into Germany beginning in the summer of 2015 will generate net economic benefits for German citizens over the succeeding decade.
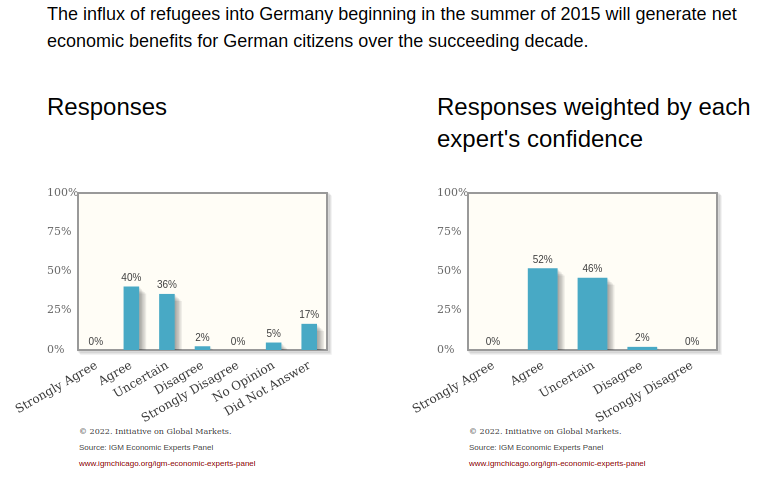
So basically everybody is either positive (agree) or “I dunno”. The latter could be pretending to not know while actually disagreeing. One can even read famous economists state their reasons:
I’m not aware of any evidence that says that immigration has long-run domestic costs — though it may impose short-term adjustment costs.
Which world does David Autor live in? There are some people who didn’t say “disagree” yet stated such reasons, such as Kenneth Judd:
The generous German welfare state will be burdened by the costs of absorbing these immigrants. E.g., they do not speak German.
Anyway, there is in fact a lot of such research, so I can’t say whether David Autor is lying or astonishingly ignorant despite being a famous economist whose specialty is even in labor economics.
There’s a few reasons my focus is on the Nordic 🇩🇰🇳🇴🇸🇪+🇫🇮 data:
- Global front runners
- Very high human development index, Nobel prizes per capita etc.
- If they can’t make it work, then who can?
- Great register data
- All public sector databases linked by unique ID
- Allows for very detailed and very large studies (population size being the limit)
- Years of published reports about effects of immigration on the economies
- But in local languages, so foreigners are mostly not aware of the results
Since I can read 3 of these 4 languages, I have a big advantage to others in bringing out some of the findings. Also for related reasons we focus on Denmark because it has the best studies and it is the easiest for me to read. Why does it have the best studies? Well, Denmark is markedly more based than Norway and Sweden, or least so people say. We’ve got the (in)famous sort of immigration skeptical social democrats, while those in other countries are still living in dreamland or planning the next communist take-over. Furthermore, the Danish government (the last one) ordered the ministry of finance do compute economic analyses of immigration, and these reports come out every year. We can look at the most recent one from late 2021, called Indvandreres nettobidrag til de offentlige finanser i 2018 — Immigrants’ net contribution to the public finances in 2018. So it looks at the data from 2018 and is published in 2021, presumably because it takes some time to get all data through all the databases, analyzed, and a report written up. The first few reports were somewhat tricky to interpret because of the very recent migrant arrivals, so this one based on the 2018 data is somewhat better, but as we will see, the picture is largely unchanged except for Syria.
How does one compute the net economic contribution per person? Well, one leverages the awesome (or fearful, if you want) register data, which has essentially all govt data on every legal resident in Denmark. It means the state knows who your parents are, where you are born or immigrated from, where you went to school, which doctors you saw, diagnoses you got, times you get robbed and robbed someone else, which education you finished and didn’t, and so on. Some of these economic reports are also published in English, so I found this summary of the included costs and contributions from this 2015 report The impact of immigrants on public finances: a forecast analysis for Denmark.
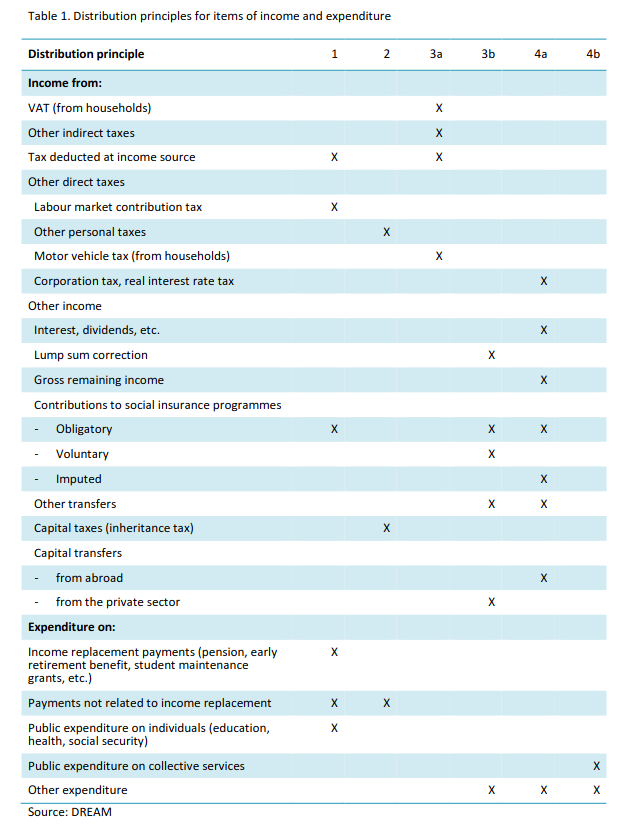
Now the government doesn’t know all the things you buy (yet) but it knows how much money you made (via tax records) and it thus has a very good idea on how much money you spent as well. One can add estimates for sales tax stuff on top. Anything one cannot point to a specific person is assumed to be the same for each person. Going back to the main report, we get this figure, to which I’ve added translations:

These are the same numbers that The Economist recently based their coverage on.
The Danish state does not literally ask people who are Muslim and who are not, but the origin countries can be grouped after Islamic %, and this group is the one they have come up with MENAPT, i.e., MENA with Pakistan and Turkey but not Bangladesh. This also excludes southeast Asian Muslims, mainly Indonesia and Malaysia, but it’s not much of a problem since these people are rare and low crime in Denmark anyway.
Anyway, the figure shows the net contribution of some person for a given age based on their modeling (DREAM model). We see that age has a massive effect. Everybody is a net negative person until above mid 25s. This is due to people not working much before this age, but consuming a lot of resources via education and health. In the big middle age, people then repay their ‘social debt’ by being net positive. This lasts until about age 70, where it is again increasingly net negative until death. People don’t work much in retirement, and while they do consume based on their pensions, this is not enough to make up for their very large health costs in old age. Since now everybody survives to every age, one cannot just take a normal integral (area under curve) to get a given person’s or group’s net value, one has to multiply by survival probabilities.
The differences between the colored lines are obvious and large. The blue line is of course interest as this is the main problem group, and the largest. It’s always net negative. There is no age at which this group contributes more to society than it receives. Obviously, this group cannot be a benefit economically to society at any point then, not even if you imported only 30 year olds, and kicked them out at age 60. All the other groups do worse than the natives, which is not surprising because ethnic Danes do well in other countries too. This is just a standard tale of good human capital for this ethnic group. Still, the other groups are at least net positive at some points in their lives, but just not enough.
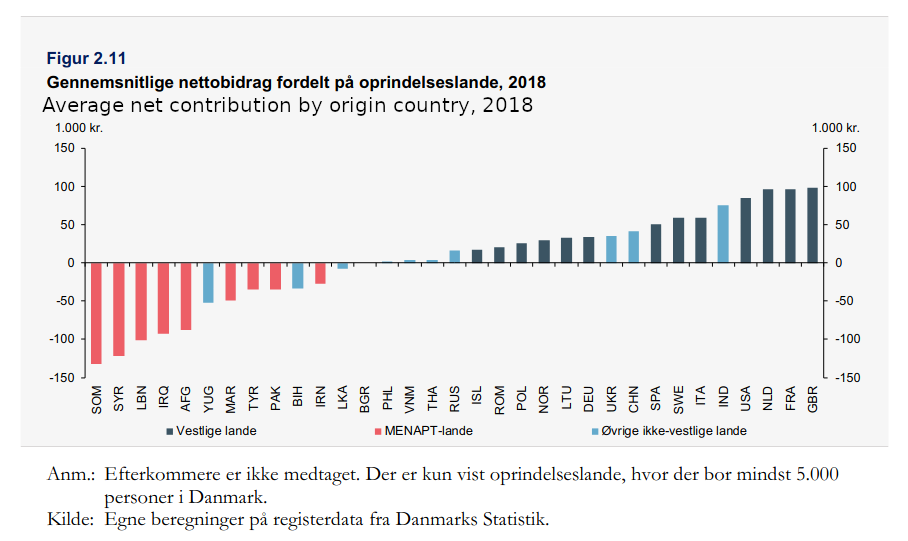
OK, what about the life time net contributions by country? These values are not age and sex standardized, thus they show how the current economic situation is for each country. Countries that send working age people are better here than they will be long-term. Long term, the initial age and sex composition differences will be about 0. We will return to that shortly.
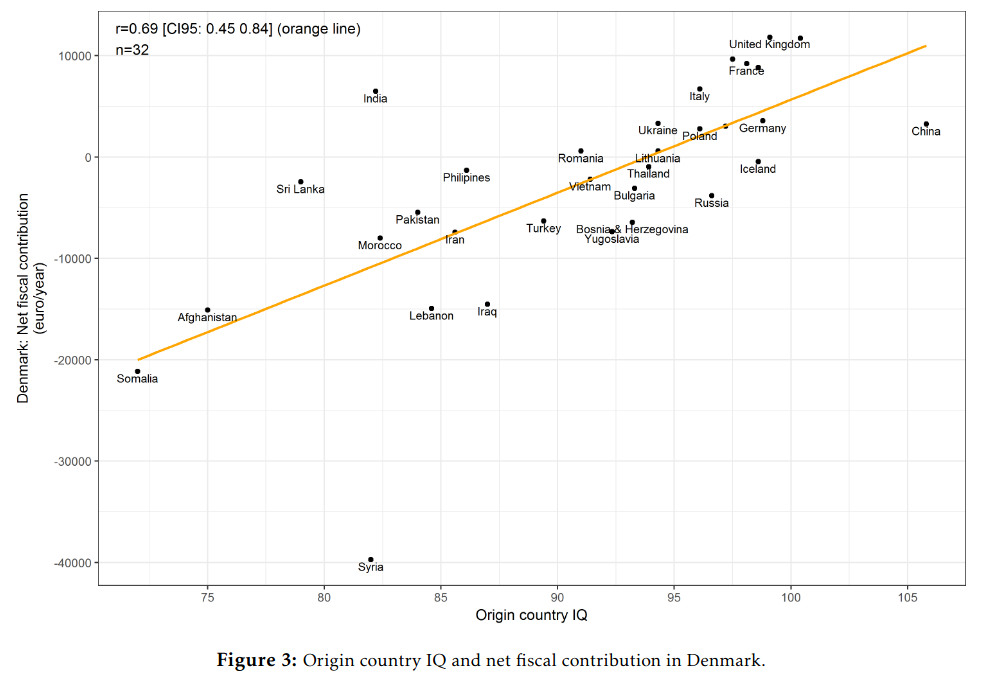
OK, so we need some rather big differences, but none that surprise readers of this blog. I have already published research on how these relate to national IQs back in 2017 using the then current values:
Syria is very low there because these are the ones who just arrived. Syria is no longer the lowest group (now second lowest!) because these people had some time to assimilate and get jobs.
The plot is less than perfect also because the age compositions differ by group. How do they look like? They don’t give a figure by national origin (we could fetch data and plot ourselves), but there’s one in another government report on immigration: Indvandrere i Danmark 2021 – Immigrants in Denmark 2021:
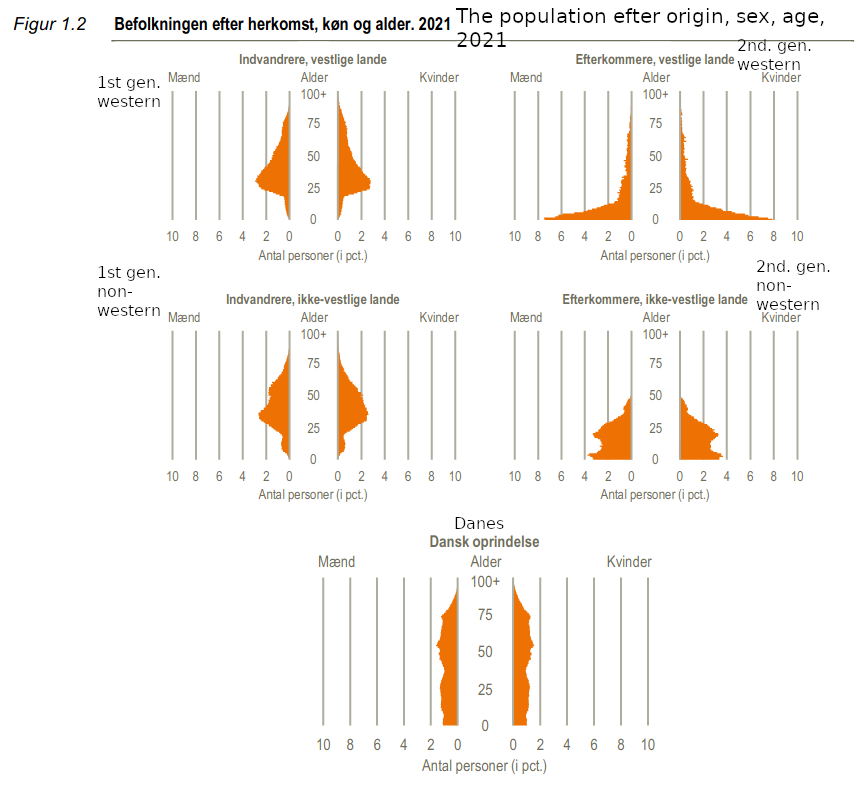
This report doesn’t use the MENAPT group, but this group is mostly the same as the non-western group, since people from India, Japan etc. are rare in Denmark. What can be seen in that 2nd gen. immigrants are very young, so they are only so far in the early part of that net contribution curve from before. The 1st gen. immigrants are largely free of children, so they actually look somewhat better than they would be if their age and sex composition was representative of the Danes, which we see in the bottom part. So, next question: what are the current contributions by these groups taken as whole?
- Indvandrere og efterkommere i alt [immigrants all together] -24 billion DKK
- Indvandrere og efterkommere fra vestlige lande i alt [western immigrants] +7 billion DKK
- Indvandrere og efterkommere fra ikke-vestlige lande i alt [non-western immigrants] -31 billion DKK
- Indvandrere og efterkommere fra MENAPT-lande [MENAPT immigrants] -24 billion DKK
- Indvandrere og efterkommere fra øvrige ikke-vestlige lande [non-MENAPT non-western immigrants] -7 billion DKK
Tese numbers include both 1st and 2nd generations. So currently, the Muslims are costing Denmark at least 31 billion DKK a year, or about 4.7 billion USD pear year. Denmark’s gross national income is 362.6 billion dollars, so this expensive some 1.3% of our nation’s income. This is not peanuts. The western immigrants are current a nice surplus, but only because they come here as adults to work and aren’t old enough to be pensioned yet. As we saw in the age curve from before, they too will turn net negative at some point. Why? Because ethnic Danes are close to net neutral, so any group doing worse than them will be a liability. The table with these values summarized is here, which also includes the averages by group and by year:
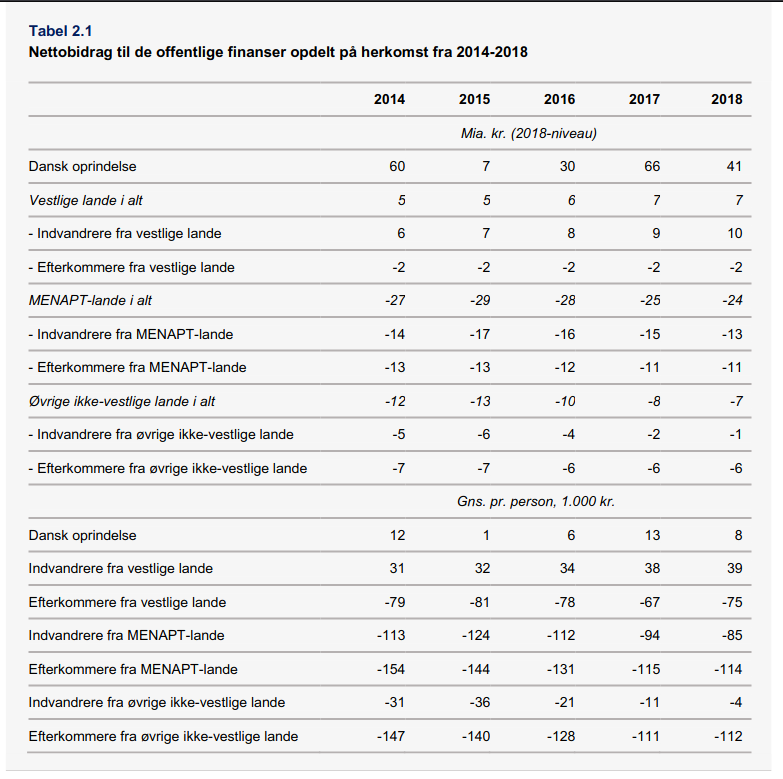
I trust the reader has learned enough Danish to read this by now. The bottom part is the averages per person. Here we see that ethnic Danes hover close to 0, being only slightly positive across the 5 years. The large improvements seen for the immigrant groups has to do with their age structures or recent migration status. E.g., the 2nd generation MENAPT (efterkommere) are entering the work force, and thus starting to contribute taxes whereas previously they were almost exclusively children.
More interesting are estimates over a long term. From a rational(ist) perspective, these are the long-term effects that we care about the most. What does it matter if some group will be a temporary benefit if their descendants the next 100 years will be forever negative? The report also provides some of these age and sex composition adjusted values:
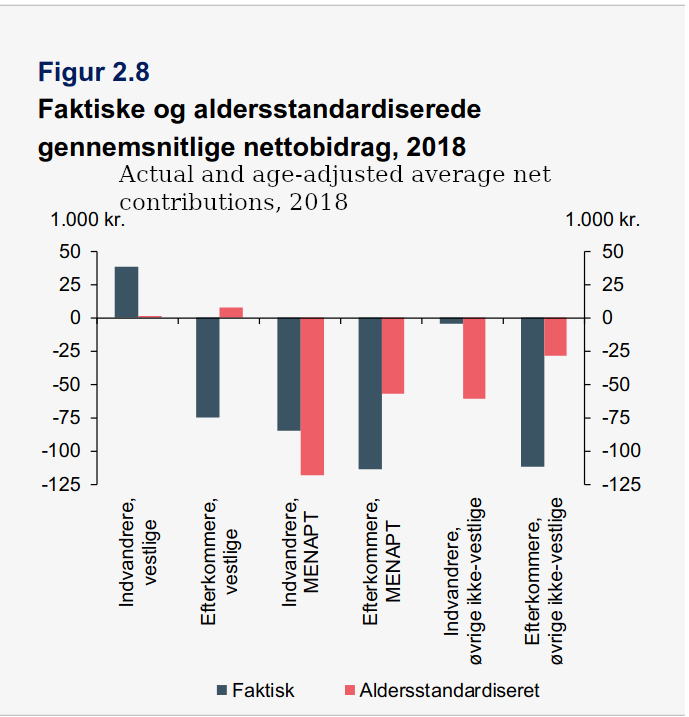
The blue bars are the current net contribution averages, and the red are age-adjusted. Age-adjusted means that the value was computed assuming the same age composition as that for the Danes. So we see that the western immigrants contribution go to ~0 and they become neutral instead of a big benefit. This is the same as to say that their performance is almost as good as the Danish one on the line plot we saw initially. The second generation western turn a slight profit according to the model, so western immigration to Denmark is largely not a problem insofar as economics is concerned when we take the long-term view. First generation in the Muslim group would actually be worse if they had the same age contribution. This is because there are very few children in this group, so the state doesn’t spend money on their education. The 2nd generation Muslim group would still be a large negative even if their age distribution was not so young as it is. It will be go about -50k DKK per person per year. So, in the long run, such people cost the Danish state some 7.6k DKK per year. We have some 600k of such persons, growing fast, so you can do the math, and figure out they will be a burden of some 4.5 billion USD per year.
“But Emil, not everybody is like that, NAXALT!” True, so what are the distributions?
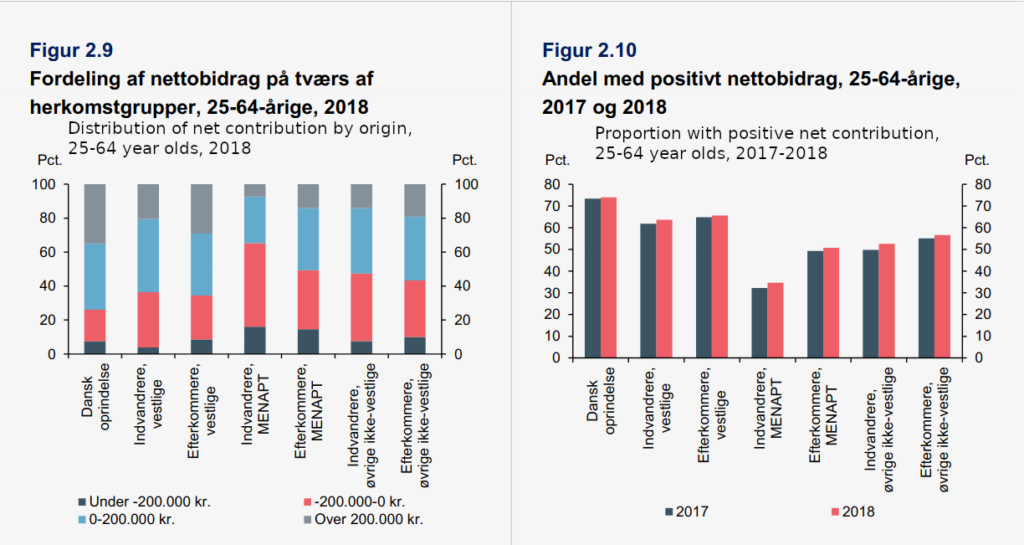
They don’t show us just histograms, but each group is split into 4 groups of which 2 are negative and 2 are positive. Grey is very positive and dark blue is very negative. The right side plot is easier which just shows the positive proportion. Both figures only concern working age persons, so they are partially age-adjusted. We see here for Danes, the value is some 75% being net positive, and for 1st gen. Muslims, it is more like 35%, while second generation is about 50%. All the other groups are intermediate.
OK, we’ve seen which countries and age groups are good, now what about other classifications? Which ones should we let in? Glad you asked:
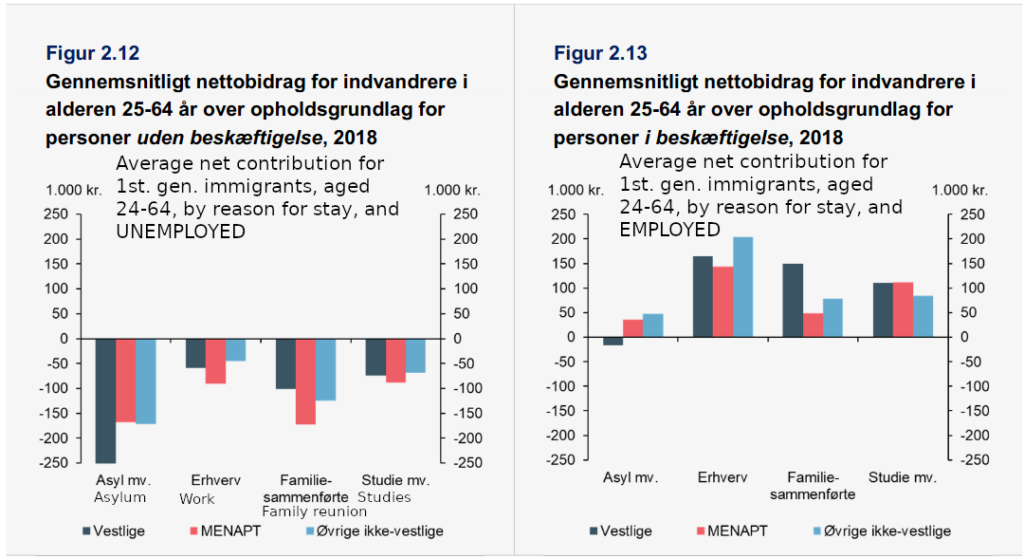
So they for whatever reason break the plot by employment status. I guess to show that if we could merely get people employed, this would be sufficient to fix things (i.e., get to >0). Anyway, we see that asylum people are very bad for the public finances, family reunion people also bad. Employment and people who came to study and who work at the same time are also good.
This completes the basic walkthrough. We’ve seen that:
- Immigration age composition is very important for the current net contribution status.
- Immigrant numbers are very important for the total effect on society.
- Adjusting for age composition does not make immigrants net positive for Denmark.
- There are very large differences in net contribution by origin country, and these relate obviously to intelligence, our favorite human capital component.
- Immigrants who come to work and study are mainly alright, those who seek asylum and family reunion are bad for business.
- It’s not just a few bad apples that ruin things for the bad groups, it’s sometimes more than 50% of them who are net negative.
With these in mind, we can look at some example statistics from other countries.
Norway
The famous Brockmann government report compiled a lot of data: Integrasjon og tillit — Langsiktige konsekvenser av høy innvandring — Integration and trust, long-term consequences of high immigration (2017). They also computed some economic results, but in general we don’t need to look at these, because looking at any important measure of human capital or aspect of contribution shows the same general picture. Here’s the unemployment rates by origin country:
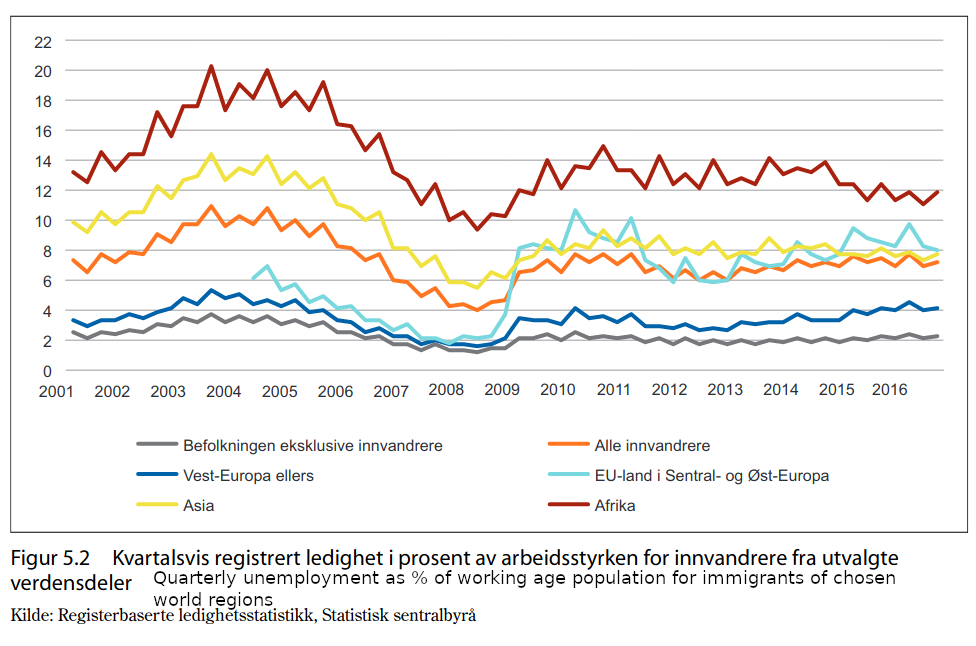
So in Norway, as in Denmark, unemployment the highest for African immigrants. They unhelpfully use a group called “Asia” which mixes up MENAP with Indians etc. The grey line are the Norwegians themselves. Here’s a plot from another dataset with employment rates in the three Scandinavian countries:

These of course relate to national IQs in the usual way:
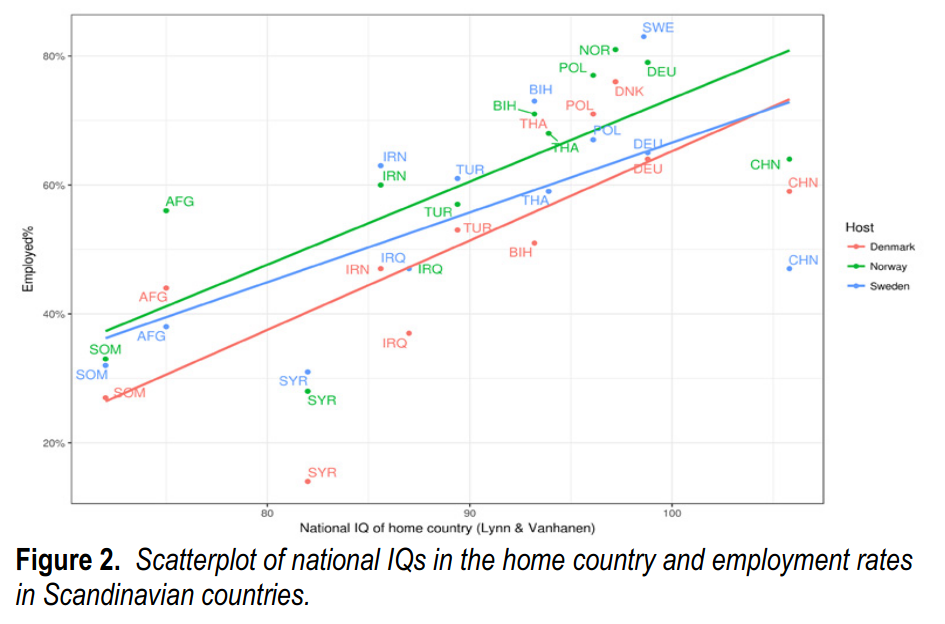
These plots are from my 2017 paper on the topic.
Finland
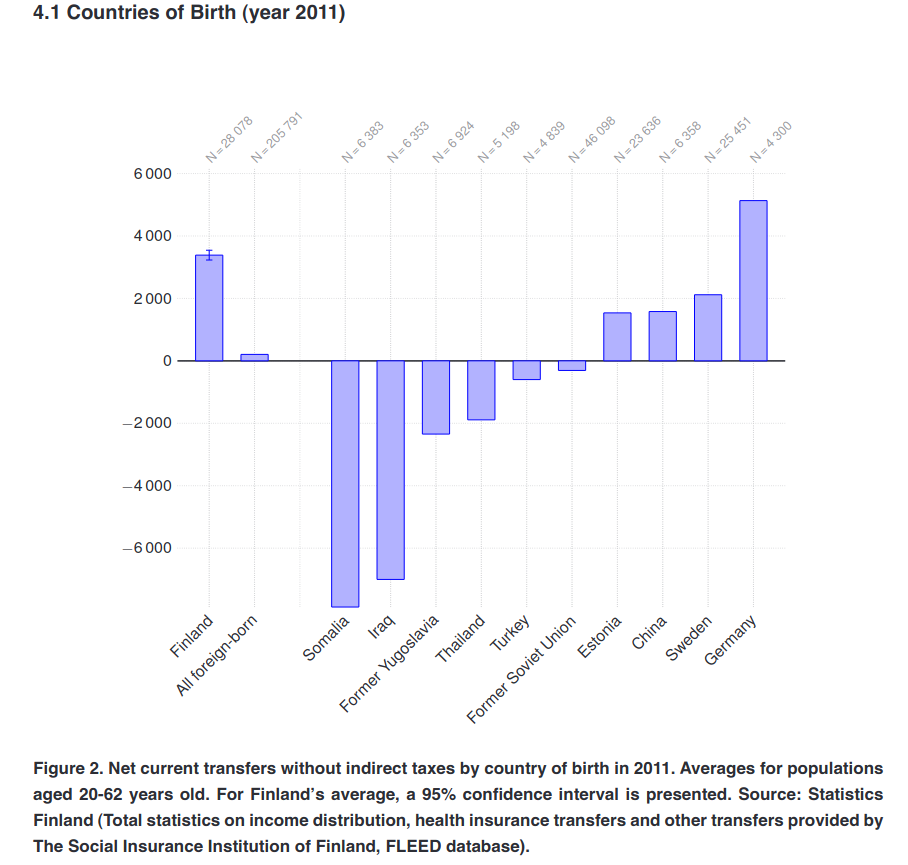
Finland has a report too, with an English summary and some figures: Immigrations and Public Finances in Finland Part I: Realized Fiscal Revenues and Expenditures:
Netherlands
A very good report recently came out in Dutch: Borderless Welfare State: The Consequences of Immigration on Public Finances (2021). There is an English language summary at James Thompson’s blog and also by Jan te Nijenhuis in Mankind Quarterly. Lifetime net fiscal contribution looks like this:
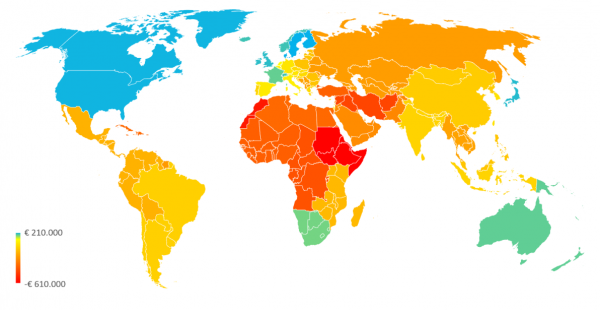
In values:

The most important part of this report is that it also linked immigration performance to CITO scores, a scholastic test. Authors say:
Furthermore, a robust correlation exists between net contribution and scores on the so-called ‘Cito test’, a 50-point student assessment scale for primary education. For natives, lifetime net contributions range from roughly –€400,000 for the lowest Cito score to +€300,000 for the highest Cito score. For people with a second-generation migration background, a similar correlation exists, though at a considerably lower level.
There are considerable differences in Cito scores between regions of origin and also between migration motives. At group level, the net contribution of first-generation and second-generation immigrants is closely related to the Cito scores. The Cito scores and the educational level of the second generation are strongly related to the educational level of the first generation. Partly for this reason, any educational attainment of the first generation affects the net contribution of the second generation. ‘Mixed relationships and marriages’ have a considerable positive effect on the Cito scores and thus, the net contribution of the second generation.
Quoting the entire te Nijehuis’ summary, which is very informative:
In Western countries, reports on the costs and benefits of various topics appear regularly. What are the costs and benefits of nuclear power? What are the costs and benefits of an aging population? However, in the Netherlands, there is a political taboo on calculating the costs and benefits of immigration. Some immigrants contribute positively to the society they immigrate to whereas others cost money to their new country, but government reports on this topic are scarce. In 2003, the Netherlands Bureau for Economic Policy Analysis published a report by Hans Roodenburg, Rob Euwals, and Harry ter Rele called Immigration and the Dutch Economy. It showed that immigration is extremely costly for the Dutch treasury.
There are other publications, but they were not initiated and paid for by the Dutch government. In 1999, the influential Dutch econometrist Pieter Lakeman published the book Enter without Knocking: Dutch Immigration Policy and Its Consequences [Binnen zonder kloppen: Nederlandse immigratiepolitiek en de economische gevolgen]. Moreover, the influential Dutch journalist Syp Wynia, an expert on politics and economy, wrote a column in the rightwing weekly Elsevier in 2009 on the costs and benefits of immigration. All three publications reached the same conclusion: Immigration is hugely costly for the Dutch treasury.
Recently, a new study on the costs and benefits of immigration appeared, written by Jan van de Beek, Hans Roodenburg, Joop Hartog, and Gerrit Kreffer, updating the Roodenburg et al. report from 2003. It is generally known that the Dutch are blessed by nature with enormous amounts of subterraneous natural gas. The van de Beek report estimates that immigration costs equal the money earned by the Dutch state from selling natural gas since its start in 1963 until now, namely 400 billion euros. They also estimate that an average native-born Dutch family pays five thousand euros in taxes per year that end up being spent on immigrants. The researchers conclude that immigration is so costly that it will seriously harm the Dutch welfare state in the long run.
The central question of the research report is: What are the fiscal costs and benefits of immigration by migration motive (labor, study, asylum, and family migration) and by region of origin? The researchers use generational accounting to calculate the net contribution — revenues minus expenses — of immigrants to public finances. The data used were gathered by the Dutch Central Bureau of Statistics and include highly detailed anonymized data on all seventeen million Dutch residents; this includes four million first- and second-generation immigrants. Stating the obvious, this is an impressive, high-quality dataset. The Dutch state spends money on both the indigenous population and immigrants for education, social security, and benefits. Per capita, the latter receive much more money on average than the former. Also, because of their lower income, immigrants pay less tax and social security premiums. Moreover, the labor force participation of immigrants is substantially lower. In 1995-2019, the total yearly net costs of immigrants were, on average, 17 billion, which add up to 400 billion euros for the whole period. The authors contrast this yearly expenditure on immigration to the recent government spending of 30 billion euros per year on education. The bigger picture: The total income of the Dutch national government is expected to be €293 billion in 2021, and the total expenditure is expected to be €337 billion.
The microdata from the Dutch government allow various fine-grained analyses, such as comparisons between groups with different migration motives. For example, the authors show that labor migrants have a positive net contribution, but study migration, family migration, and asylum migration lead to substantial negative net contributions. For instance, asylum migration costs on average almost half a million euros per immigrant; an important reason is the low level of labor force participation, partially caused by restrictions on work permits while the migrants are waiting for decision about their status.
The authors also compare regions, and it is clear that migrants from higher- IQ regions generally have on average net positive contributions. Exceptions are immigrants from some Central and Eastern EU member states that cost about €50,000 per immigrant for the time they reside in the Netherlands. In contrast, migrants from lower-IQ regions always have, on average, negative contributions. The authors show dramatic differences in net lifetime contribution by educational level: Immigrants with a master’s degree contribute +€300,000, and immigrants with only primary education cost €400,000. The dataset used is rich and contains an educational achievement test that Dutch children take at the end of primary school. The lowest educational achievement score generally goes with a lifetime net contribution of approximately -€400,000, whereas the highest score goes with a value of +€300,000. A previous meta-analysis by te Nijenhuis et al. (2004) showed large mean IQ differences between immigrants and native Dutch. It also showed that second-generation immigrants have substantially better IQ scores than the first generation, even after controlling for Dutch language proficiency. It is well-known that the Dutch educational achievement tests correlate very strongly with classical IQ tests. Te Nijenhuis et al. also show large differences between Dutch and immigrants in school achievement and work performance. So, the findings from the van de Beek report are very much in line with these previous meta-analytical findings.
Predictions of future immigration costs form a more speculative part of the report. The authors produce various scenarios, and their scientifically preferred scenario comes with a cost of approximately €600 billion between 2020 and 2040. So, over time, immigration costs will become a bigger and bigger part of the government budget, so pressures will mount to downsize the Dutch welfare state substantially. The research report comes with a hefty 90-page Technical Appendix detailing the research methods used.
Immigration has become a highly politicized topic, and therefore the authors of this report should be applauded for their attempts to bring hard facts into the discussion. It would be good to publish parts or even the whole report in a peer- reviewed journal, so that other immigration experts can comment on it. Will independent researchers reach similar conclusions? A hurdle to take for new researchers is to receive permission to work with the excellent database of the Dutch Central Bureau of Statistics.
At the time of this writing, the report is only available in Dutch, and only a summary in English is presented. However, there are plans to translate the report into English, so it can be read by the wider research community.
The fundraiser to translate the report is here. It is about 40% of the way.
Finally, now, though, people must have learned something. Especially in Germany (wir schaffen es leider nicht). But alas, The Guardian can confidently report to us that Angela Merkel’s fatal decision has been proven right! No one has learned anything, and not thanks to the economics either. I do wonder, however, what an actual anonymous survey would show. Corona times has showed us time and time again that not only does government expert consensus and opinion often change completely, but also that prominent scientists frequently lie to the public. We know from intelligence research that what researchers say in public and believe in private are quite the opposite. Well, aside from those who say it in public and feel the wrath.