Researchers often talk about getting into the better journals. There is an assumption that better journals are those with high impact factors, and these publish better science. Of course, if you directly search about this question, you will find a lot of people saying there is no or a weak relationship between journal quality and journal impact factor. Still, as a matter of fact, impact factor is the only quantitative metric offered for journal quality, so we have to use it. In fact, some of this is just cope because if we just ask researchers to rate journals for quality, and relate their ratings to impact factors, the two metrics are nearly identical:
- Saha, S., Saint, S., & Christakis, D. A. (2003). Impact factor: a valid measure of journal quality?. Journal of the Medical Library Association, 91(1), 42.
Objectives: Impact factor, an index based on the frequency with which a journal’s articles are cited in scientific publications, is a putative marker of journal quality. However, empiric studies on impact factor’s validity as an indicator of quality are lacking. The authors assessed the validity of impact factor as a measure of quality for general medical journals by testing its association with journal quality as rated by clinical practitioners and researchers.
Methods: We surveyed physicians specializing in internal medicine in the United States, randomly sampled from the American Medical Association’s Physician Masterfile (practitioner group, n = 113) and from a list of graduates from a national postdoctoral training program in clinical and health services research (research group, n = 151). Respondents rated the quality of nine general medical journals, and we assessed the correlation between these ratings and the journals’ impact factors.
Results: The correlation between impact factor and physicians’ ratings of journal quality was strong (r2 = 0.82, P = 0.001). The correlation was higher for the research group (r2 = 0.83, P = 0.001) than for the practitioner group (r2 = 0.62, P = 0.01).
Conclusions: Impact factor may be a reasonable indicator of quality for general medical journals.
Recall an r² of .82 is a correlation of .91. Since these variables are not exactly 100% reliable, this value would probably be 1.0 if adjusted for this random error. So, clearly, rated journal quality is basically the same as journal impact factor.
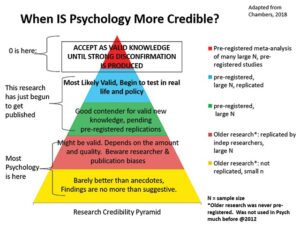
We thus have to ask: are journals with higher impact factors actually producing better science? A few years ago, neurobiologist Björn Brembs reviewed this evidence:
- Brembs, B. (2018). Prestigious science journals struggle to reach even average reliability. Frontiers in human neuroscience, 12, 37.
In which journal a scientist publishes is considered one of the most crucial factors determining their career. The underlying common assumption is that only the best scientists manage to publish in a highly selective tier of the most prestigious journals. However, data from several lines of evidence suggest that the methodological quality of scientific experiments does not increase with increasing rank of the journal. On the contrary, an accumulating body of evidence suggests the inverse: methodological quality and, consequently, reliability of published research works in several fields may be decreasing with increasing journal rank. The data supporting these conclusions circumvent confounding factors such as increased readership and scrutiny for these journals, focusing instead on quantifiable indicators of methodological soundness in the published literature, relying on, in part, semi-automated data extraction from often thousands of publications at a time. With the accumulating evidence over the last decade grew the realization that the very existence of scholarly journals, due to their inherent hierarchy, constitutes one of the major threats to publicly funded science: hiring, promoting and funding scientists who publish unreliable science eventually erodes public trust in science.
This builds on his prior blogpost on the same topic.
To pick a random piece of evidence:

Figure 2. Relationship between impact factor (IF) and extent to which an individual study overestimates the likely true effect. Data represent 81 candidate gene studies of various candidate genes with psychiatric traits. The bias score (y-axis) represents the effect size of the individual study divided by the pooled effect size estimated indicated by meta-analysis, on a log-scale. Therefore, a value greater than zero indicates that the study provided an overestimate of the likely true effect size. This is plotted against the IF of the journal the study was published in (x-axis). The size of the circles is proportional to the sample size of the individual study. Bias score is significantly positively correlated with IF, sample size significantly negatively. Figure from Munafò et al. (2009).
Ulrich Schimmack’s replicability index
Some time ago, Ulrich Schimmack started calculating estimates of replicability by journal, and even by researcher. He has posted the values for 2010-2021 for some 125 journal, so let’s have a look at how these relate to impact factor. He provided the data in different posts, but I have merged them to one dataset (which you can totally look at and reuse for any purpose). The metric is computed by scraping journal articles, extracting statistical tests from them (with a tool) converting these to z-scores, and estimating how much signal there is in the noise. This approach is not perfect, but maybe it is good enough.
The first thing we want to look at, then, is whether these rankings are consistent across years. If not, there is no point in using them. Fortunately, they seem alright:
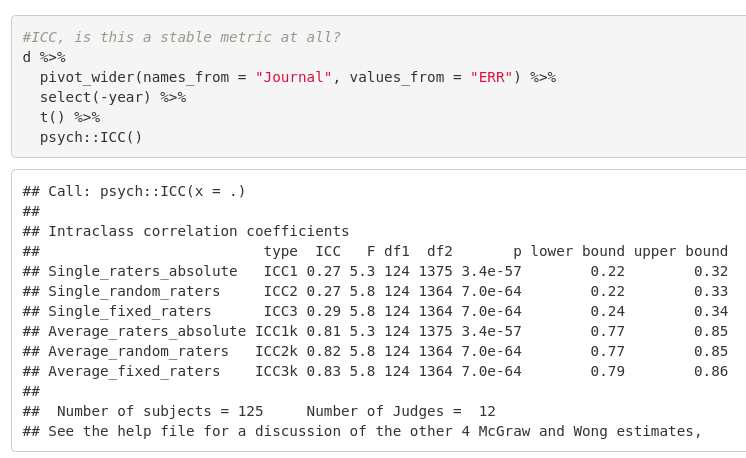
These are the intraclass correlations (ICC) from the psych package. Wikipedia has more on these, but basically, these are reliability metrics. A value of ~82% means that using on average 12 years of data produces a value for a journal that has 82% true variance and 18% random error. This is still worse than a full battery IQ test for intelligence, which typically have a reliability of more than .90 but it is good enough.
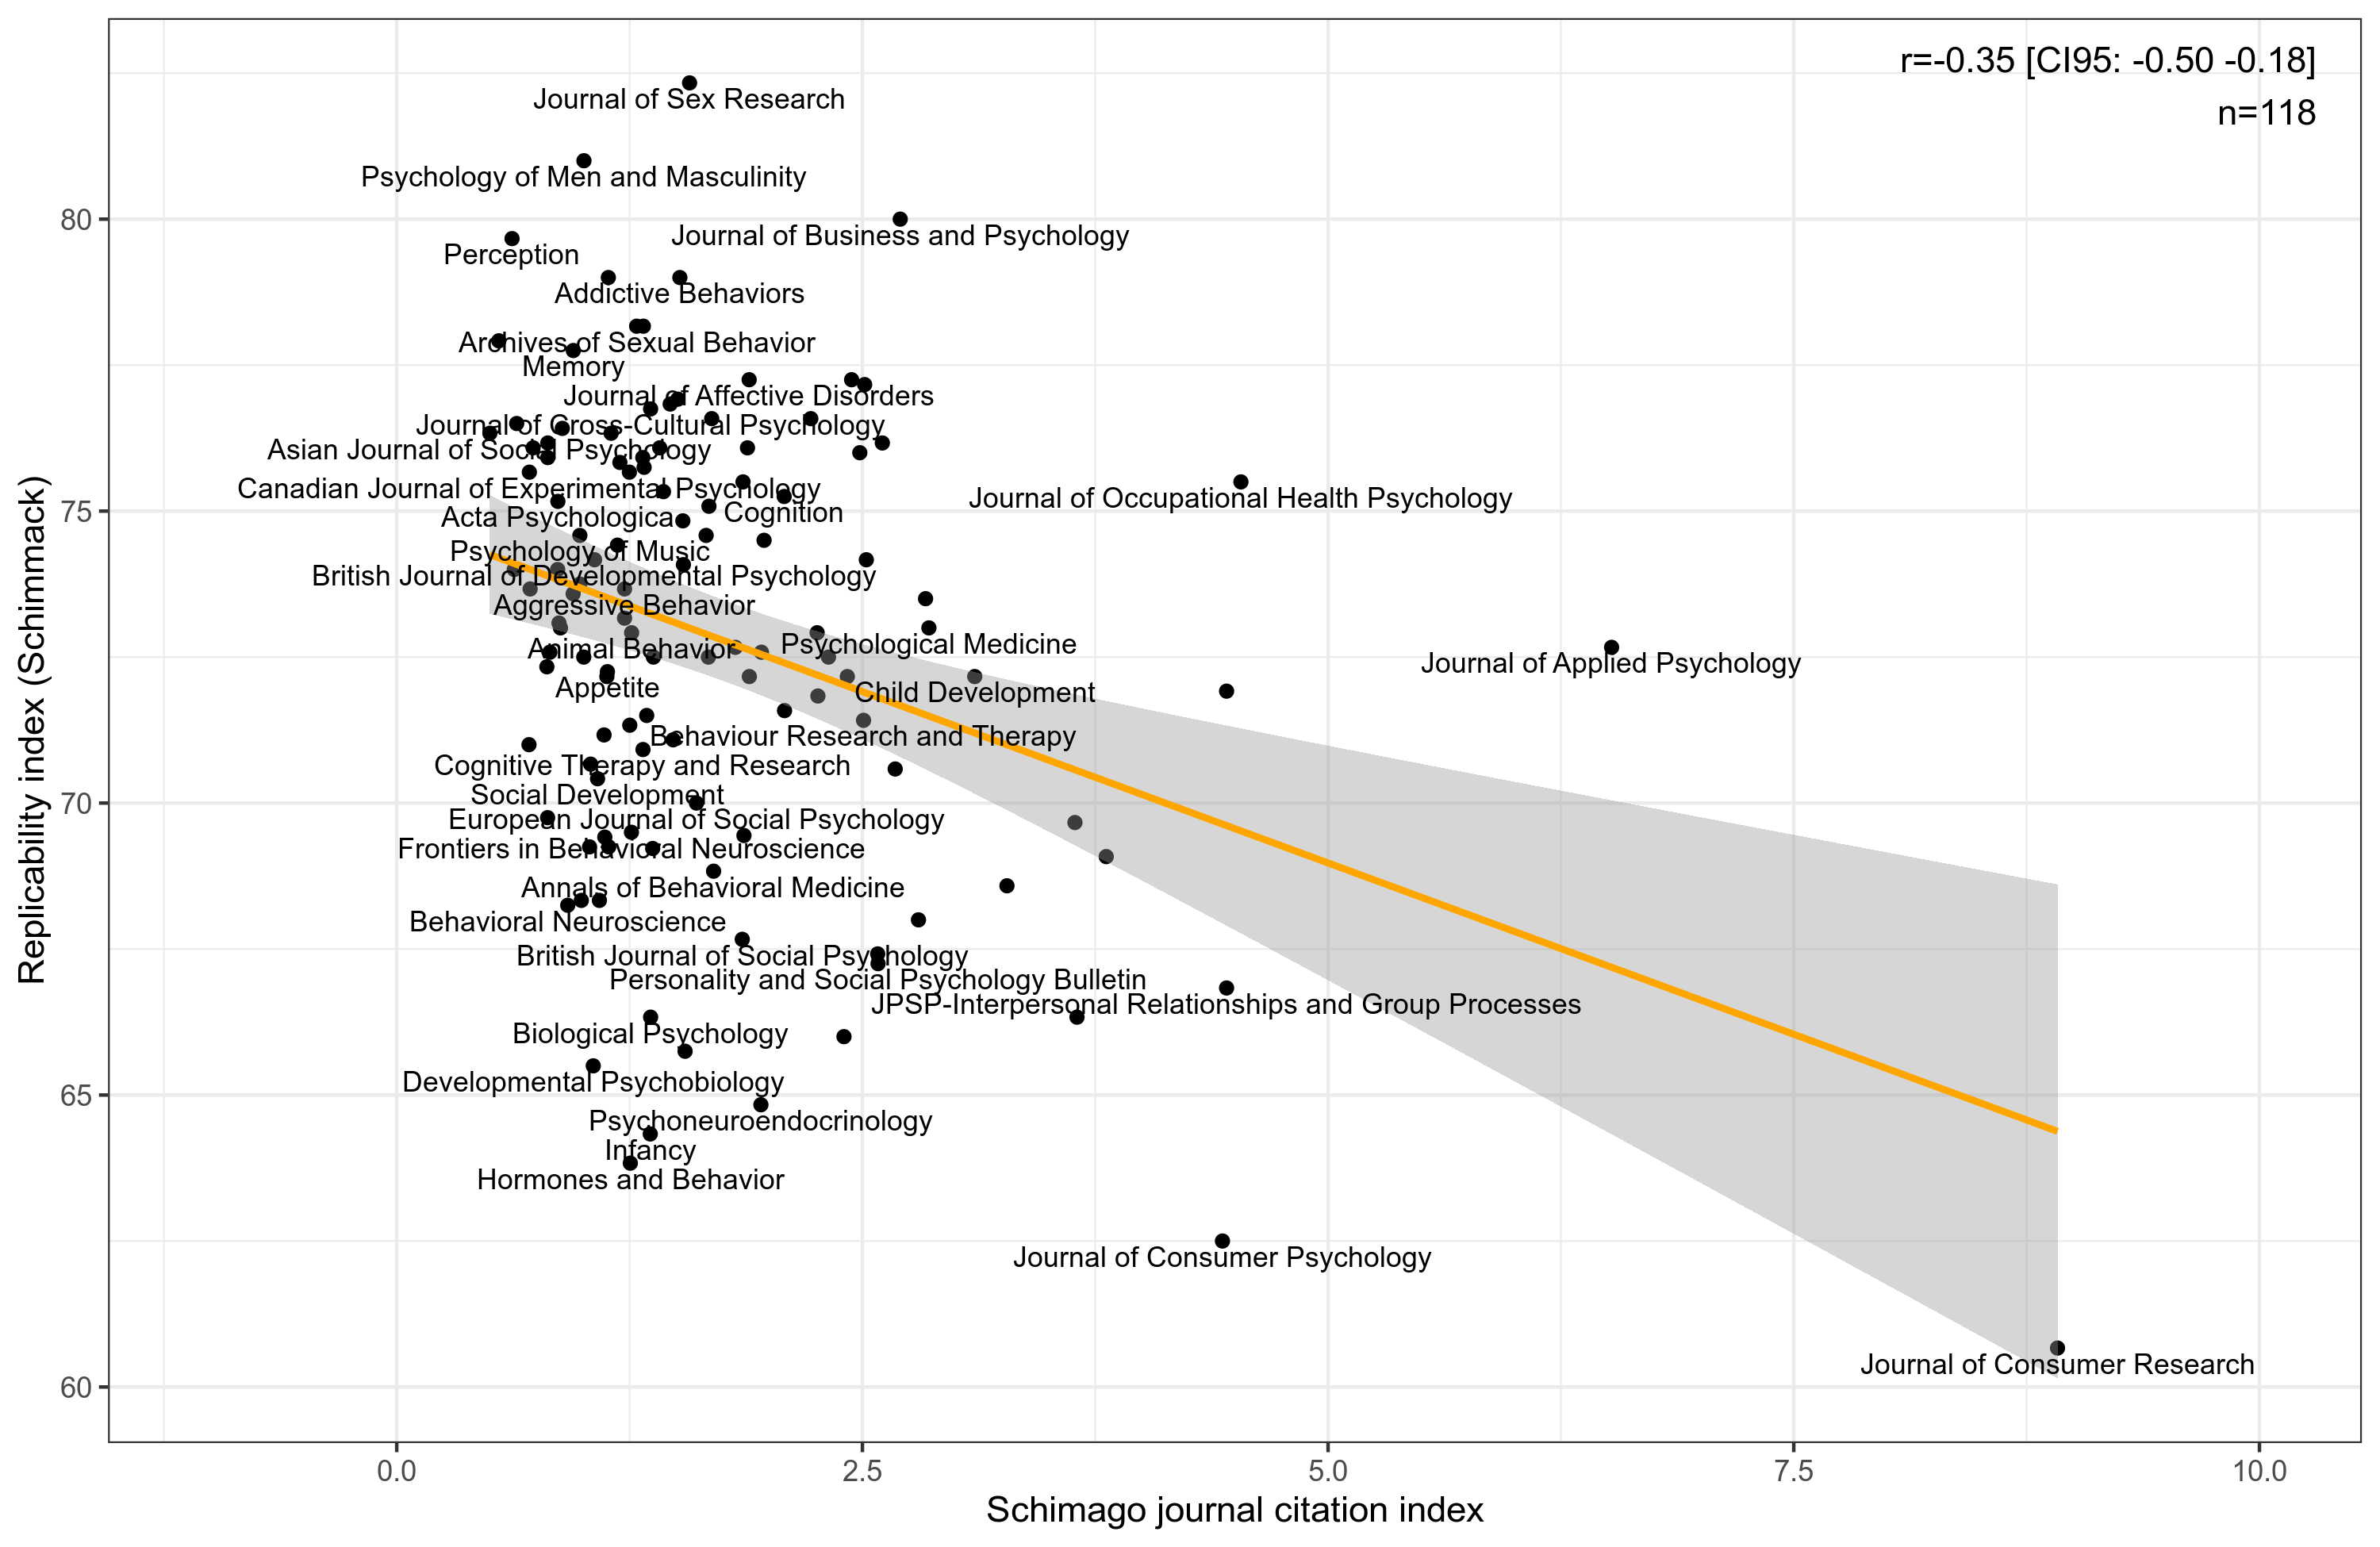
Satisfied that these metrics have some kind of signal of scientific rigor (less p-hacking), we can relate them to the journal impact factor. Except that there isn’t just one such journal impact factor score. So I decided to scrape 2 variants of these from Scimago. I used two metrics. First, their own metric SJR:
The SJR is a size-independent prestige indicator that ranks journals by their ‘average prestige per article’. It is based on the idea that ‘all citations are not created equal’. SJR is a measure of scientific influence of journals that accounts for both the number of citations received by a journal and the importance or prestige of the journals where such citations come from It measures the scientific influence of the average article in a journal, it expresses how central to the global scientific discussion an average article of the journal is.
And the more neutral citations per document (CPD). The results:
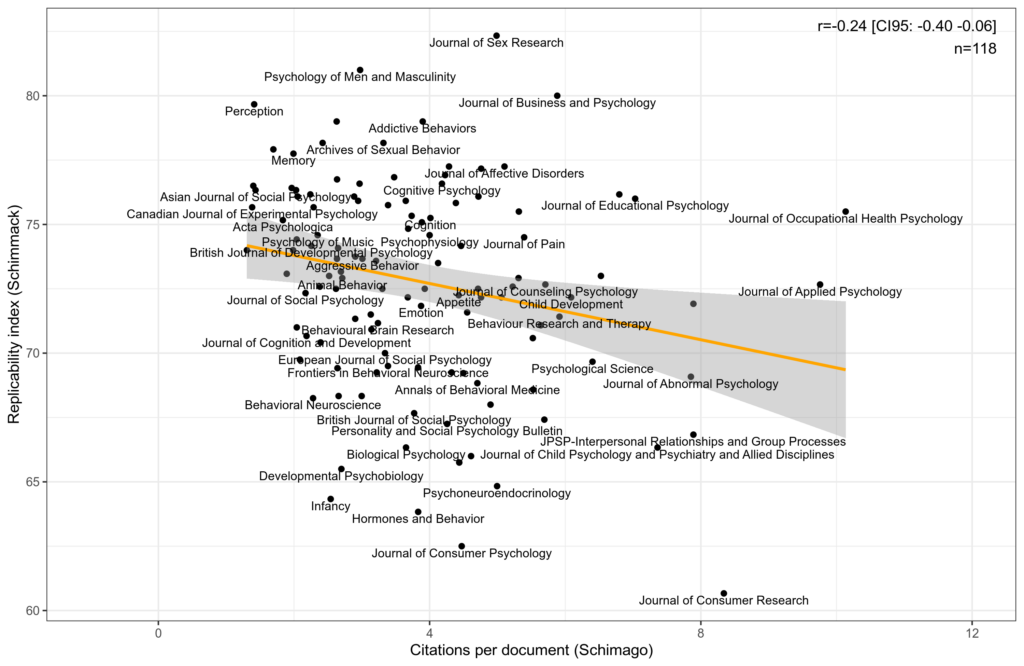
And

Oh dear, the relationship is even negative! This is in line with Brembs’ finding above. The pattern seems to be mainly due to the apparently very low quality Journal of Consumer Research. I’ve never heard of it, but it is apparently highly popular. Still, even if we remove this outlier, the correlations are still negative:

Here we have the ordinary correlations (Pearson), the same without that outlier, and the rank order correlations. The last ones transform all values to their ranks, and do correlations on them, which greatly reduces the effect of outliers. But all the 6 correlations are negative and all have p < .05, even if not always convincingly so.
So it appears that the critics were right again: journal impact factor does not only not predict actual scientific quality, but it is actually a slightly negative signal! This general finding is astonishing from an outsider’s perspective. These are the metrics that are widely used for hiring purposes, and actually science shows they work either not at all, or slightly opposite of intended. So the next time someone sends you a study that is supposedly high quality because it is from a ‘good journal’ (codeword for high impact factor journal), then you can reply with some of these data. On the other hand, this 2020 study of some 30,000 abstracts finds the opposite that I find. Weird? I hypothesize that higher impact journals avoid signaling their weak studies by not putting the bad p-values in the abstracts. Their ICC was only .55 because they only used data from 5 years instead of 12 (here’s their data).
From a personal perspective, this kind of thing is funny because it undermines the arguments against Mankind Quarterly and OpenPsych. If what is called high quality normally turns out to be no better than average, or maybe worse, then what is the quality of journals called very, very bad? No one has done an objective audit of MQ/OP, but that would be quite interesting to see.