This one was overshadowed by the more important paper on economic growth that I wrote about in the prior post.
-
Kirkegaard, E. O. W. (2022). The Intelligence Gap between Black and White Survey Workers on the Prolific Platform. Mankind Quarterly, 63(1), Article 3. https://doi.org/10.46469/mq.2022.63.1.3
This brief report analyzes data from a series of studies carried out by Bates and Gignac (2022), collected from paid survey takers on the Prolific platform (total n = 3357). In this UK sample, Black-White gap sizes on cognitive tests were substantial with an overall effect size d of 0.99 standard deviations adjusted for unreliability (unadjusted means = 0.84 d). Testing for measurement invariance via differential item functioning found either no bias or bias of trivial magnitude. We conclude that the Black-White intelligence gap seen in Prolific workers is of similar magnitude to the gap seen elsewhere in America.
One of the nice advantages of open science is that the datasets are open for reanalysis. You don’t have to email people to maybe, maybe not, get a copy of their datasets, and neither do they have to approve of your study, or demand honorary co-authorships. You can simply reanalyze the data for any reason. This is one of those studies where I found some nice data and did a small study of it.
African underperformance is the perennial topic everywhere in the west, the world really. Of course, hereditarians know that this has to do mainly with their lower average intelligence. So the debate is really about this intelligence gap (‘skills gap’ as it is sometimes euphemistically referred to as). Also in the last decade or so is the growth of online survey pollsters for use by scientists. It began with Amazon’s MTurk, and now’s there various specialized companies like Prolific, where one can easily buy survey data from for research purposes. This of course raises the question of how valid the data are: are the subjects representative? Do they provide bad data? One issue with doing surveys is always that one has to make sure that the subjects understand what you want from them. So the language used must be as simple as possible and clear to avoid misunderstandings. These frequently occur anyway, so survey data always has some element of error. Above this, there are the malicious survey subjects who fill out things at random, or dishonestly. As honesty and reading comprehension are both related to intelligence, this implies that survey data quality should also differ by race, socioeconomic status and so on. This issue is actually somewhat pernicious because this data quality difference can show up as fake interactions or heteroscedasticity in models. For this reason, and because of the ever green debate on whether the racial intelligence gaps are finally, finally shrinking, I looked at the intelligence gaps in 3 British datasets from the Prolific platform.
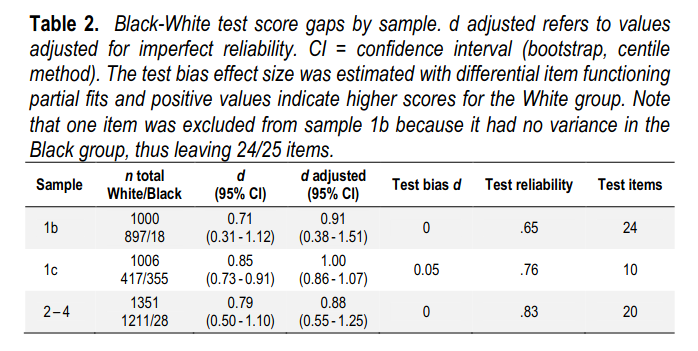
The intelligence tests they used were very brief, 10-24 items. When you buy survey data, you pay for the time used, so researchers strive to use ultra-short tests. But since we can compute the reliability of this g estimate, we can compute what the gap would be without measurement error (method: convert the cohen’s d to a point biserial correlation, apply Spearman’s correction, then convert back to d). I also looked for test bias. There actually were some items that looked like they had bias in this sample! Generally speaking, a few items in every test show up as being biased by race, but the directions of bias are random, so in a longer test this bias cancels out and the overall effect on the test is near zero. In this case, the short test had two biased items according to DIF testing, and when you fit a partial model, this test bias comes out to .05 d, which is still pretty small compared to the observed gap size of 0.85, or 1.00 after adjustment for measurement error. Visually, item biases look like this:
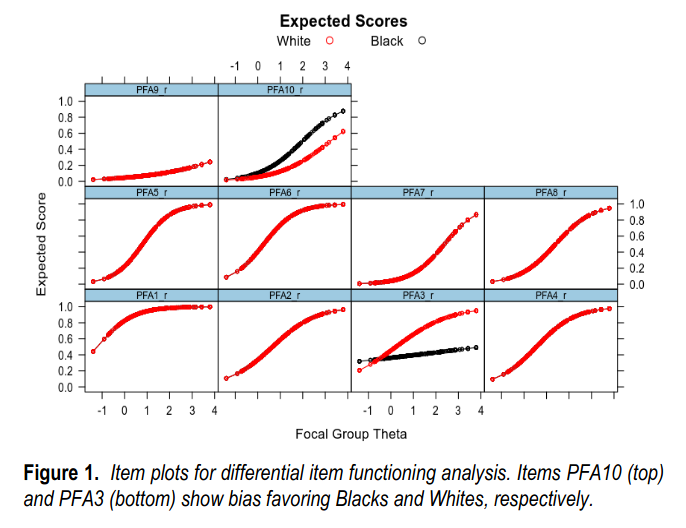
The two items with diverging lines are the biased ones. In item response theory, each item’s probability to be passed by a subject is modeled as a function of the item’s difficulty and g-loading (discrimination), as well as each subject’s latent ability. PFA10 is easier for Blacks. The line shows that for each level of ability above a very low level, the item has a higher probability of being passed by Black subjects compared to the White ones. Item PSA3 has the opposite pattern, but it is a bit stronger (greater distance between the lines). Overall, the net effect of these 2 biased items is to make the test very slightly biased in favor of White subjects. The other 2 tests did not show any bias. In fact, this bias here is maybe a fluke. I am not entirely sure how reliable these kind of IRT findings are, but I guess one could bootstrap it to see. Note that this is a nonverbal test (“Visual Paper Folding test”), so it is difficult to explain these biased items as being related to language bias, and in any case, that wouldn’t result in inconsistent directions of effect.
Overall though, the standard intelligence gap between Blacks and Whites appear to be present in these 3 datasets from the United Kingdom. This contrasts with the many findings that these gaps are now very small in younger cohorts, especially in school test data (Chanda Chisala). It is somewhat of a mystery why the results are so inconsistent. Another paper on the topic is this one by Lynn and Fuerst:
- Lynn, R., & Fuerst, J. G. (2021). Recent Studies of Ethnic Differences in the Cognitive Ability of Adolescents in the United Kingdom. Mankind Quarterly, 61(4).
Research from the 20th century showed that ethnic minorities under-performed White British on measures of cognitive ability in the United Kingdom. However, academic qualification results from the first two decades of the 21st century suggest minimal to reverse ethnic differences. To better understand the pattern of contemporary cognitive differences among adolescents in the 21st century, we analyzed academic achievements at age 16 in the GCSE and cognitive ability in four cognitive tests: the National Reference Test, NRT; the Programme for International Student Assessment, PISA; Cognitive Ability Test 3 (CAT3); and Center for Evaluation and Monitoring (CEM) 11-plus. Results from the PISA, CAT3 and CEM 11-plus tests correlate strongly across ethnic groups. These results show that Bangladeshi, Pakistani and Black students score approximately one half of a standard deviation below Indian and White students, while Chinese students perform significantly above the latter groups. In contrast, but consistent with academic qualifications, results based on the NRT suggest smaller ethnic gaps.
Their results:
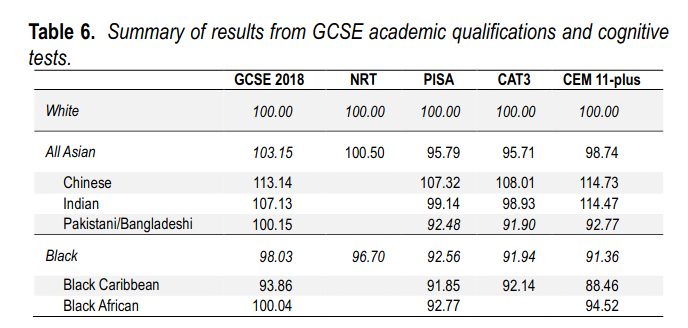
Note the difference between Black African vs. Black Caribbean. I think the Caribbeans are the older immigrant wave of Africans, and the African ones are the more recent Nigerian etc. elites. The best I can think of to explain the contrast is that it’s a cohort difference. The younger African cohort is more elite, a lot of these are children who grew up in the British environment which is far superior to the African one wrt. intelligence. The adults I would guess are more likely to be African migrants. But this is just guessing! It is possible to check the self-selection explanations using polygenic scores, so that is something that someone should do when they get their hands on a British genetics dataset with many Africans.