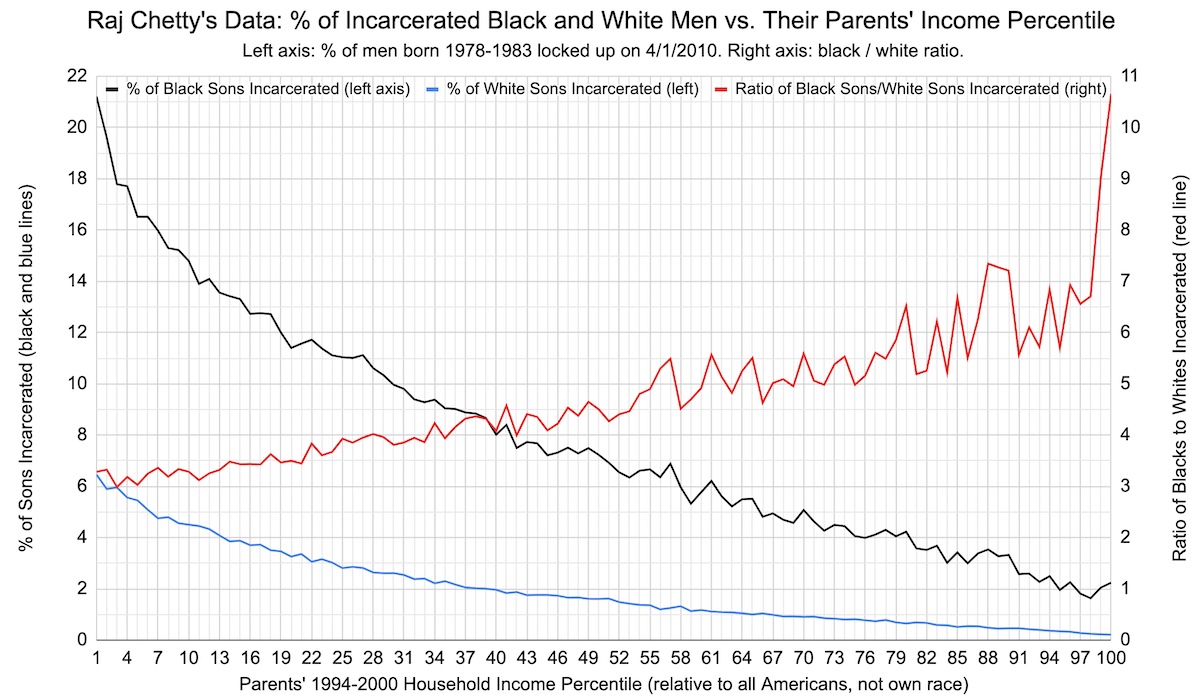
Steve Sailer tells the story of this figure: Why Is the Ratio of Black Incarceration to White Incarceration Worse in Higher Social Classes?
He muses:
Why does the black-to-white ratio get steadily worse with higher income?
I don’t know. Before seeing Chetty’s data, I might have guessed it shrank.
Is the cause racism?
I think the cause of this increasing ratio is regression towards the mean. That’s what I proposed on Twitter at least:
Blacks from 98th centile income homes are far above their racial mean, so they regress a lot. White kids less so. The relative effect size of the regression becomes larger the stronger the selection, so will the difference between the children. Thus, the ratio goes up.
But one thing is statistical intuition and the other thing is doing the math. So let’s do the math. I will assume these assumptions:
- Black and Whites differ by 1 SD on a broad human capital phenotype. Whites have a mean of 0, Blacks of -1.
- This runs in families with a parent-child correlation of .50
- There is a threshold below which a person has a chance of being a criminal. I set this arbitrarily at -1. I say chance because it has a random noise component which I have arbitrarily set to SD 0.50.
Given these assumptions, we can look at the regression towards the mean plot:
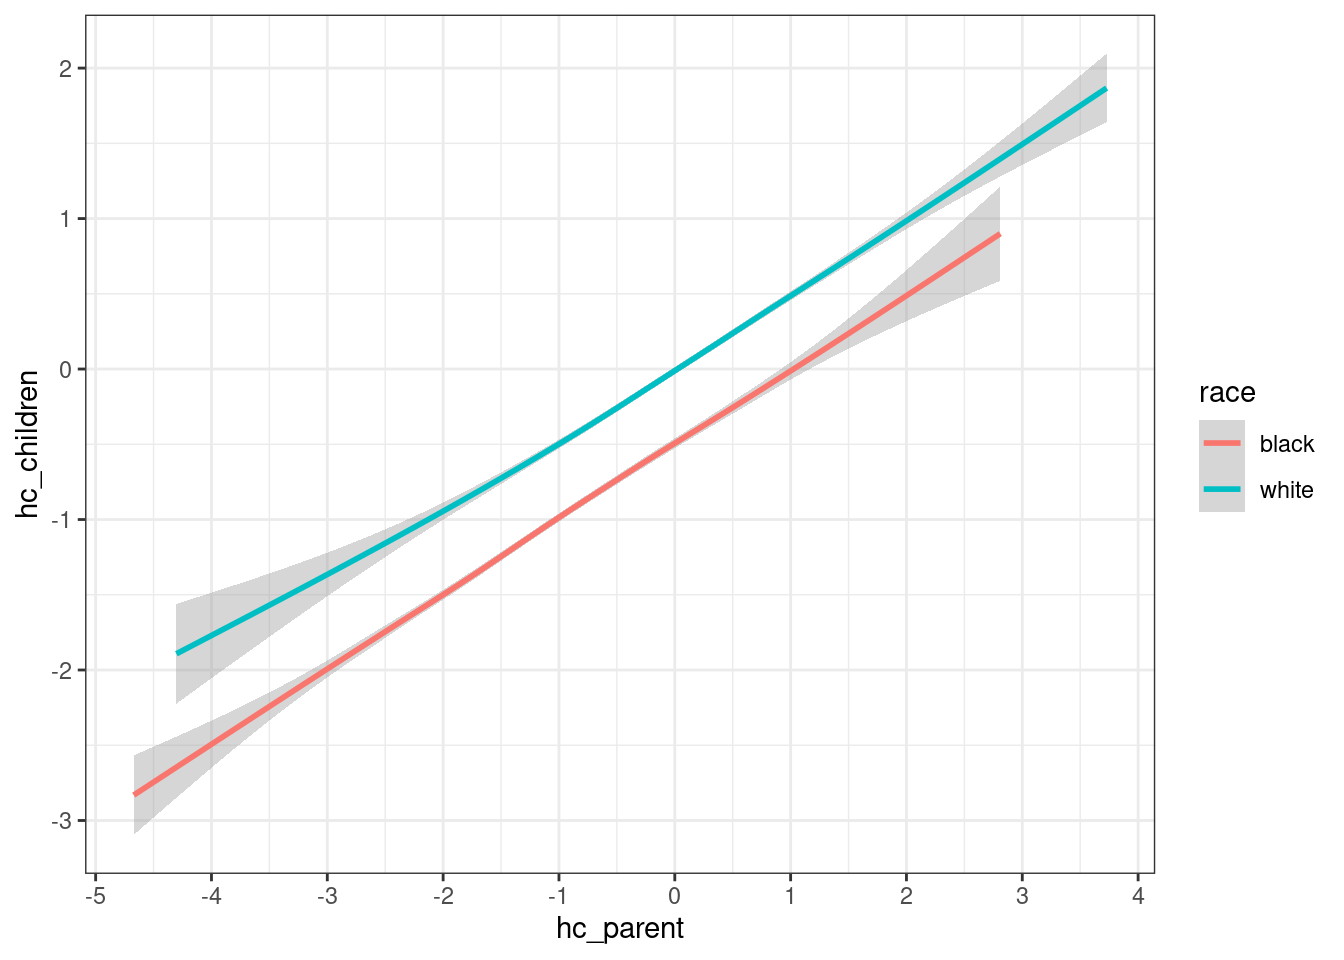
So we can visually verify the results by looking up some point. E.g., look at the White parent human capital of 0 on X, which shouldn’t regress anywhere in the children, and indeed the Y is also 0. Or look up White X = 1, which should have children with Y = 0.5, which is what we see. Similarly, look up Black parents X = 1, and their children should regress halfway to -1, so to 0, and that’s what we see too.
Equivalently, we can look at the distance to the children as a function of parental human capital:
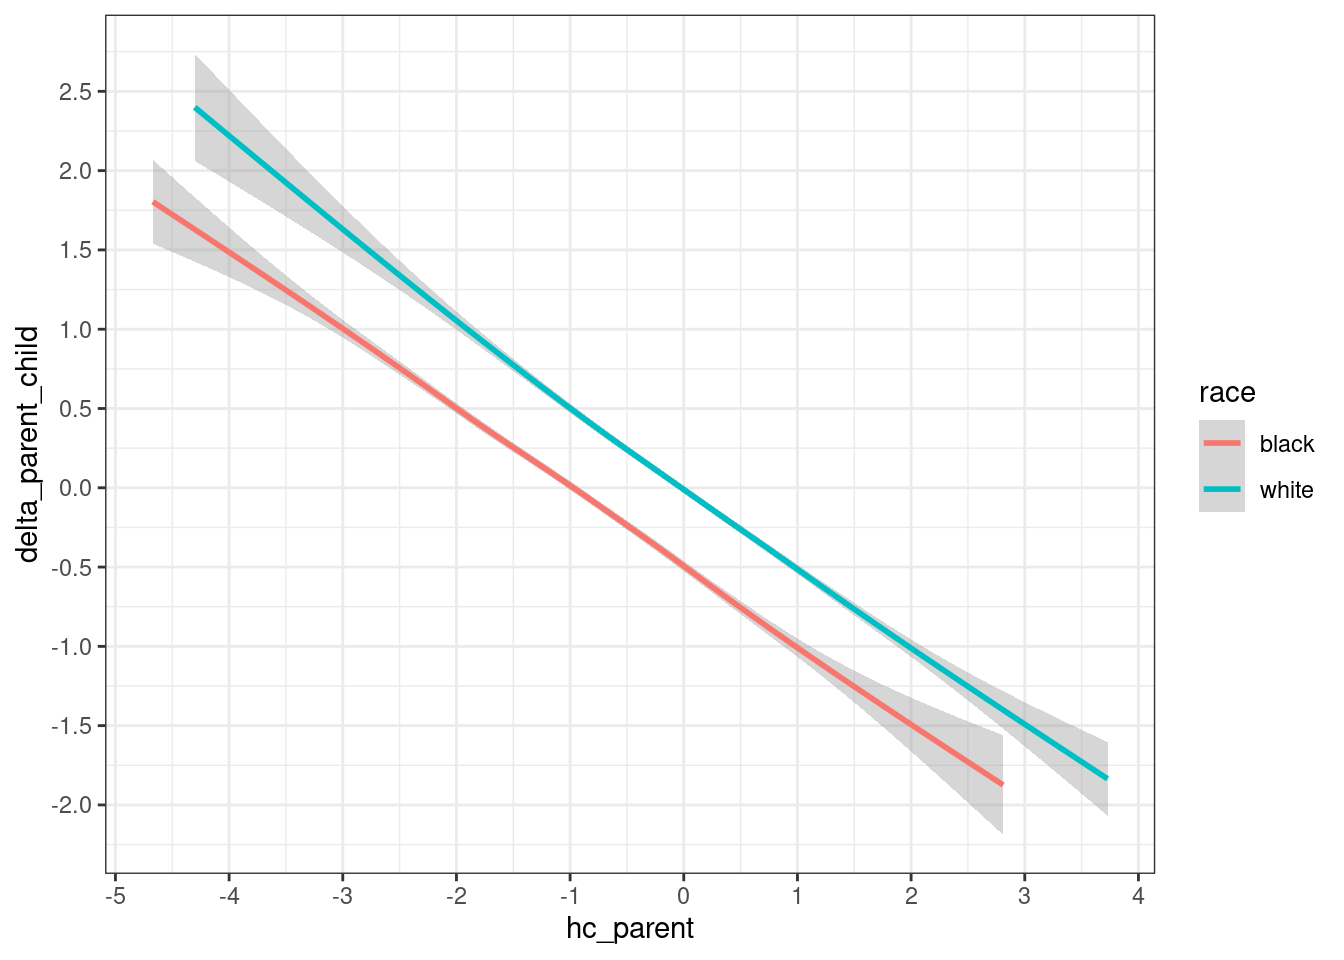
This shows the same thing as before, but in another form. So if we look up Black X = 2, that’s 3 d above their mean, so the value should be always back down, so -1.5 and that’s what we see. Looking up 2 for Whites though shows it is only -1, as that’s halfway to their mean.
Then, we randomly assign some people to the below threshold group with a chance element. With these data binary data, we can fit a logistic regression model:
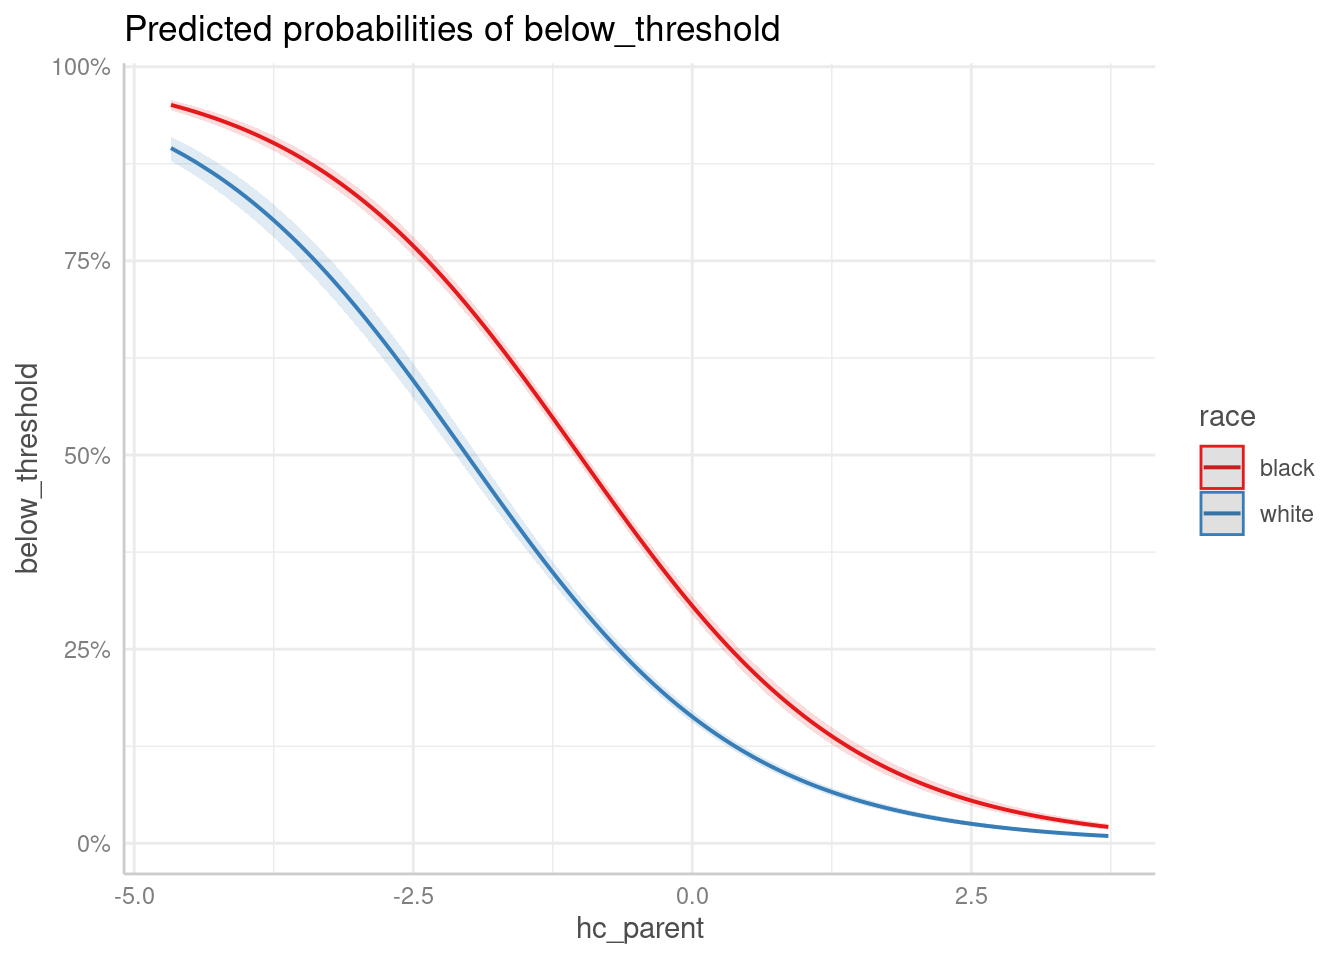
So this is what the probability of being in the undesirable category is as a function of parental human capital and race. Finally, we can look at the ratios of these two lines:
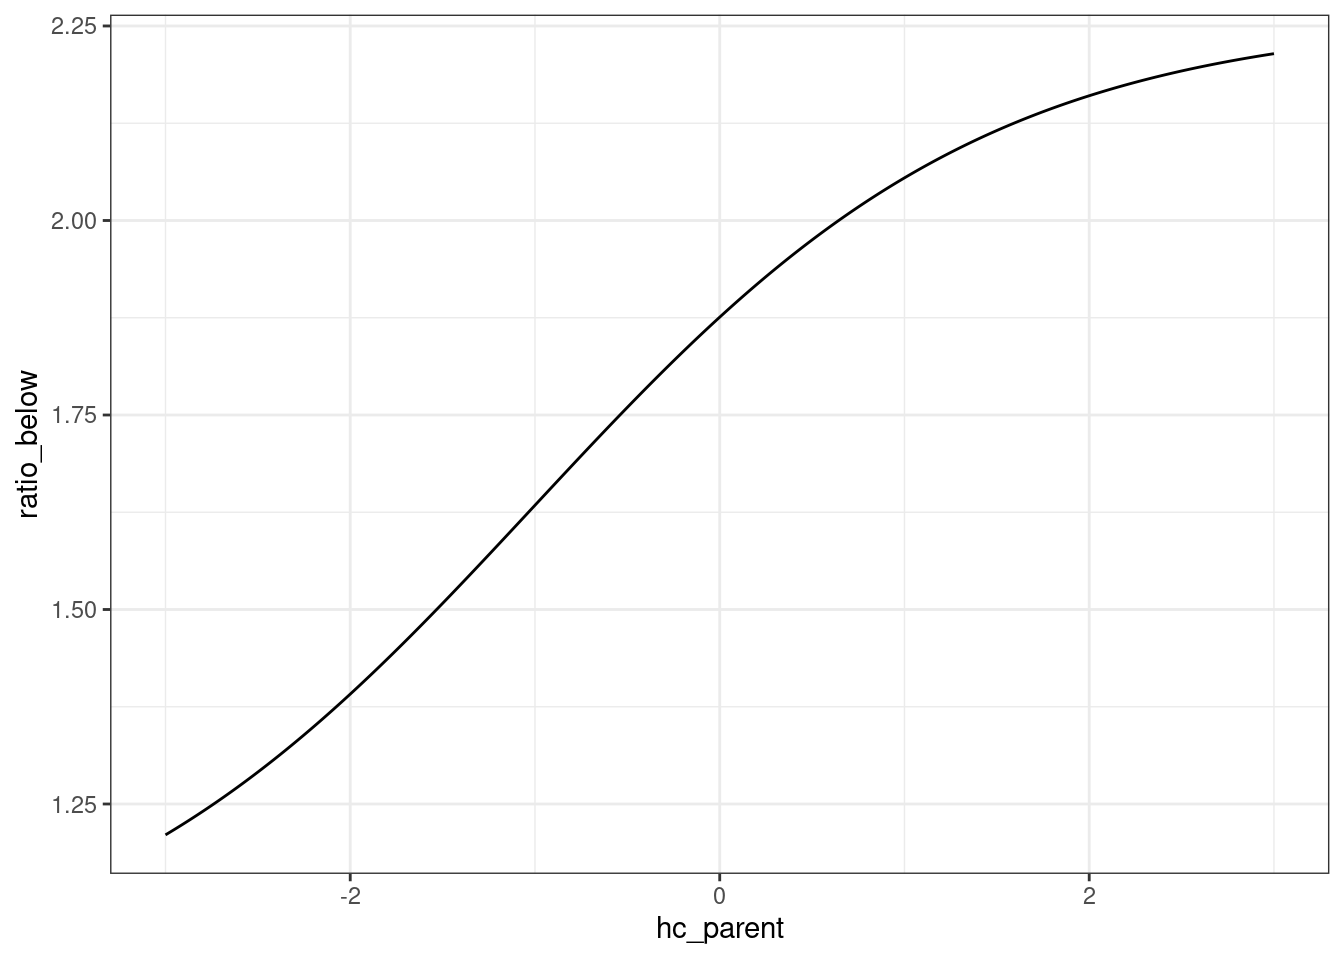
So indeed, as a function of parental human capital, the ratio grows with a logistic function. But the values don’t fit the Chetty plot! They are only 1.X and 2.X at the extremes. Why? First, note that the numbers do roughly fit if you use a scaling factor of 3. In Chetty’s plot, the ratio for 1st centile parental income is about 3, and for the 99th centile, it is about 6, the outlier flukes notwithstanding. I think the reason for the need for the scaling factor is that in my simulation, I used only one phenotype. In reality, criminality and income ability are not perfectly genetically correlated, so the control will be only partial. I think this would produce larger ratios across the board. So, we don’t need to be too mystified by the growing ratio. Regression towards the mean provides the main explanation.
For those more curious about race and regression towards the mean, see Dailliard’s masterful review of regression towards the mean, and our 2019 study investigating and replicating Arthur Jensen’s old findings. You can also play around with this simulator I made.