There has been frequent criticism of Phil Rushton’s role as synthesizer of research on race differences. Ed Dutton’s deep dive into Rushton’s own claims about his life revealed some inconsistencies between historical records and his claims, which some might call lies. Some of Rushton’s claims regarding differences have been otherwise suspect. Phil Rushton did the reviews on brain size, intelligence, and group differences (race, sex) back in 2009:
- Rushton, J. P., & Ankney, C. D. (2009). Whole brain size and general mental ability: a review. International Journal of Neuroscience, 119(5), 692-732.
We review the literature on the relation between whole brain size and general mental ability (GMA) both within and between species. Among humans, in 28 samples using brain imaging techniques, the mean brain size/GMA correlation is 0.40 (N = 1,389; p < 10−10); in 59 samples using external head size measures it is 0.20 (N = 63,405; p < 10−10). In 6 samples using the method of correlated vectors to distill g, the general factor of mental ability, the mean r is 0.63. We also describe the brain size/GMA correlations with age, socioeconomic position, sex, and ancestral population groups, which also provide information about brain–behavior relationships. Finally, we examine brain size and mental ability from an evolutionary and behavior genetic perspective.
A lot of this work summarized very crude measures of brain size, such as cranial volume from skulls, or head circumference (literally calipers) as proxies. The MRI-based data that Rushton cites also produced overly strong correlations. The current best guess for the correlation between whole brain size and intelligence (g) in adults is about r = .30 (see my 2022 summary). Of this, some of it is causal, and some of it is probably not (James Lee et al 2019 used siblings to estimate that 71% is causal), so where does that large the brain size differences between races as an explanation for race differences in intelligence? We sought to find out using a thoroughly modern approach in our new study:
-
Kirkegaard, E. O. W., & Fuerst, J. G. R. (2023). A Multimodal MRI-based Predictor of Intelligence and Its Relation to Race/Ethnicity. Mankind Quarterly, 63(3), Article 2. https://doi.org/10.46469/mq.2023.63.3.2
We used data from the Adolescent Brain Cognitive Development Study to create a multimodal MRI-based predictor of intelligence. We applied the elastic net algorithm to over 50,000 neurological variables. We find that race can confound models when a multiracial training sample is used, because models learn to predict race and use race to predict intelligence. When the model is trained on non-Hispanic Whites only, the MRI-based predictor has an out-of-sample model accuracy of r = .51, which is 3 to 4 times greater than the validity of whole brain volume in this dataset. This validity generalized across the major socially-defined racial/ethnic groupings (White, Black, and Hispanic). There are race gaps on the predicted scores, even though the model is trained on White subjects only. This predictor explains about 37% of the relation between both the Black and Hispanic classification and intelligence. Keywords: Machine learning, Elastic net, Race, Intelligence, MRI
So we used a fairly representative sample of American children aged about 10. The kids underwent extensive cognitive testing providing a pretty good measure of intelligence (g). The kids also underwent extensive MRI testing resulting in a very large set of variables relating to all manners of brain differences. The typical academic way to handle this situation is to read some previous literature, come up with some semi-plausible theory of what is important (e.g. P-FIT), find a way to operationalize it, and then see how well this predicts intelligence. We did the exact opposite. We used the full set of 50,000+ variables, many of which were highly redundant because they measured the same brain region’s volume in left vs. right side (correlations often > .999 due to symmetry), and fed these into machine learning algorithms in order to predict intelligence atheoretically.
For reference, here are the group gaps in the ABCD sample:
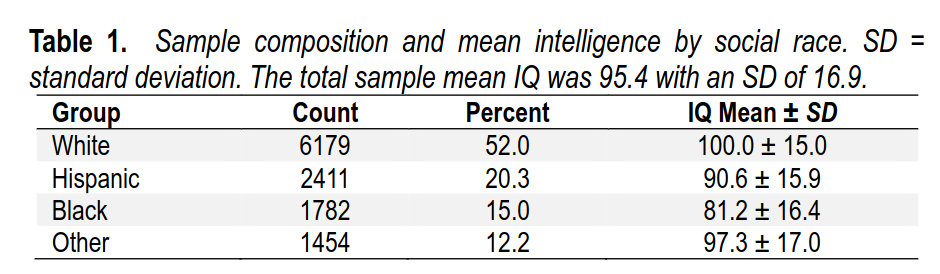
Blacks are lower here than ordinary because of oversampling of lower class Blacks, which is often done in large studies (NLSY as well). 81 IQ should probably not be seen as the current best estimate (19 IQ gap), but it is probably not far from it either.
So how well can we predict intelligence this way? We got a surprisingly high accuracy of about r = .60 (cross-validated).
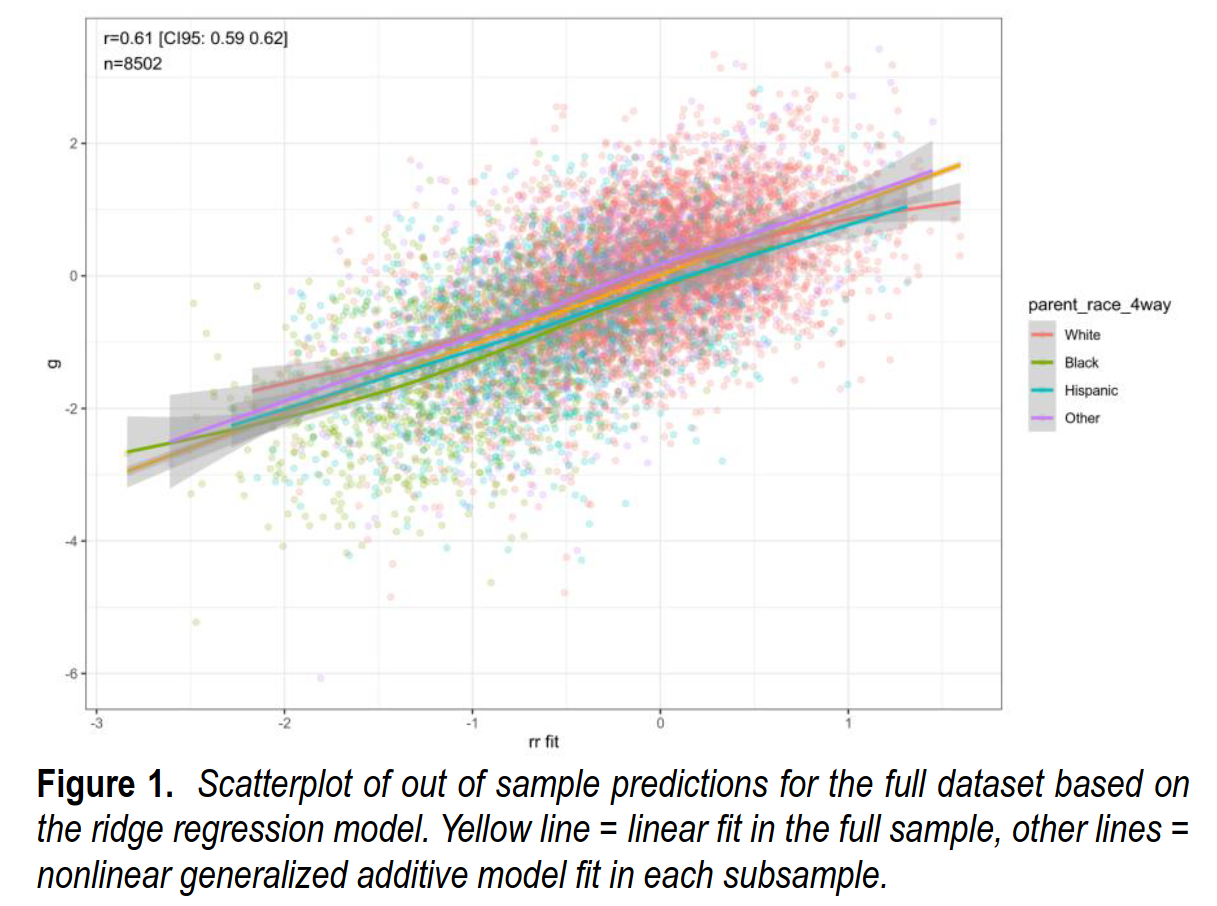
Are these predictions equally valid across races? Here’s the regression:
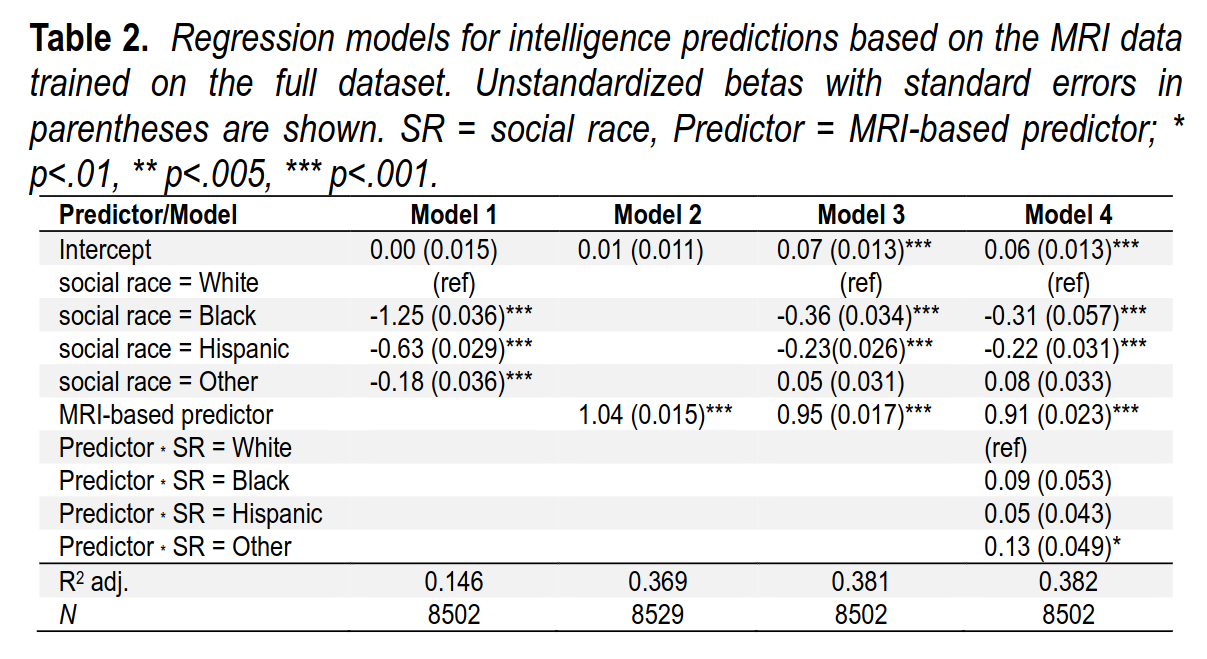
In model 1 (first column), the race gaps are shown in standardized form (1.25 d = 19 IQ). The slope for the MRI predictions is not standardized but on its natural scale, showing that the slope is close to 1 (perfect calibration). When social races (parent identification) is entered along with the MRI predictions, they lose most of their validity, showing that the brain differences mediates this gap, as expected. Model 4 tests whether this MRI model works the same across the social races, which we mostly find that it does, in fact, it works slightly better in the non-Whites. The reason for this is that these groups are ancestrally mixed, and therein lies the problem. Here’s the model accuracies inside each social race:
We next computed the correlations within each social race. These were: rs = .51, .53, .54, and .58, for the White, Black, Hispanic and Other subsamples, respectively. These values are all smaller than the r = .61 value for the entire sample. The weaker correlations might have two causes.
First, it may be due to confounding whereby the model learns to predict either social race or genetic ancestry in order to predict intelligence through non-neurological pathways. In this case, the validity would be lower within social races because they are more homogeneous in the non-neurological variables.
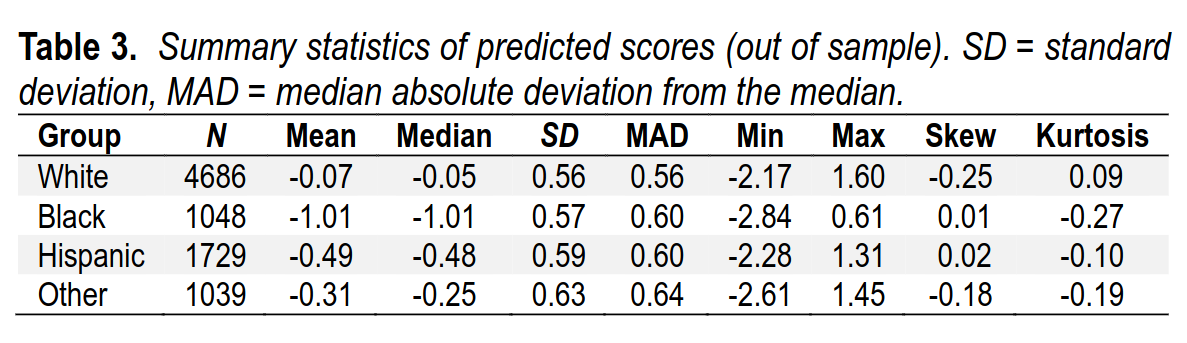
Second, it might be due to the individual groups having lower variability in intelligence than the combined sample (cf. Table 1), because lower variability in a predictor or a criterion can result in attenuated correlations. The summary statistics of the predicted MRI scores are shown in Table 3. As seen, the predictions were close to normally distributed in each group as judged by the near-zero values of skew and kurtosis. The variability (SDs) of the MRI predictor were somewhat larger for the non-White groups. Strikingly, the means differed substantially by group: Black-White d = 1.63, Hispanic-White d = 0.73, Other-White d = 0.42. As these gaps are larger than those on the phenotype we were predicting, this suggests confounding.
So, the predictions are worse within groups than in the overall sample. The explanation seems to be that the model learns how to predict intelligence by just predicting ancestry. In other words, there are some brain features that correlate with race, and thus intelligence indirectly, but don’t really relate to intelligence directly. These are thus useful proxies when using a mixed-ancestry sample, but don’t actually work within a homogeneous group.
To validate this idea, we instead asked the models to predict people’s social race (again, what race the parent claimed the child is), and it is quite accurate:
We find that the model for predicting social race performs fairly well, with an AUC = .84 and an accuracy of 73.0%. The latter value can be compared to the 55.1% which would result from merely guessing the base rate of the most common group (Whites).
As such, the model improvement in terms of reduced error rate was 40% (1 – (100 – 73.0) / (100 – 55.1)). Table 4 shows the confusion matrix. In the table, we see that the model was able to predict the difference between socially-defined Blacks and Whites with near-perfect accuracy. Of those predicted to be White, 2% were Black; of those predicted to be Black, 2% were White. The results were worse for the other two social race groups, which were ancestrally more heterogeneous. This is not surprising because, from a commonsense hereditarian perspective, brain variation will mostly follow genetic ancestry not social race. Insofar as social race fails to proxy genetic ancestry, the predictions of social race from MRI data is expected to be poorer.
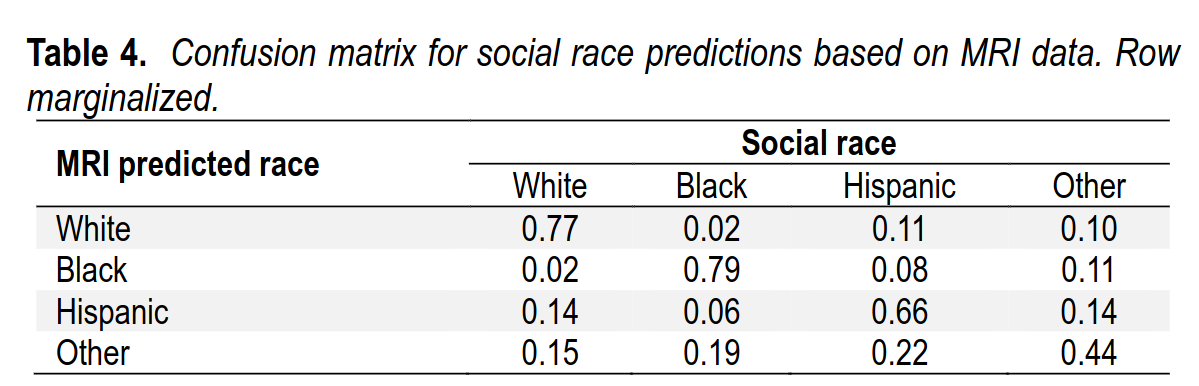
So, if you guessed at random with the best blind guess (White), you would be wrong 44.9% of the time, and if you use the MRI data too, you would only be wrong 27% of the same, a substantial improvement. But it undersells the validity because of course social races are somewhat arbitrary, especially in our case where we grouped everybody who wasn’t White, Black, or Hispanic into an “Other” category consisting of Chinese, Indians, Pacific Islanders, and so on. When you contrast the two most homogeneous groups, Blacks and Whites, the model is quite rarely wrong.
But really, predicting genetic ancestry itself should be more accurate, as brain functioning should mostly follow genetics:
To examine the issue further, we trained a new model to predict genetic ancestry instead of social race. We limited the analysis to persons with genetic ancestry from the three largest clusters of ancestry in our dataset: European, African, and Amerindian. These genetic ancestry estimates were reused from a prior study (Fuerst et al., 2021). The resulting subset of data had 5,348 subjects with complete data. As ancestries must sum to 1 and cannot be negative, we use Dirichlet regression to analyze the data. Specifically, we used the Compositional package in R because it allowed for penalization (Tsagris et al., 2022). The results, again using 10-fold cross-validation, are shown in Table 5.
We find that MRI-based predictions of genetic ancestry are very accurate. The three correlations of interest are .91, .89, and .61, for European, African, and Amerindian ancestry, respectively. As expected, the correlations were higher for European and African ancestry than for White and Black social race, respectively. Note, the correlation for Amerindian ancestry was lower because the proportion of Amerindian ancestry was low in this sample at 3%. To repeat the conclusion, we see that machine learning (ML) can identify both social race and genetic ancestry from MRI data with a high degree of accuracy.
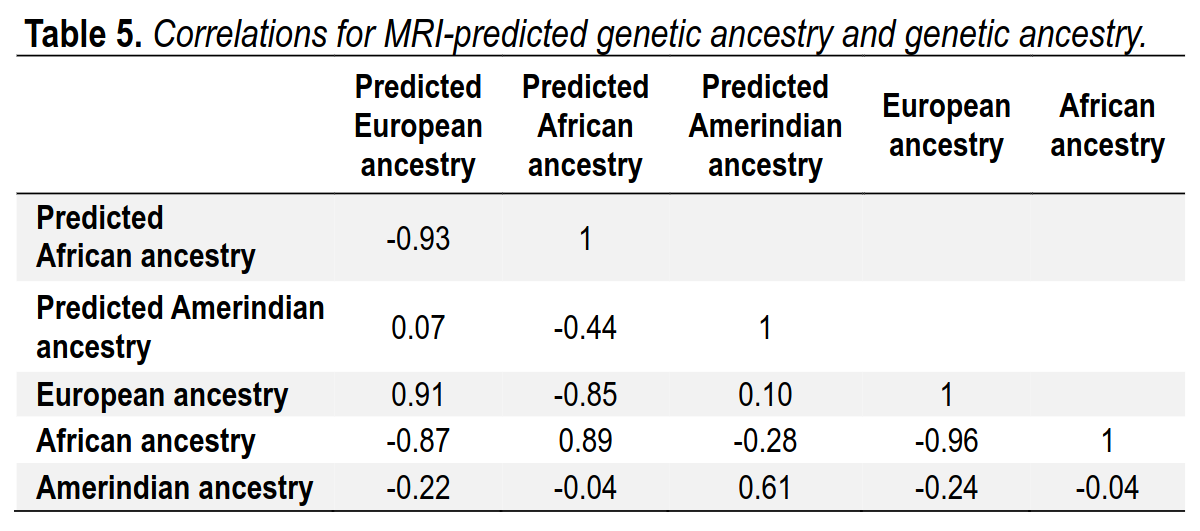
So the model can predict European ancestry with a correlation of .91, African with .89, and American with .61. The lower value for the latter reflects the fact that this ancestry is quite small in the present dataset, as Hispanics are largely European-descent.
Going back to the ancestry confounding problem, we trained the model only on the White subsample, which is smaller. The validity here was still quite high, r = .48:
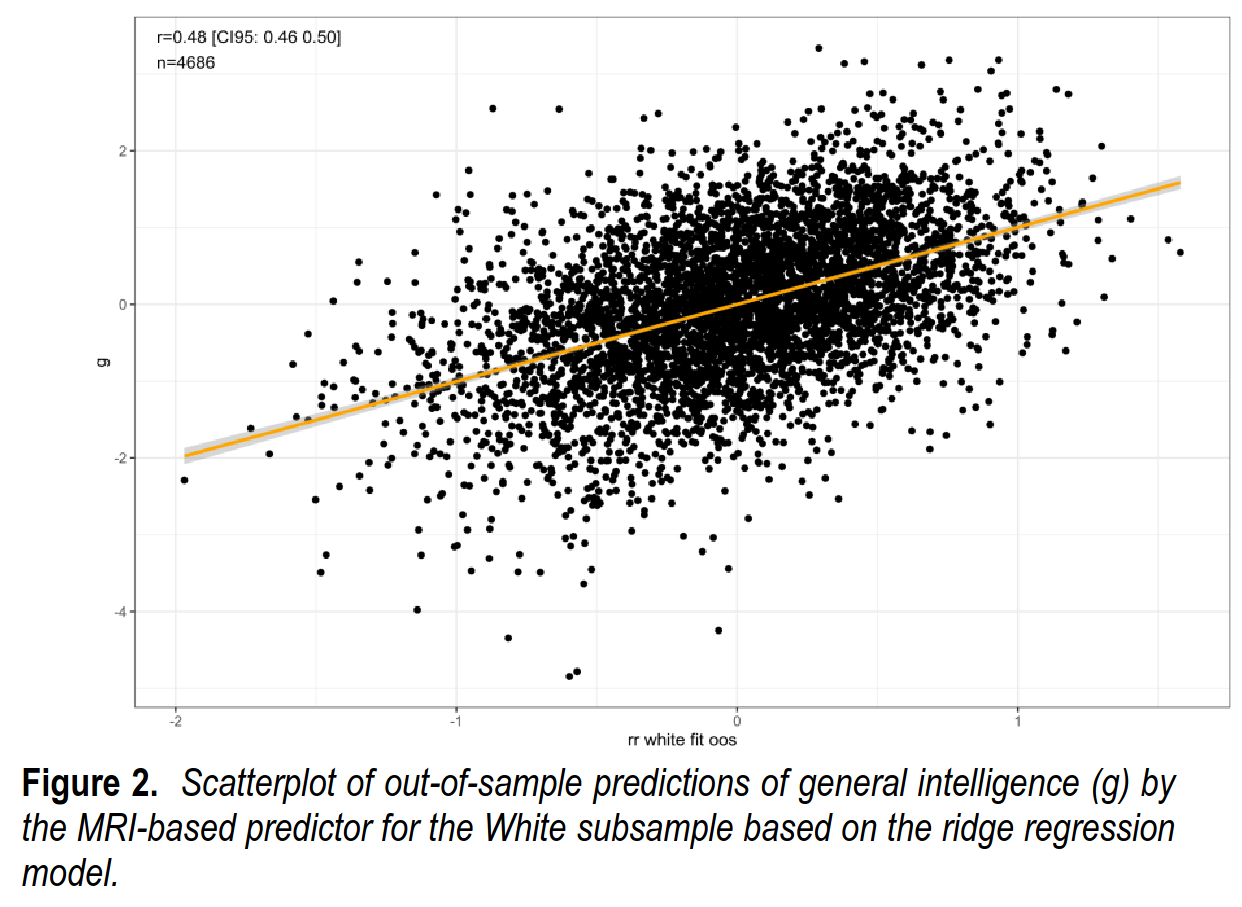
This value is smaller than the r = .61 seen in the full sample. Some of this decline is due to the smaller training sample used, and some of it is due to the model being unable to ‘cheat’ using ancestry as a proxy. To explore this issue, we tried various combinations of samples for training, testing, and sample sizes:
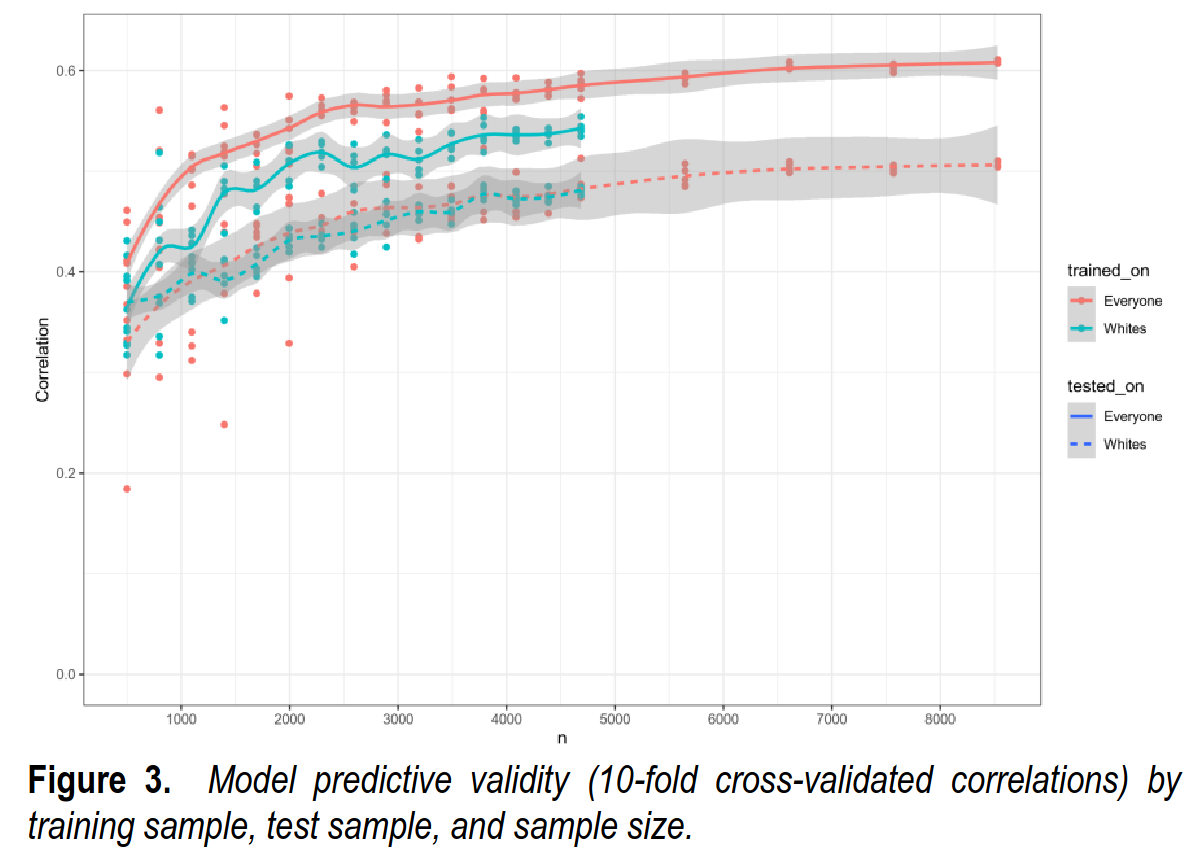
There are four lines in Figure 3. By comparing them, one can infer the factors that affect the validity of the MRI-based predictor. First, when comparing the two full lines (in which case the model was tested on everyone) it can be seen that training on Whites vs. everyone reduces the validities. The difference between the two lines reflects the size of the ancestry confounding. Second, when comparing the two turquoise lines (in which case the model was trained on Whites), it can be seen that the testing sample mattered because in this case, the validity is lower in the White subsample. Finally, when comparing the two dotted lines (in which case the model was tested on Whites) it can be seen that the training sample does not matter. Thus, whatever extra information the model is learning when training in the multiracial sample does not affect the validities in the White subsample.
The values obtained for the maximum possible sample size of N = 4,686 are shown in Table 6. As seen, training and testing on the White subsample decreases the validity by about r = .10 as compared to training and testing on the full sample. This decrease cannot be attributed to sample size, as this variable was held constant. The intelligence SD is smaller in the White subsample than in the full sample (1.00 vs. 1.13), and this reduced variance may account somewhat for the decrease in the correlations (restriction of range; Hunter & Schmidt, 2015).
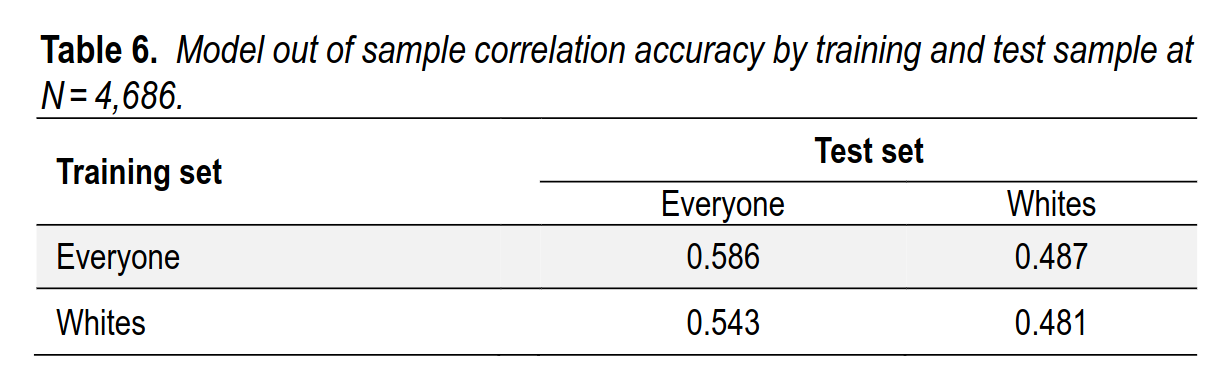
Thus, the use of the full sample as test set makes the correlations a bit larger because it has more variation (less ‘restriction of range’), and the use of the ancestrally mixed sample for training and testing has an effect too.
Using the model trained only on the White subsample avoids the ancestry confounding and produces very similar validities within each group:
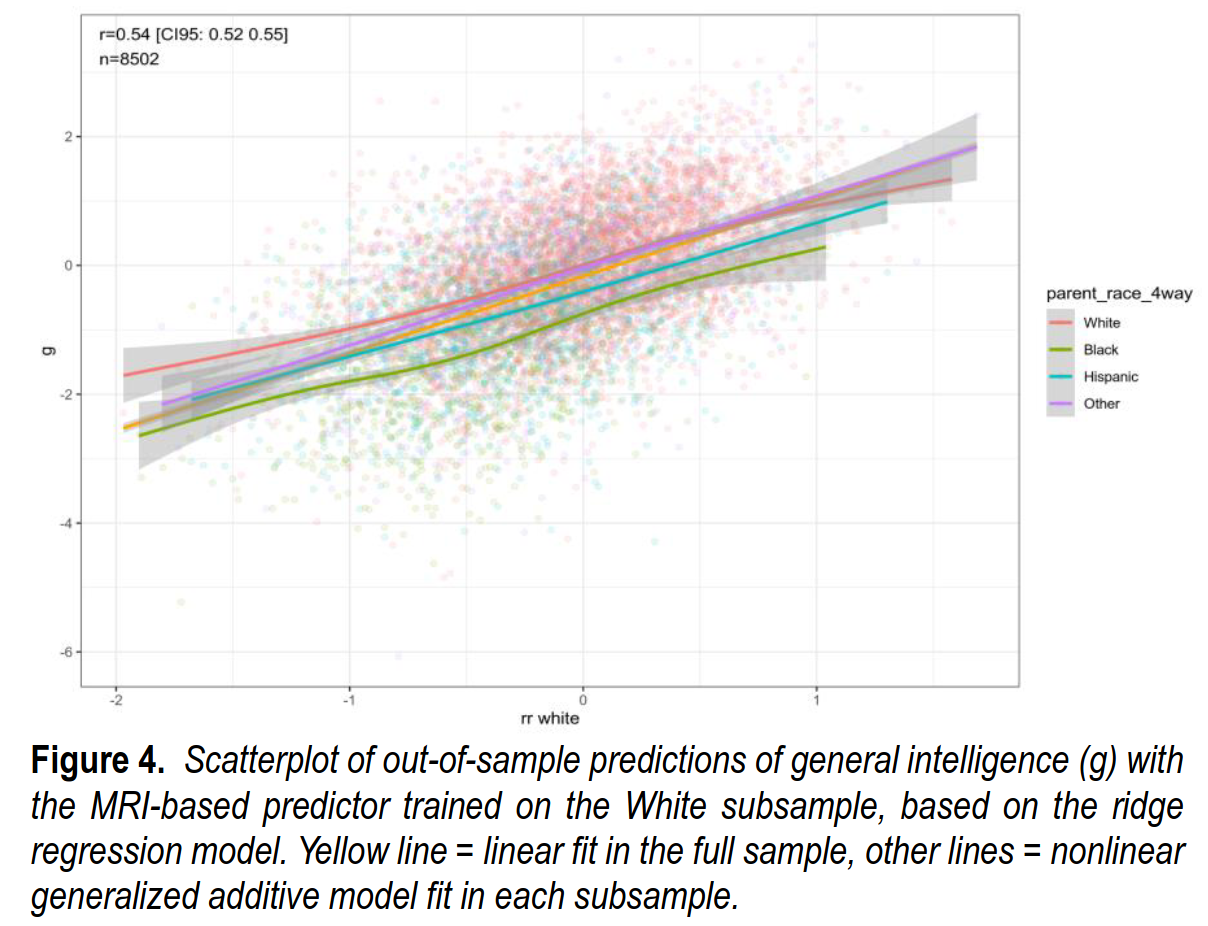
As before, we can evaluate this new model for its validity within each group:
We can evaluate the potential model predictive bias using a regression model. The results are shown in Table 7. As before, there are four models. The first is the baseline race-only model. This shows that without using any MRI data, we can predict 14.6% of the intelligence variance with social race. In contrast, Model 2 shows that by using only the MRI-based predictor, we can predict 29.2% of the variance. Model 3 shows that we get to 34.6% of the variance by using both race and the MRI-based predictor, an increase of 5.4%points. Finally, in Model 4, we add interactions between race and the MRI-based predictor but, as before, doing so does not result in a gain in variance explained.
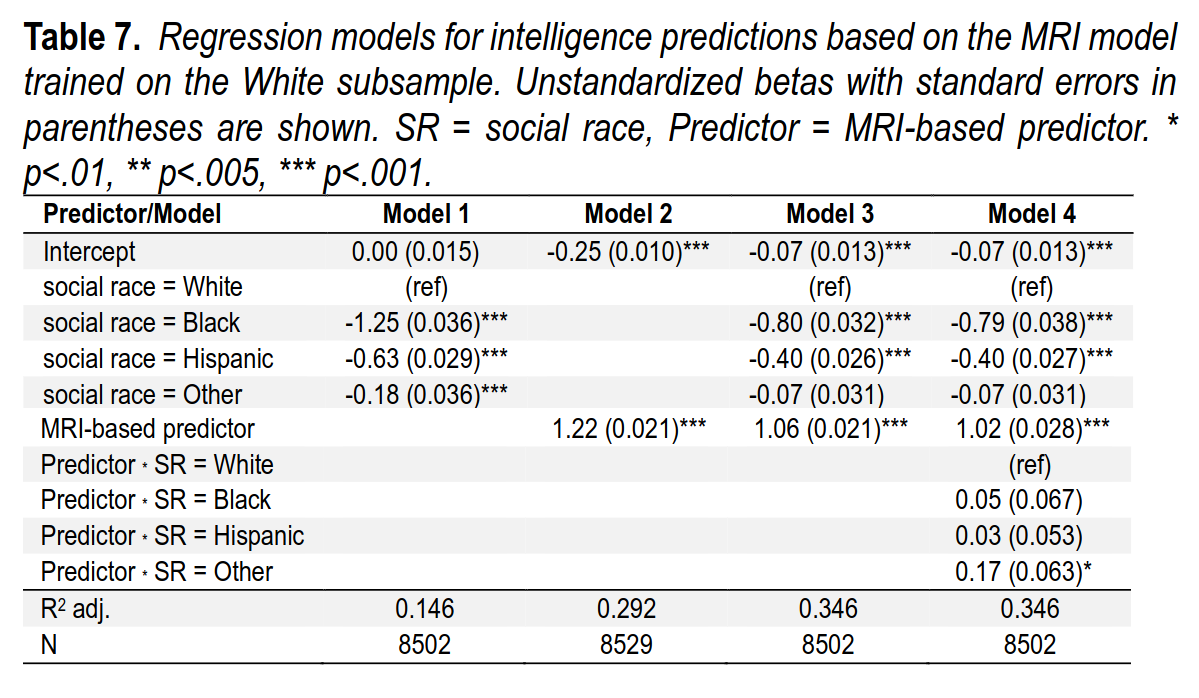
So before adding the MRI predictor, the Black-White gap was 1.25 d, and afterwards it is 0.80 d. Thus the MRI can explain (1.25-0.80)/1.25=36% of the gap. Obviously, since all intelligence differences ultimately are explained by the brain, this is only a third of what a true model would be able to do, but it is a good start. The validities are again slightly larger in the non-White groups, especially the heterogeneous Other group, and that’s due to the larger variation in brains in these subsamples.
Going back to the old literature, there is a lot of talk about the race differences in brain size (total brain volume). In the ABCD these are:
We can compare the reported results to those derived from whole brain volume. Table 9 repeats the models of Table 7, replacing the MRI-based predictor with whole brain volume. We see that whole brain volume is a relatively weak predictor in this sample. Model 4 gives the validity for predicting intelligence, which is β = .15. As such, the MRI-based predictor is 3.4 times better at predicting intelligence. Regarding the size of differences, the Black-White, Hispanic-White, and Other-White whole brain volume differences are, respectively, 0.99d, 0.54d, and 0.36d. Thus, the MRI-based predictor exhibits somewhat smaller gaps than whole brain volume. However, the predictor’s validity is much higher and so it explains a larger percentage of group differences.
Thus, brain size is relatively impotent here, r = .15 or so, about half the adult value from the best study. This is probably due to growth pattern changes in children. The gap sizes in brain sizes are quite substantial in these modern data, so the values Rushton reported were accurate.
Poking further into the validity of the model, we examined which kinds of MRI-data had the most validity. The datafiles come in large groups that concern different types of data. Some are structural (volumes of different regions), white/grey matter etc., others are functional MRI while taking various psychological tests (e.g. the n-back), some are standard errors of estimates (which might relate to head movements in the scanner). If we train a model on each subset of variables, we find this pattern:
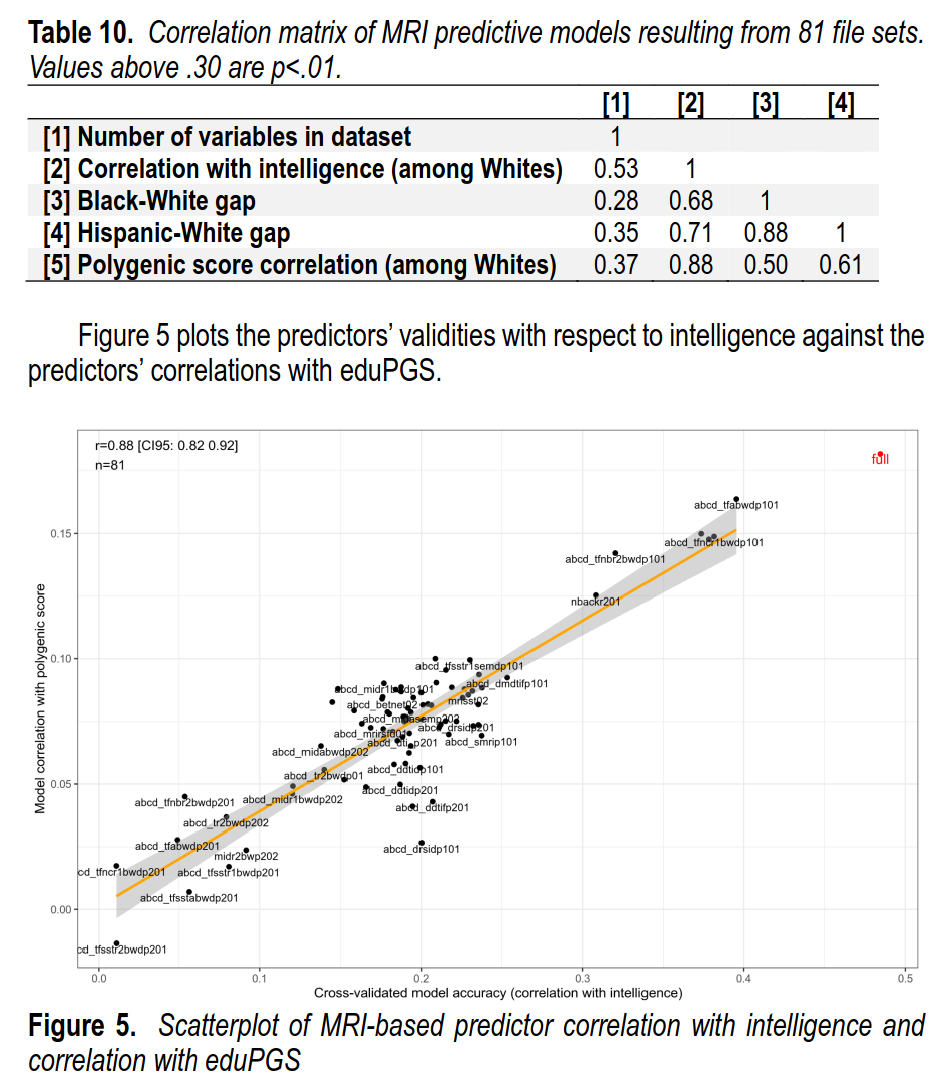
Thus, of the 81 collections of MRI data, the fMRI data were the most useful. Some datasets alone resulted in models with r = .40 validity (80% of the full model), while others had no discernable validity (bottom left). We then related the validity of these different brain models to other variables including polygenic scores for education/intelligence in the White subsample. We find that the models that produce more accurate predictions also had stronger correlations with polygenic scores (White subsample), showed larger race gaps (Black-White, Hispanic-White). So everything works as expected from a hereditarian perspective. The extended Spearman’s hypothesis pattern.
Finally, we tried to figure out an optimal subset of MRI variables to use. Clearly, if some subset of MRI variables can produce r = .39 compared to the full model’s r = .50 and some produced r = .00, then probably one can select some subset of variables in an intelligent way that would also produce the same accuracy as the full model. We found that the regular LASSO approach didn’t work well here, and neither did the grouped LASSO. However, we found that the simpler grouped forward selection works well:
Because of this unsatisfactory result, we tried a simpler approach. We used grouped forward selection. In forward selection, one begins with an empty model (intercept only). Then each possible predictor is considered and the best ones are chosen by some fit criterion such as BIC. The grouped forward selection works the same way, except with groups of variables. For the criterion, we used the cross-validated correlation, with a minimum increment of .005. Thus, the algorithm continues adding file sets of predictors to the model until the model no longer improves its cross-validated correlation by at least .005.
This algorithm resulted in the selection of 7 file sets totalling 6,070 variables. The cross-validated correlation for this set was r = .50, as compared to r = .48 when using all variables. As we did not have a holdout sample, we have no way to verify this surprising result, given that this could result from even a small amount of overfitting. However, we consider it to be a useful starting point for researchers interested in predicting intelligence using the current dataset. The selected set is:
- abcd_tfabwdp101 (Beta weights for n–back task fMRI in cortical (Destrieux) ROIs averaged across runs)
- abcd_dmdtifp101 (dMRI DTI of fractional anisotropy, part 1)
- mrisstsem01 (Standard error of the mean for SST task fMRI in subcortical (aseg) and cortical (Desikan aparc) ROIs averaged across all runs)
- abcd_tfncr1bwdp101 (Beta weights for run 1 n–back task fMRI in cortical (Destrieux) ROIs)
- abcd_mrisdp101 (sMRI morphometricand image intensity measures, Destrieux ROIs, part 1)
- abcd_midasemdp101 (Standard error of the mean for MID task fMRI incortical (Destrieux) ROIs averaged across runs)
- abcd_mrisdp201 (sMRI morphometric and image intensity measures, Destrieux ROIs, part 2).
Thus, for other researchers going forward from here for more accurate models, we suggest starting with this reduced dataset and applying more advanced methods (random forest, neural networks etc.).
Conclusions
- Using a large modern dataset with top tier neurological data from MRI, we were able to confirm existing hereditarian-minded research on the relationship between brain measures and intelligence.
- The accuracy of this model was surprisingly high, but some of this was related to ancestry confounding that had also previously been explored by other researchers. Using the White subsample of the data is sufficient to remove this, but beware of variance differences in test samples.
- Race gaps show up on these modern predictions of intelligence based on brain data where the model has never seen a non-White person, and they are quite large.
- The MRI-model can account for about a third of the observed intelligence gaps (36% for Black-White).
- The extended Spearman’s hypothesis was seen whereby g-loadings (of the MRI predictors) relates positively to group differences (Black-White, Hispanic-White gaps), and polygenic score validities (heritabilities).
- The hereditarian research paradigm keeps being productive, generating new and interesting results in modern data.
