Unfortunately, Kareem Carr decided to do another popular thread filled with misinformation. Since it is useful to have a go-to rebuttal, I will provide one. The usual rule applies with these kinds of threads, namely Brandolini’s law or the bullshit asymmetry principle: The amount of energy needed to refute bullshit is an order of magnitude bigger than that needed to produce it. Let’s dive into it.

Curiously, Twitter lists a preprint by non-expert (Rebecca Sear) as the authoritative source. I guess Twitter community notes can fail once in a while.
Nigerian IQ
The IQ of Nigeria is a favorite topic for many people. Recall that another African immigrant, Chanda Chisala, also relies on his case study of their Scrabble performance. We covered that particularly idea before. The TL;DR is that if you rank countries based on their performance in mental games, Nigeria’s IQ comes out at 73.1. So why not, let’s look at all the existing studies and compilations. First, let’s begin with David Becker’s current database (version 1.3.3). The IQ for Nigeria given by Lynn’s original 2002 dataset (IQ and the wealth of nations) was 67. In the 2006 update (IQ and Global Inequality), it was estimated at 69. In the 2012 update (Intelligence: a unifying construct for the social sciences), it was estimated at 71.2. Finally, Becker’s v1.3.3 estimated it at 67.8 IQ. Which studies was this estimate based on? We don’t have to guess because the database is public. Here’s the studies:
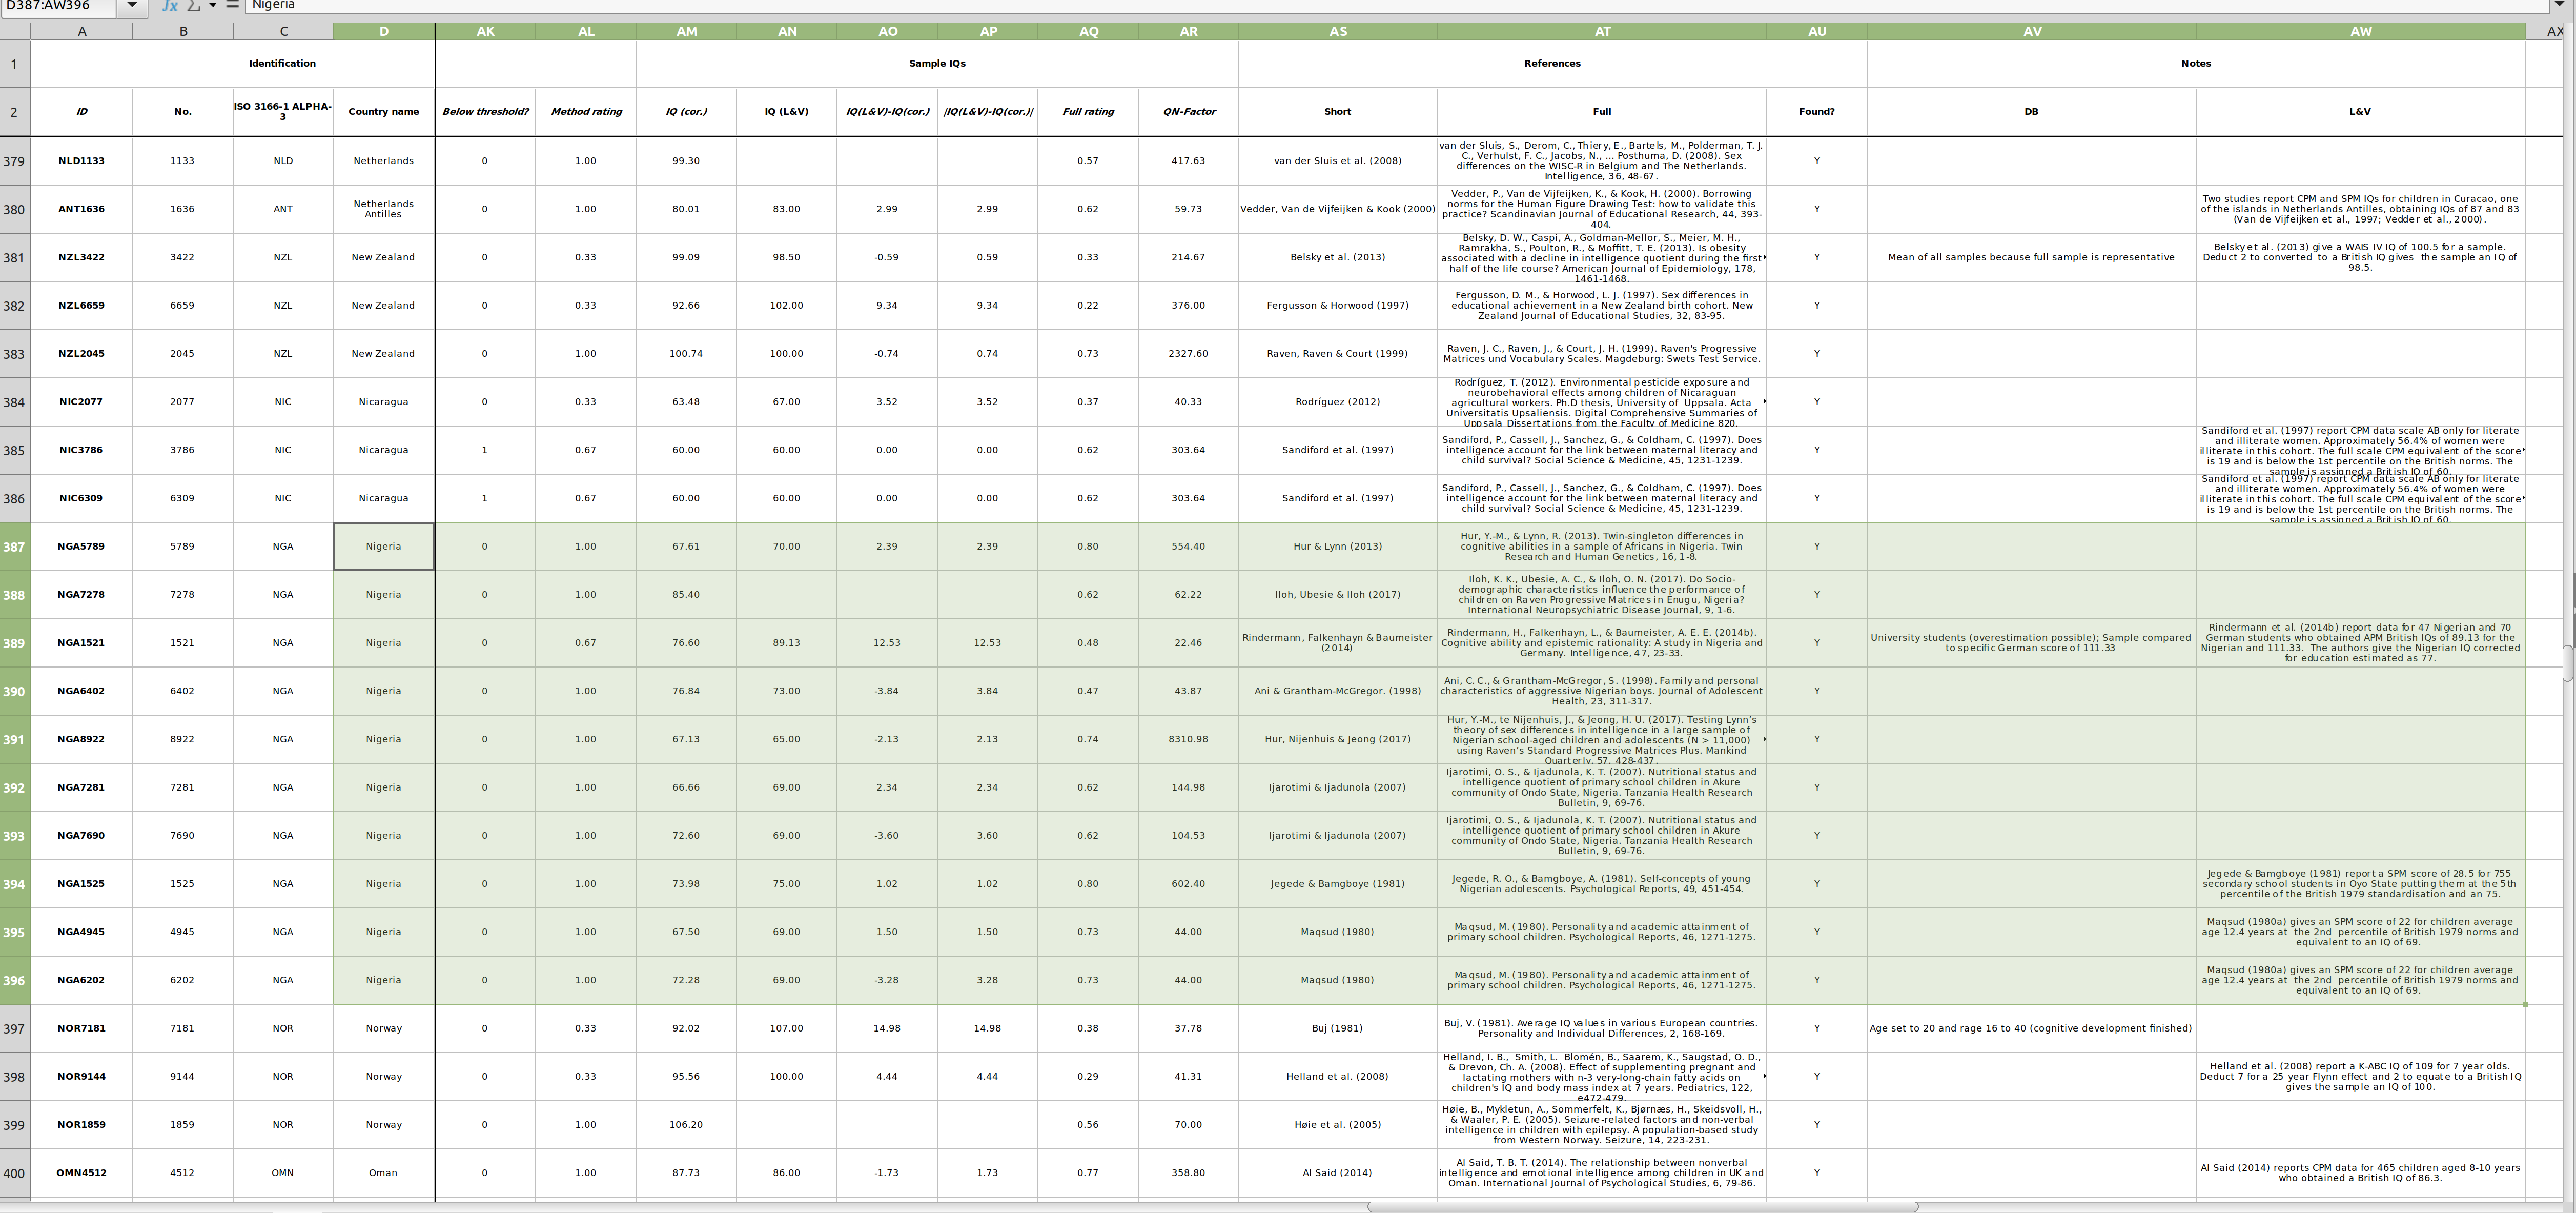
So there are 8 different studies with sample sizes totaling about 10,000 people. Not exactly a good case study to choose if you want to talk about low data quality. The IQs from these studies ranged from 67 to 85. It’s these studies:
- Maqsud, M. (1980). Personality and academic attainment of primary school children. Psychological Reports, 46(3_suppl), 1271-1275.
is study examined the relationships between extraversion, mental ability, and academic attainment of 60 primary school children drawn from a modern primary school and 60 from a traditional primary school. The subjects completed the Junior Eysenck Personality Questionnaire and the Raven Standard Progressive Matrices. A significant correlation of .38 to .52 between extraversion and academic attainment of the children in the modern school and significant negative correlations of -.39 to -.51 for those in the traditional one were found. A significant positive correlation of .49 to .65 between academic attainment and mental ability was also found for the children in the modern school and a positive correlation of .19 to .38 for those in the traditional one.
- Jegede, R. O., & Bamgboye, E. A. (1981). Self-concepts of young Nigerian adolescents. Psychological Reports, 49(2), 451-454.
A longitudinal study of 375 boys and 380 girls just beginning the seventh grade was started in November 1977. The sample, whose mean age was 13.06 yr. (SD = 1.66), was representative of seventh grade students In Oyo State, one of the 19 states in Nigeria. Health, height, onset of menarche in girls, intellectual maturity, and certain social factors were most closely associated with self-concepts.
- Ani, C. C., & Grantham-McGregor, S. (1998). Family and personal characteristics of aggressive Nigerian boys: Differences from and similarities with Western findings. Journal of Adolescent Health, 23(5), 311-317.
Purpose: To identify the family and child determinants of aggressive behaviour in Nigerian elementary school boys and to compare the findings with previous ones from Western studies.
Methods: Forty-seven aggressive boys from four elementary schools in Lagos, Nigeria were compared with 47 matched pro-social boys. Teacher rating and peer nomination were combined to select subjects. The subjects and their parents were given structured questionnaires to obtain information on possible risk factors for aggression.
Results: Compared with pro-social boys, it was found that significantly more aggressive boys came from polygamous families and crowded homes, had more siblings, received less parental affection, were more physically punished, less supervised at home, witnessed more domestic conflicts, did poorly at school, had poorer verbal intelligence and attributed malice more readily than pro-social boys. Logistic regression indicated that the independent family predictors of aggression were crowding, little paternal affection, and corporal punishment. The independent child predictors were biased attribution and poor school achievement. Corporal punishment at school was also an independent predictor of aggression.
Conclusions: The family and child determinants of aggressive behaviour in Nigeria are similar to those found in Western studies except for the small contribution of family instability and overwhelming influence of corporal punishment in our sample. Models of intervention developed in the West may therefore be cautiously applied to Nigerian children.
- Jarotimi, O. S., & Ijadunola, K. T. (2007). Nutritional status and intelligence quotient of primary schoolchildren in Akure community of Ondo State, Nigeria. Tanzania Journal of Health Research, 9(2), 69-76.
A cross-sectional survey was conducted among 402 children (10-15 years) randomly selected from twelve public and private primary schools in Akure community of Ondo State, Nigeria. Self-administered questionnaire was used to collect information on children’s demographic features and parent’s socio-economic characteristics. The subject’s weight, height, height-for-age and weight-for-height z-score were measured and determined respectively. Raven Standard Progressive Matrices consisted of 60 questions was administered in a quiet classroom within 60 minutes to assess intelligence quotient (IQ) of the children. The means of measured parameters were: age, 11.5± 0.08 years; weight, 33.3±0.35kg; height, 1.4±0.0m; height-for-age z-score, -0.003±0.04; weight-for-height z-score -7.2E-7±0.1 and IQ 20.9±0.56 (34.8%). The occupations of the children’s parents were civil service (43.3%), petty business (21.9%), farming (15.8%), vocational jobs (16.0%) and none (3.2%). The majority of the parents (31.8%) had secondary school education. Parents with no formal education, primary education, tertiary education and higher degrees accounted for 7.2%, 30.6%, 22.9% and 7.4%, respectively. Monthly incomes ranged between $38.5 and 230.8. Weight-for-height z-score of the children showed that 49.8% were normal, 40% mildly wasted, 9.7% moderately wasted and 0.5% severely wasted. Height-for-age z-score was 50% normal, 35.1% mildly stunted, 13.4% moderately stunted and 1.5% severely stunted. IQ scores were 5% superior 11.2% above average, 11.4% average, 8.2% below average and 64.2% intellectual deficit. The interrelationship between height-for-age, IQ and socio-demographic characteristics showed that there were insignificant differences between the age groups, gender and socio-economic status of the pupils. Conclusively, this study showed that the proportion of malnourished and intellectual deficit among the studied population were high. However, it is not clear whether the findings are specific to the studied population alone or applicable to other parts of Nigeria. Further studies are therefore needed to confirm these findings.
- Hur, Y.-M., & Lynn, R. (2013). Twin-singleton differences in cognitive abilities in a sample of Africans in Nigeria. Twin Research and Human Genetics, 16, 1-8.
Recent studies comparing cognitive abilities between contemporary twins and singletons in developed countries have suggested that twin deficits in cognitive abilities no longer exist. We examined cognitive abilities in a sample of twins and singletons born recently in Nigeria to determine whether recent findings can be replicated in developing countries. Our sample consisted of 413 pairs of twins and 280 singletons collected from over 45 public schools in Abuja and its neighboring states in Nigeria. The ages of twins and singletons ranged from 9 to 20 years with a mean (SD) of 14.6 years (2.2 years) for twins and 16.1 years (1.8 years) for singletons. Zygosity of the same-sex twins was determined by analysis of 16 deoxyribonucleic acid markers. We asked participants to complete a questionnaire booklet that included Standard Progressive Matrices-Plus Version (SPM+), Mill-Hill Vocabulary Scale (MHV), Family Assets Questionnaire, and demographic questions. The data were corrected for sex and age and then analyzed using maximum likelihood model-fitting analysis. Although twins and singletons were comparable in family social class indicators, singletons did better than twins across all the tests (d = 0.10 to 0.35). The average of d for SPM+ total [0.32; equivalent to 4.8 Intelligence Quotient (IQ) points] and d for MHV (0.24; equivalent to 3.6 IQ points) was 0.28 (equivalent to 4.2 IQ points), similar to the twin–singleton gap found in old cohorts in developed countries. We speculate that malnutrition, poor health, and educational systems in Nigeria may explain the persistence of twin deficits in cognitive abilities found in our sample.
- Rindermann, H., Falkenhayn, L., & Baumeister, A. E. (2014). Cognitive ability and epistemic rationality: A study in Nigeria and Germany. Intelligence, 47, 23-33.
Based on a Piagetian cognitive epistemology approach, this study investigated cognitive ability levels and their relation to thinking patterns in Nigeria and Germany (NNi = 29–47 and NGe = 52–70). 12 selected items of the Raven’s Advanced Progressive Matrices test (APM) and a self-designed questionnaire measuring epistemic rationality (e.g. dealing with health issues, traffic and nature) were administered. The sample was of above-average education. The APM scores were 89.13 for the Nigerian and 111.33 IQ points (Greenwich IQ) for the German subsample (dcorr = 1.48, dIQ = 22; corrected for education the estimated country IQs would be IQNi = 77 and IQGe = 99). APM and epistemic rationality correlated r = .61 (attenuated: rττ = .71; N = 81). The mean difference in rationality was dcorr = 1.85. Comparisons with other studies and everyday behavior suggest that the mean test differences reflect true differences in cognitive ability and epistemic rationality. Cross-country effects were larger than individual effects indicating a strong impact of macro-social factors (partialling out country, the intelligence–epistemic rationality correlation decreases from r = .61 to rp = .27). Consequences for a Piagetian based epistemic rationality theory are discussed.
- Hur, Y. M., te Nijenhuis, J., & Jeong, H. U. (2017). Testing Lynn’s theory of sex differences in intelligence in a large sample of Nigerian school-aged children and adolescents (N> 11,000) using Raven’s standard progressive matrices plus. Mankind Quarterly, 57(3).
Sex differences in intelligence have been much disputed for many decades. The present study examined the issues of whether sex differences in intelligence change during development. In total, 11,164 children (mean age = 13.5 years; SD = 2.6 years) completed the Standard Progressive Matrices Plus (SPM+). From age 8 to 19 years, sex differences in the total score of the SPM+ increased from -0.06d (favoring females) to 0.46d (favoring males), with an average of 0.23d. Our findings support Lynn’s developmental theory of sex differences in cognitive abilities.
- Iloh, K. K., Ubesie, A. C., & Iloh, O. N. (2017). Do Socio-demographic characteristics influence the performance of children on Raven Progressive Matrices in Enugu, Nigeria? International Neuropsychiatric Disease Journal, 9, 1-6.
Background
Evidence has shown neurocognitive problems often exist among human immunodeficiency virus (HIV)-infected children. There are limited data for children in Nigeria.
MethodsThis was a cross-sectional study of 100 school-aged perinatally HIV-infected children seen in the paediatric HIV clinic and age/sex-matched controls from the general paediatric clinic. Neuro-cognitive functioning was assessed using the Raven’s progressive matrices (RPM) that has been adapted for the Nigerian population.
ResultsThe mean RPM score of subjects was 22.97 ± 11.35 compared with 32.93 ± 15.71 among controls (p < 0.001). Twenty-two percent of subjects in the HIV-infected group vs. 56% of controls were in the above-average intelligence group on the RPM. Thirty-four percent had average scores, while 22% were in the below-average scoring range. Neuro-cognitive functioning of the subjects was significantly affected by immunologic staging and socio-economic status.
ConclusionsNeurocognitive functioning of the HIV-infected children was significantly lower than those of their un-infected counterparts. Neurodevelopmental evaluation should be part of standard care in HIV-infected children in Nigerian setting.
As such, there’s no easy way to get out of this one. The studies were done over several decades from 1980 to 2017, by different researchers, and published in different journals. The data quality of psychometric studies for Nigeria is not low. But we don’t have to stop there, we have alternative sources of data. First, there are scholastic tests given in Nigeria that can be put on international norms. This is not PISA, but regional tests that include some countries that also participated in PISA or other international surveys, and thus can be put on the same scale. That’s what the World Bank did. What IQ did they find? Noah Carl tells us:

So it’s in line with the psychometric (mostly Raven’s matrices) results. Again, no easy way to get out of this result.
Many national IQs were estimated by neighbors and some still are
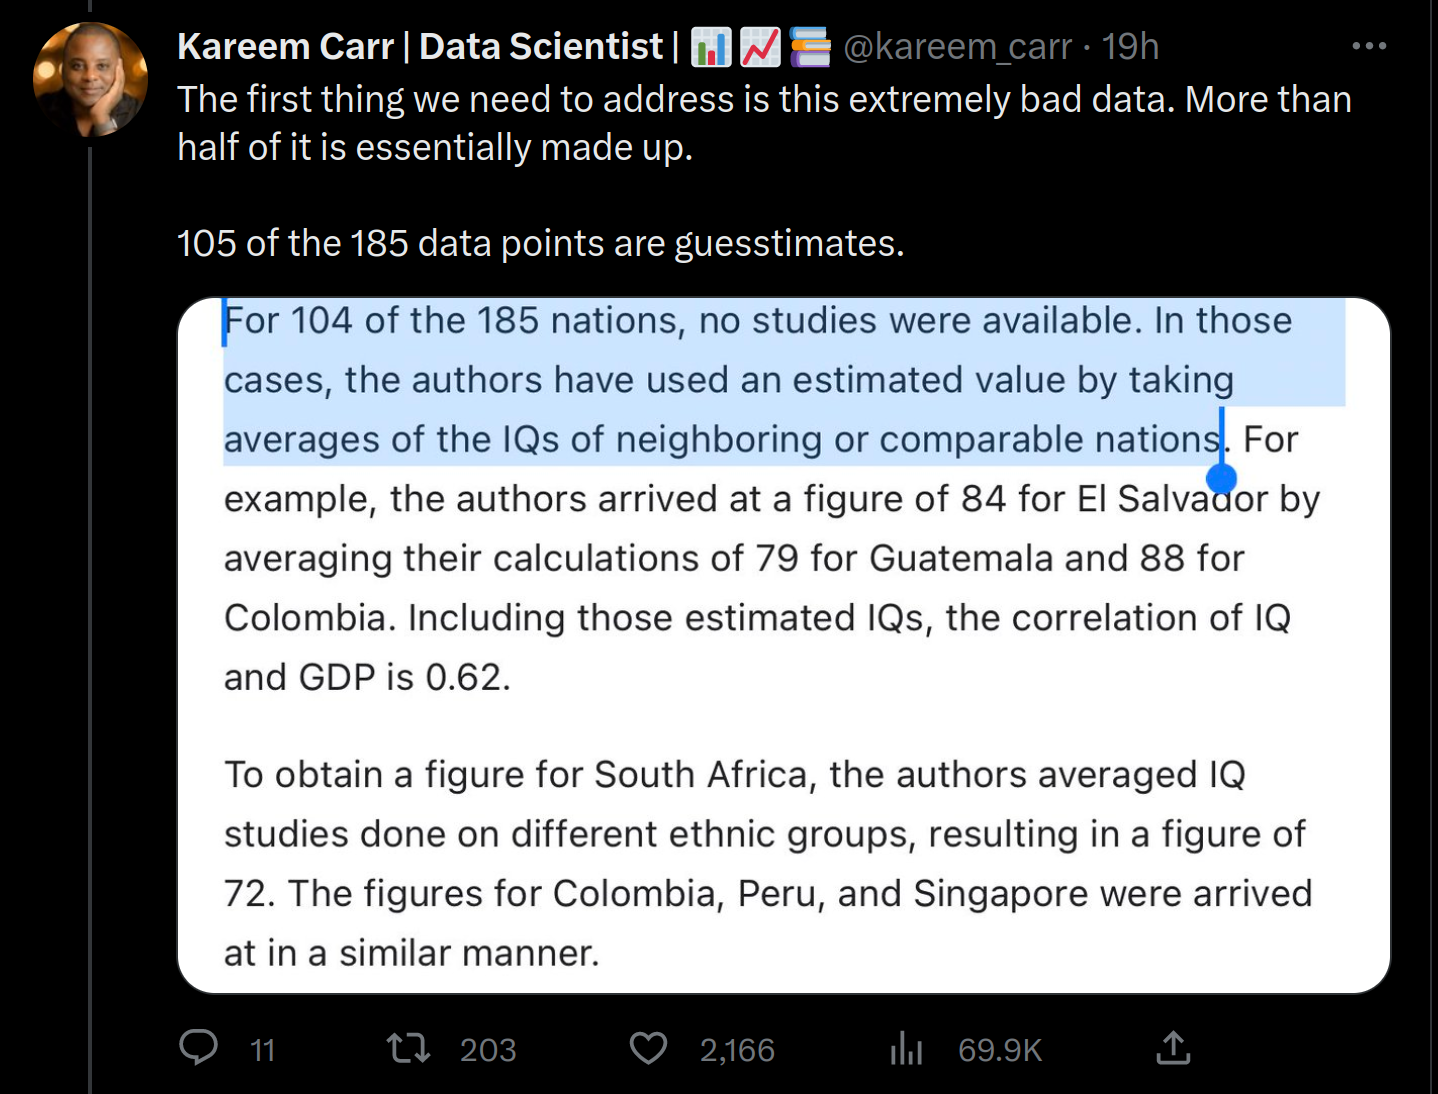
He’s reaching low now, simply quoting Wikipedia about the Lynn 2002 dataset. Hilariously, he manages to introduce an error, as Wikipedia clearly says 104, not 105. In the Becker 2019 compilation, there are psychometric studies for 131 countries, scholastic data for 100, and at least one of them for 149 countries. The remaining countries (most of which are small) had to be estimated by neighbors or other similar countries. When this was done, the total is 201. In other words, we have at least some data for 75% of the countries of the world. That’s not too bad. In fact, this is better than most national datasets, which usually have no data for Africa at all, and are missing large chunks of the world. You can convince yourself of this by browsing OWID. Point being again, Kareem is lazy. He is attacking a compilation of studies from 2002, ignoring 3 updates to this.
Wrong datapoint used
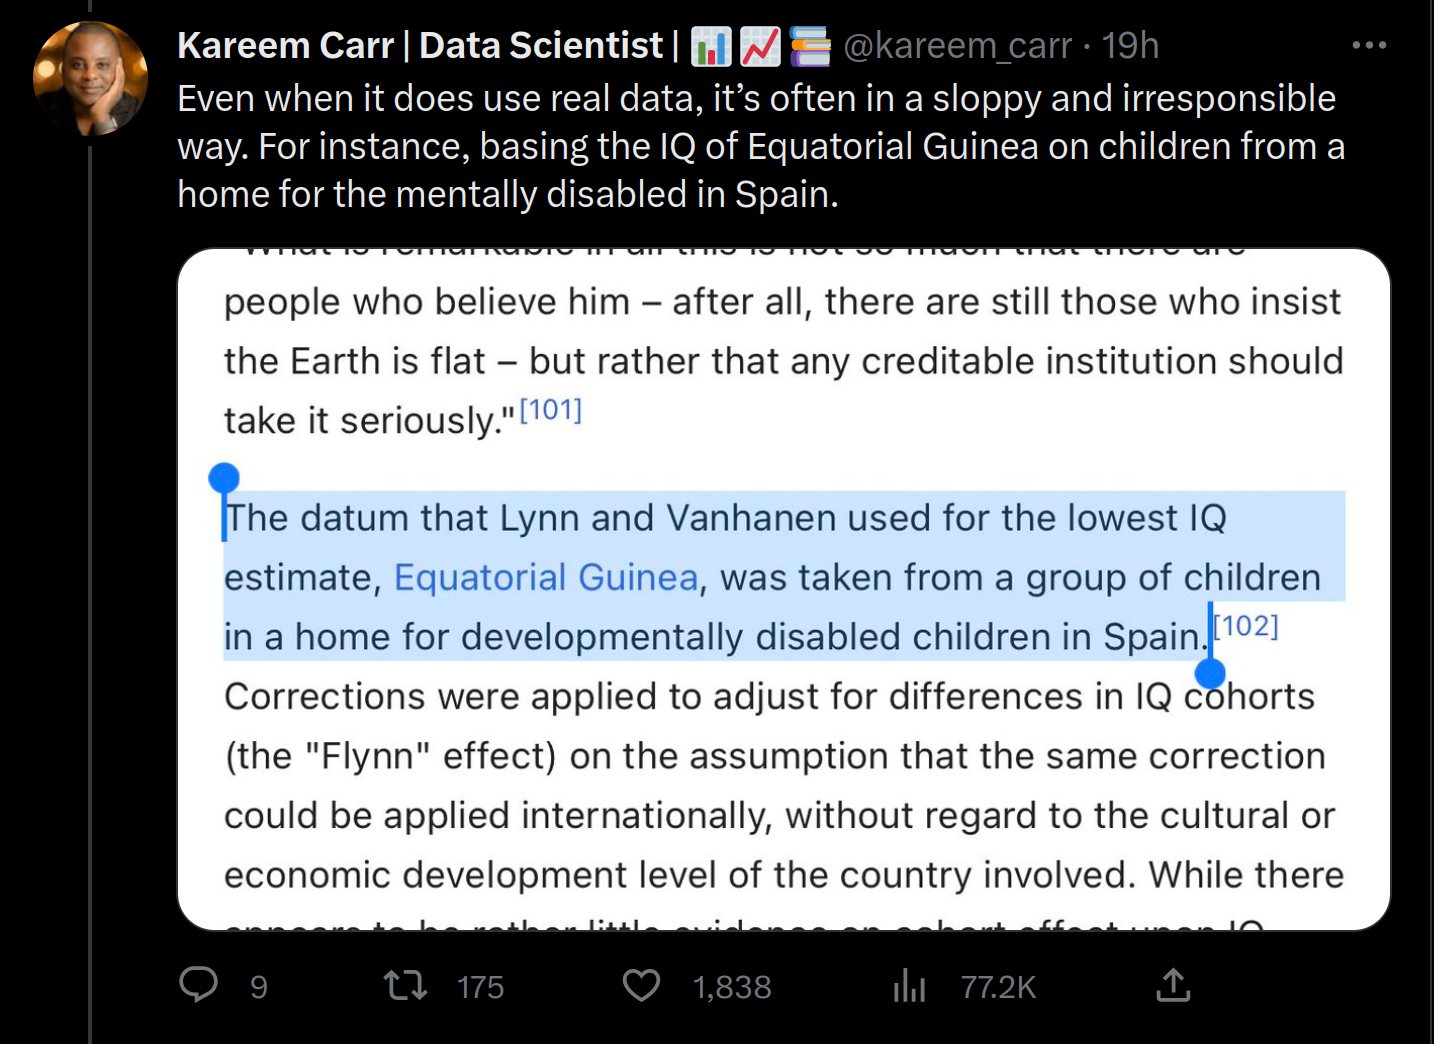
(Now quoting a different Wikipedia page.) The 2002 and 2006 datasets had an error. Wicherts et al 2010 pointed out this error, and it was fixed in the 2012 dataset. This of course did not change much of anything, as the dataset is based on hundreds of studies. It’s a shrug tier complaint.
Objections
The data is of average low quality, so it should be disregarded
Also sometimes invoked by fellow hereditarians, in this case, Monitoring Bias:

No. We don’t disregard African data for any other variable just because it is of low quality. It is in fact essential to good science to use data from as many countries as possible because otherwise you get biases in your international analyses (at the very least, range restriction).
The good thing about the Becker 2019 dataset, is that you can filter studies for data quality. So if you want to analyze national IQ data, but only want to include countries with data from at least 500 people, from at least 3 different studies, you can do that. This criticism is really stupid. It is basically attacking Lynn for being inclusive in his meta-analysis. What else is he supposed to do? If he excluded some countries because the data was poor quality, then the critics would complain that it is not exhaustive.
There are too many decimals

Then mentally delete some of them. The datasets compute averages from multiple studies, thus usually resulting in fractional numbers. What does this matter? It’s a very low IQ complain. No one is claiming that data set precise to 1 decimal point just because decimals are reported. We don’t fault other researchers for this issue when they report meta-analyses with decimals. National IQ’s probably have a standard error of about 5.
A national baseline
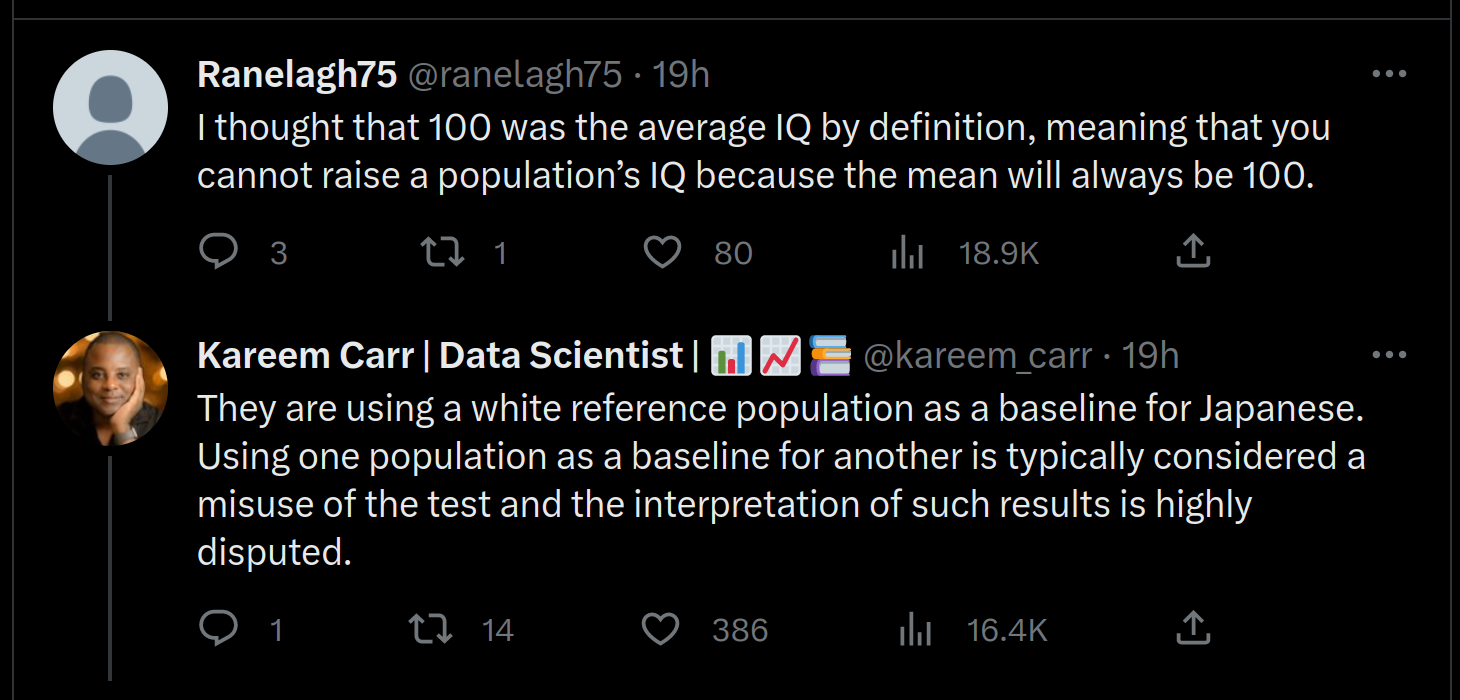
Not really. If you want to compare groups on interval data this has to be done. Of course, Lynn could also have defined the world mean IQ as the weighted mean of his results, but then the country IQ’s would become unstable between updates because the norm they are based on changes. Lynn thus decided to pick a country with good data — the United Kingdom — as his baseline. This objection is really irrelevant because what matters is the gap sizes between countries, not the arbitrary unit they are scaled in. The World Bank, PISA etc. do not use the IQ metric, they scale things into a mean of 500. It doesn’t matter.
I don’t like geographical imputation
Why not? As mentioned above, missing data is bad for regressions. For this reason, it is routine to fill in missing data with plausible guesses. Usually, one uses other variables for this job. However, when the data are spatial, one can also use spatially related other-cases to fill in missing data. That’s what Lynn, Becker etc. are doing, and it’s of course a good method. We can easily reassure ourselves of that by studying Becker’s data. It is simple. We use the data from countries with data, and check what their neighborhood IQ’s are (weighted mean of their 3 largest neighbors’ IQ’s), then correlate these with their measured IQ’s. Recall, that since we are using only the data from measured IQ’s to impute and test with, there is no cheating from reusing IQ’s. If critics are right and this method is bad, the correlation will be weak. Instead, the plot shows this:
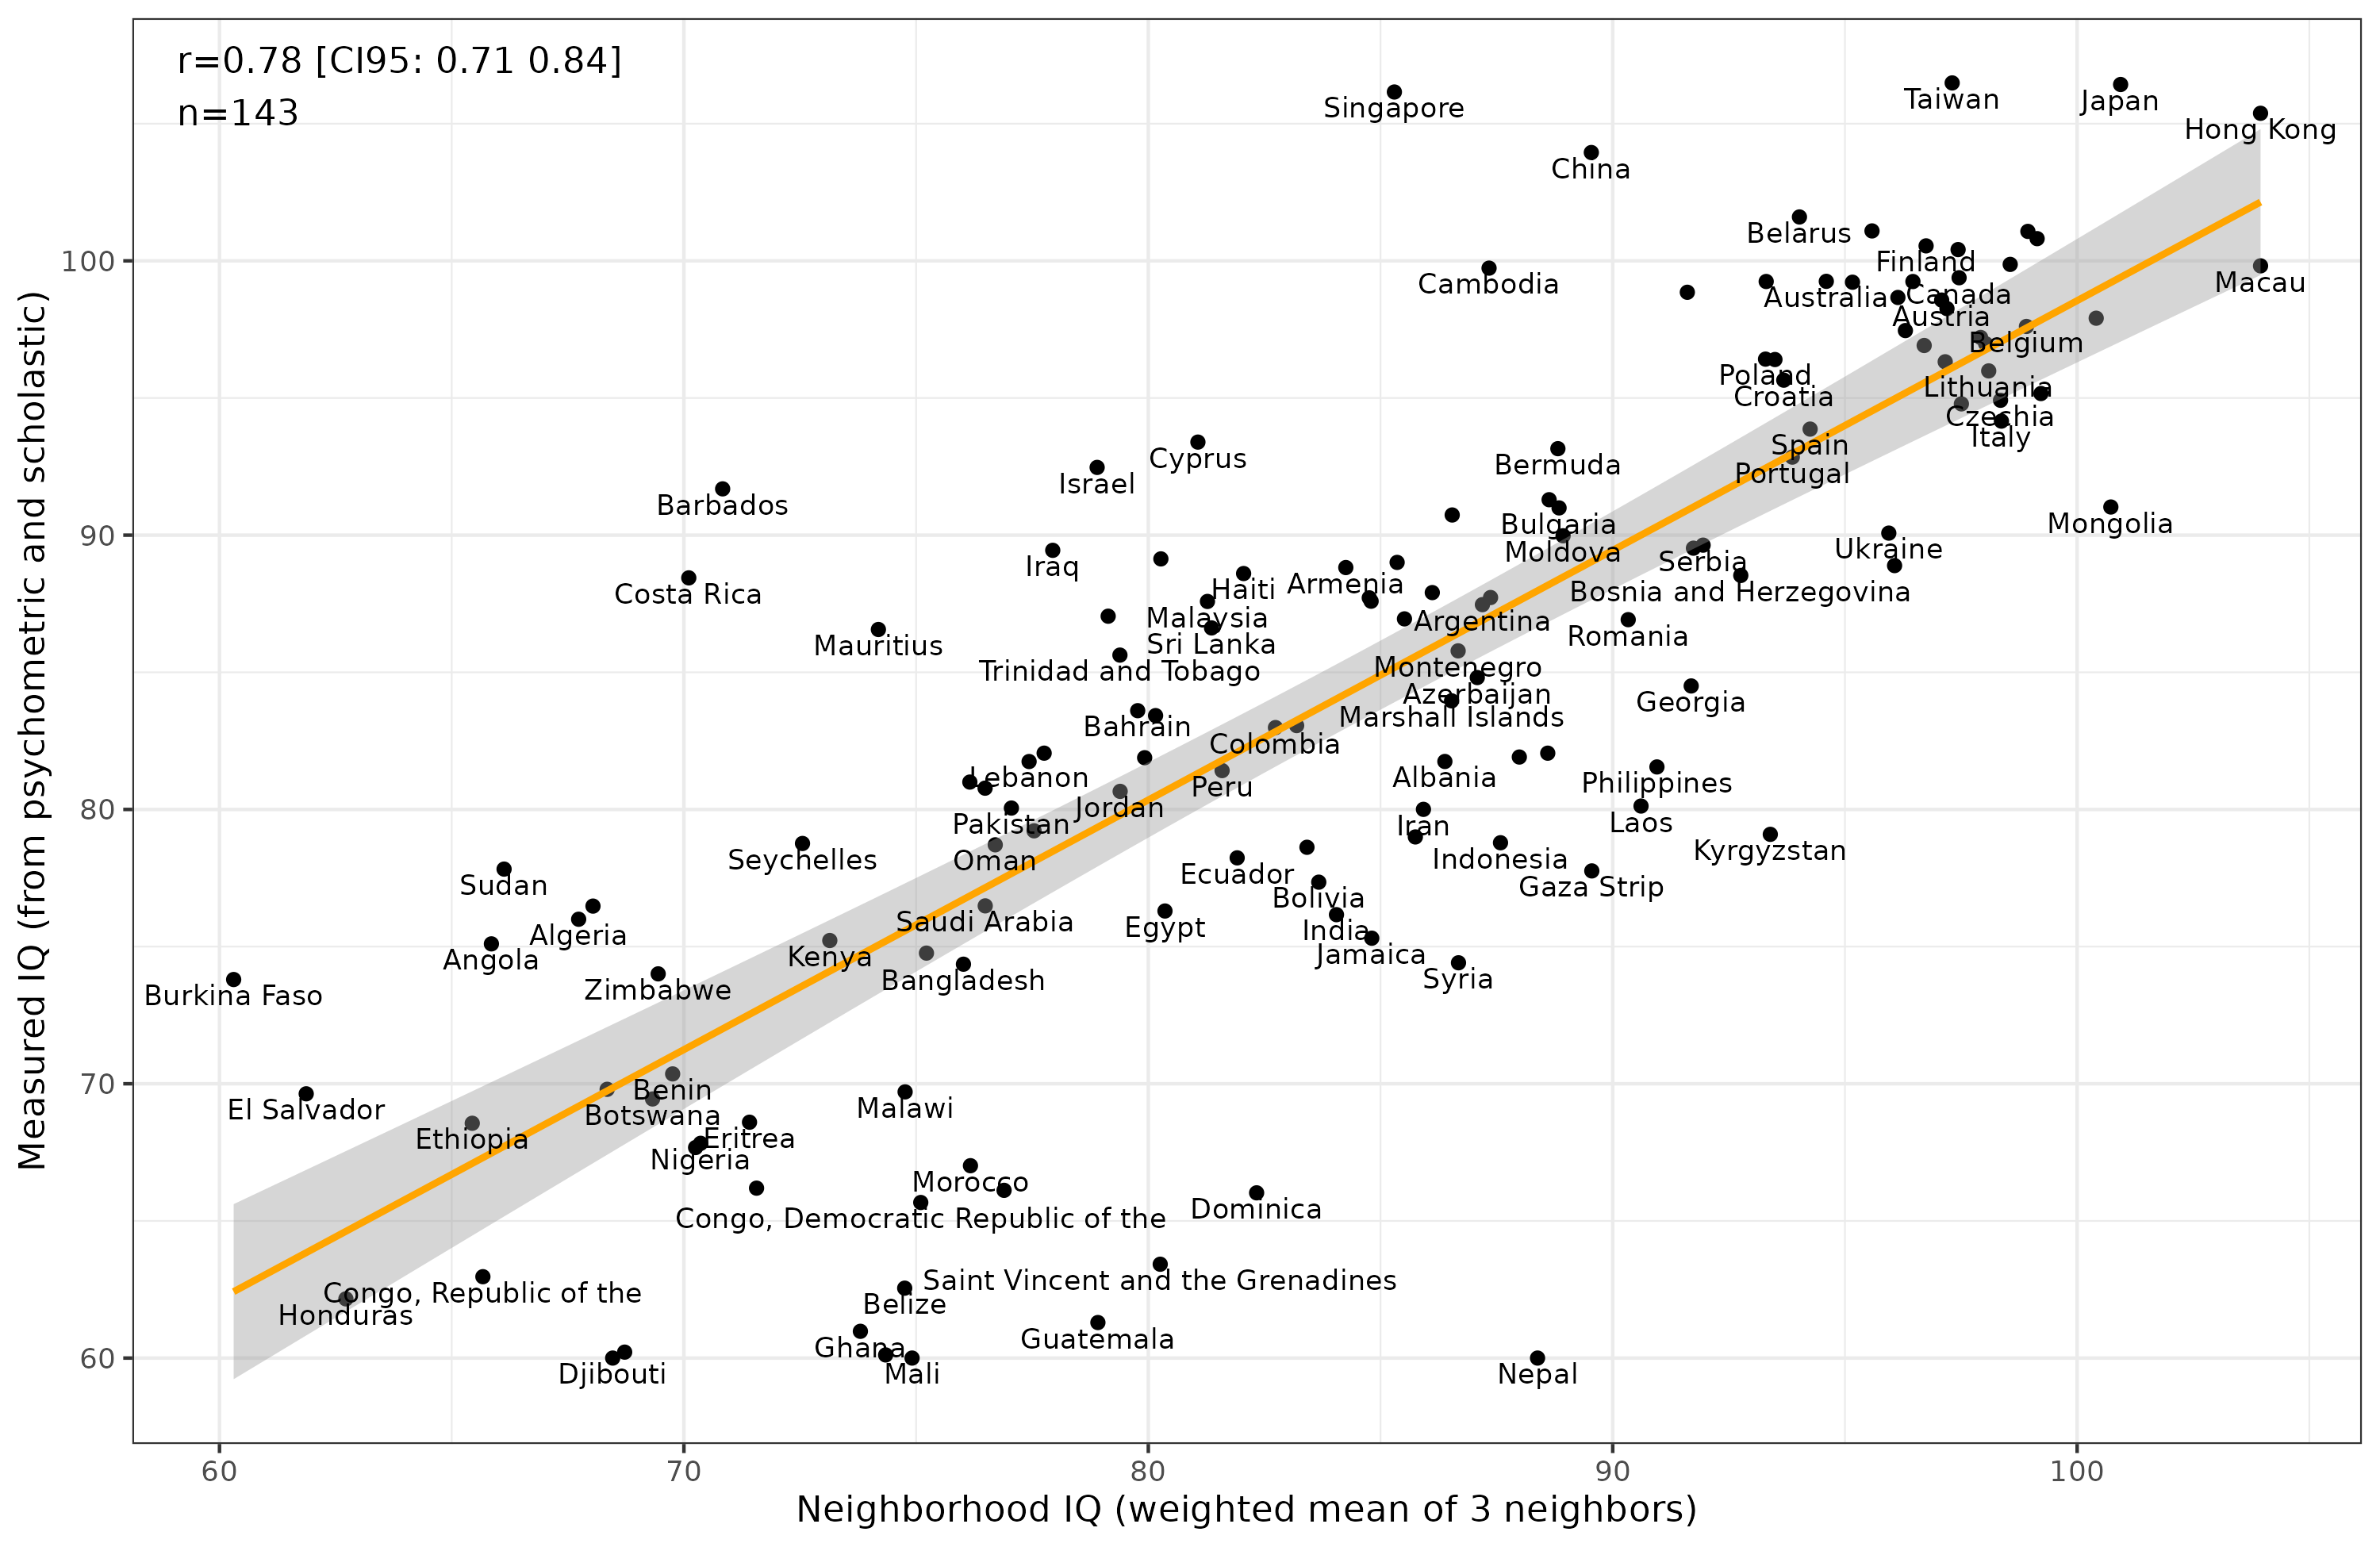
Countries above the line are those whose measured IQ’s are higher than their neighbors, those below the opposite. The correlation is an impressive .78. Singapore does better than expected, Nepal much worse (the IQ of Nepal is not really 60, just there is only poor data and Becker’s 2019 dataset shows about 60!). Of course, this method of imputation works for any kind of statistic that shows strong spatial autocorrelation. There is nothing special about this method when it comes to national IQ’s.