Men vary more than women in most phenotypes we can measure, including intelligence. Inquisitive Bird has a summary of the intelligence findings here. Thöni & Volk 2021 provide a nice illustration from another field:
Gender differences in time, risk, and social preferences are important determinants of differential choices of men and women, with broad implications for gender-specific social and economic outcomes. To better understand the shape and form of gender differences in preferences, researchers have traditionally examined the mean differences between the two genders. We present an alternative perspective of greater male variability in preferences. In a meta-analysis of experimental economics studies with more than 50,000 individuals in 97 samples, we find converging evidence for greater male variability in time, risk, and social preferences. In some cases, we find greater male variability in addition to mean differences; in some cases, we only find greater male variability. Our findings suggest that theories of gender differences are incomplete if they fail to consider how the complex interaction of between-gender differences and within-gender variability determines differential choices and outcomes between women and men.
For instance, here they plotted the variability in strategies chosen in economic games:

Men much more often chose more extreme strategies, such as giving the other person all the money or none of it (dictator game).
Since greater male variability is observed across numerous phenotypes whether psychological, behavioral, and physical, and across species, it must have a genetic basis (when you don’t get misled by small studies). One might wonder what the role of the X chromosome is in this. Since men only have one copy, they must necessarily receive a full effect of a given allele. Women, on the other hand, have two copies, so they are quite likely to get one of each copy of a given allele. In women’s bodies, each X chromosome is randomly turned on or off, so in effect, women’s bodies get a half dose of each allele. Clearly, then, if the X chromosome has important variants, this will contribute to the overall variability between the sexes. But the X chromosome is also only one out of 24 chromosomes. The X chromosome has about 3.4% of the genomic content. Hence, if we are willing to make some assumptions about the distribution of causal variants for a given quantitative phenotype (height, weight, intelligence, etc.), we can run a simulation to see how much this X added chromosome variability would contribute.
I ran a simulation where I assumed:
- There are 2000 men, and 2000 women
- There are 10,000 causal variants
- All causal variants have the same effect size
- The number of causal variants on the X chromosome is equal to its proportion of the genome, so about 3.4% (34o of the 10,000)
Then I simulated data, and computed the polygenic scores. Here’s the ones for the X chromosome only:

There is a large difference, the male SD is 7.94 and the female 5.45, thus a ratio of 1.46. However, since this part of the polygenic score is only 3.4% of the full score, it would seem this contribution should be trivial:

And indeed it is. It can hardly be seen with the eye, but male variability is slightly higher, 59.4 vs. 58.9 (ratio 1.001).
Given the large sample size, this is unlikely to be a fluke, but just in case, I this simulation 100 times:
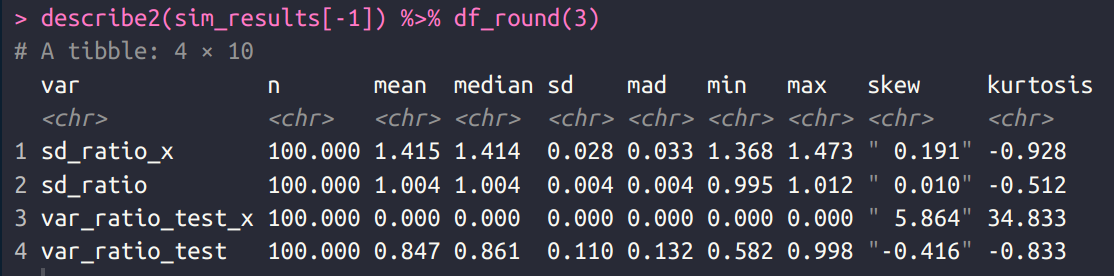
As expected, the results were very consistent. The SD ratio was always around 1.41 for PGS_X, and very close to 1.00 for PGS_ALL. In fact, the variance test failed to generate a p < .05 even once across the 100 runs, despite that being the truth. For actual human phenotypes, the ratio of the SD’s is usually around 1.10 to 1.20, so smaller than those seen for X alone, but much larger than those for the whole genome.
Where does that leave us? Some options:
- There are more variants on the X chromosome than expected by the uniform distribution assumption.
- The effects of variants on X are larger than other variants.
- There are non-linear / dominance effects, such that the difference between having 0 or 1 copies for women is less than that between 1 and 2 copies. This is the typical scenario seen for genetic disorders (recessive/dominant disorders).
- Some other male genetic variants cause interactions with other genetic variants, enhancing the phenotypic variation.
Let’s take them in turn. There are many genetic studies that looked for predictive variants on the X chromosome, and even a meta-analysis of these findings:
The X-chromosome is among the largest human chromosomes. It differs from autosomes by a number of important features including hemizygosity in males, an almost complete inactivation of one copy in females, and unique patterns of recombination. We used data from the Catalog of Published Genome Wide Association Studies to compare densities of the GWAS-detected SNPs on the X-chromosome and autosomes. The density of GWAS-detected SNPs on the X-chromosome is 6-fold lower compared to the density of the GWAS-detected SNPs on autosomes. Differences between the X-chromosome and autosomes cannot be explained by differences in the overall SNP density, lower X-chromosome coverage by genotyping platforms or low call rate of X-chromosomal SNPs. Similar differences in the density of GWAS-detected SNPs were found in female-only GWASs (e.g. ovarian cancer GWASs). We hypothesized that the lower density of GWAS-detected SNPs on the X-chromosome compared to autosomes is not a result of a methodological bias, e.g. differences in coverage or call rates, but has a real underlying biological reason–a lower density of functional SNPs on the X-chromosome versus autosomes. This hypothesis is supported by the observation that (i) the overall SNP density of X-chromosome is lower compared to the SNP density on autosomes and that (ii) the density of genic SNPs on the X-chromosome is lower compared to autosomes while densities of intergenic SNPs are similar.
This is the opposite of option (1).
With regards to dominance, the latest GWAS on education (EA4) included a GWAS for dominance effects:
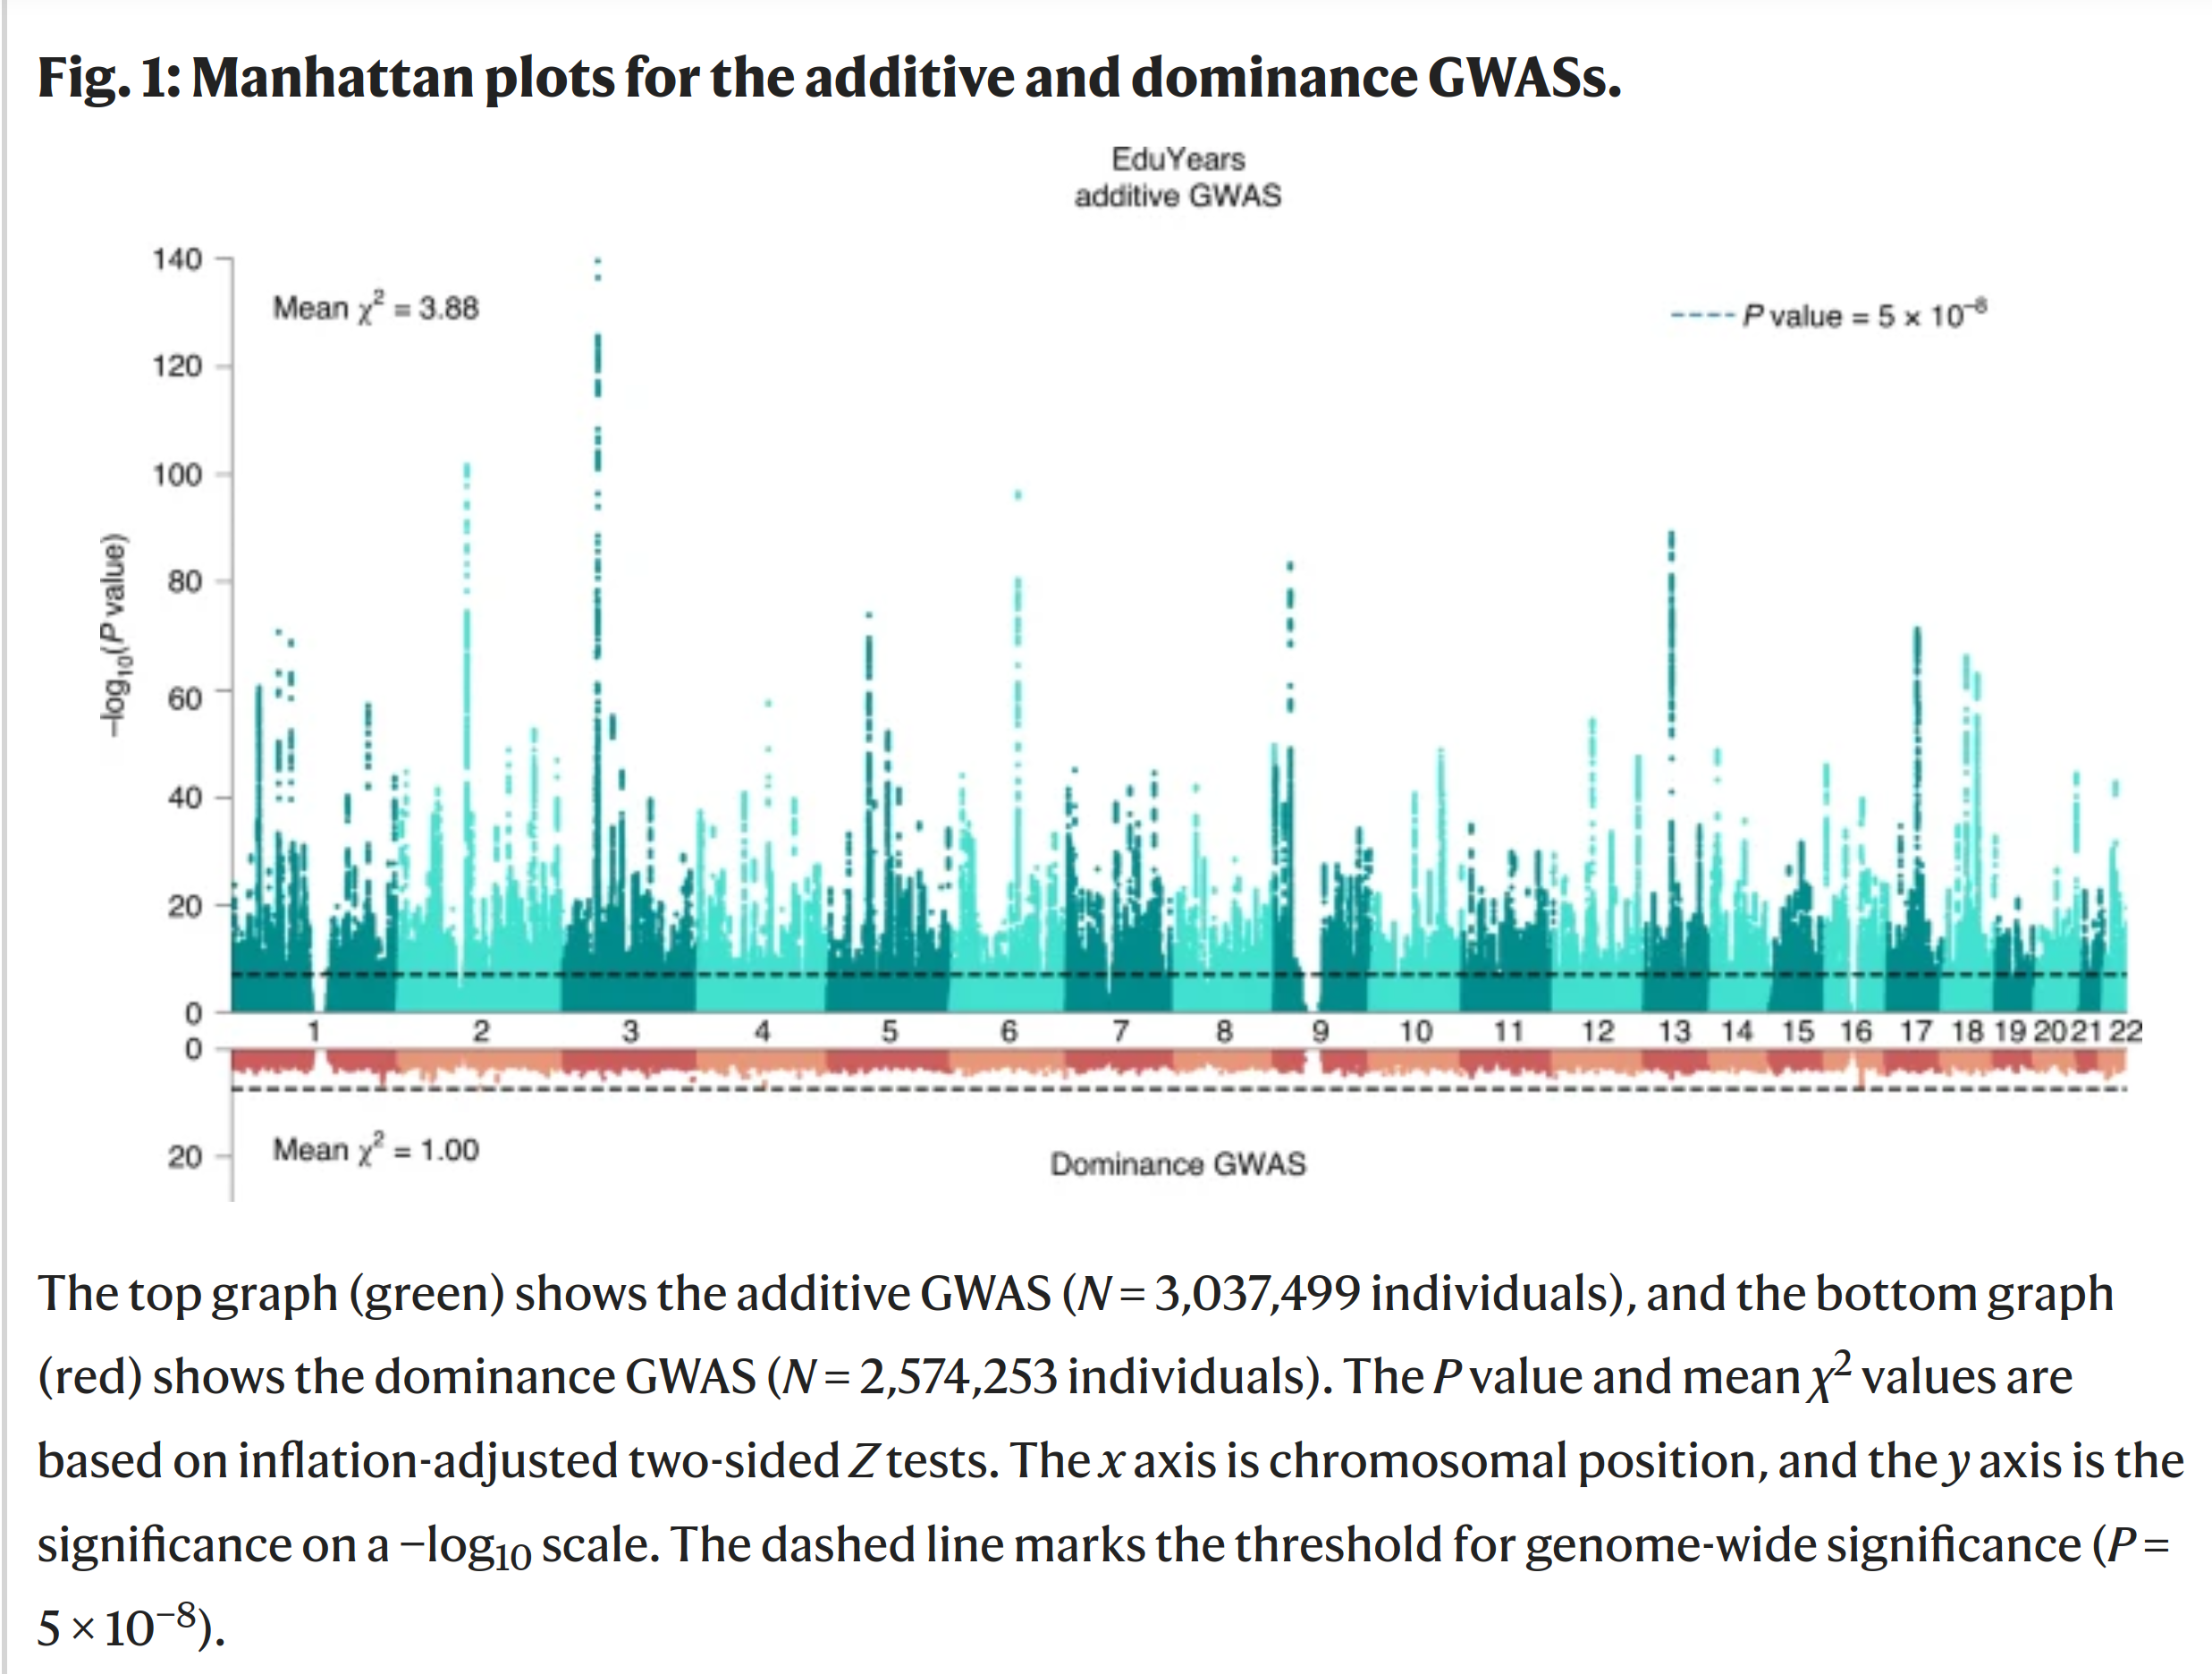
The bars in the top is the autosomal GWAS (chromosomes 1-22), which shows a lot of signal, roughly evenly distributed across the genome. The red version below shows nothing. No SNP showed any statistically detectable effect of dominance. The sample size is quite large, so if there was any, it should have been found. Odd! My guess is that most variants with dominance effects are not SNPs, but larger deletions and the like, and these are not well-proxied by the SNPs used in typical GWASs. If so, studies based on whole genome sequencing data should find them.
Another thing to note is that dominance effects for genetic disorders are usually only in one direction: worse outcomes. Since the greater male variability is also seen for the right-tail of distributions, the directions of dominance must be roughly balanced for complex traits. For instance, whatever dominance exists for genetic variants for height should be roughly equally likely to make you extra much taller and extra much shorter, not just shorter.
What about sex interactions? The same study:
To update the previous X-chromosome analysis, we conducted a sample-size-weighted meta-analysis of mixed-sex association results from UKB and 23andMe (N = 2,713,033) for ~200,000 SNPs on the X chromosome (Extended Data Fig. 4). We identified 57 lead SNPs with estimated effects in the range 1 to 3 weeks of schooling. Our findings are fully consistent with earlier conclusions: SNP heritability due to the X chromosome of 0.4% and (using sex-stratified association analyses in the UKB) a male–female genetic correlation on the X chromosome close to unity (rg=0.94,s.e.=0.03)
The male-female genetic correlation near 1 means the effects were about identical in direction, but since correlations are scale free, the male ones could be a bit larger in general. If they are, male PGSs will be somewhat more variable, and male heritability will be somewhat higher too (because heritability is the ratio of genetic variance to total variance, so if the genetic variance increases without an additional environmental source, the male heritability will be higher). They didn’t seem to examine this question, and this analysis only covered the X variants anyway, not the autosomal ones. GWASs usually find that the genetic correlation across sexes is ~1.
They didn’t seem to try to compare the effect sizes of the X chromosome variants vs. autosomal variants, but this would be somewhat tricky due to the difference sample sizes for these analyses (ideally, one has to subset the data, or apply shrinkage to equalize them). Still, they note that X variants had “estimated effects in the range 1 to 3 weeks of schooling”, and for the autosomal ones they note “On average, an additional copy of the reference allele of the median SNP is associated with 1.4 weeks more schooling: the effects at the 5th and 95th percentiles (in absolute value) are 0.9 and 3.5 weeks”. Thus, they seem to be about the same effect size.
Based on this evidence, the evidence for options (1-3) is negative, leaving us with option (4). My guess is that male hormones interaction with other machinery in the body in a way to add extra variation to the phenotype. In general, because of the greater male variation in fertility, one would expect evolution to favor greater male variability in phenotypes because of the pay-off of being a big winner. Being a bigger loser is not different than being a regular loser, that is, 0 offspring.
If you are interested in more speculation, Johnson et al 2009, has more ideas from the pre-GWAS age. All in all, though, it would appear we still don’t have a plausible, evidence-based genetic model to explain greater male variability.