Many people are currently wondering whether to bother going to the cinema to see the new Dune movie. It currently has a rating of 9.0 on IMDB with 90k votes. Accordingly, it is one of the best movies ever made, ranked 12 of all time right now, or so it seems. But let’s move backwards a bit and consider what makes a good movie. IMDB is kind enough to share parts of their database, which you can download here. They unfortunately don’t offer individual votes, but only the mean rating per movie and the number of votes. Still, if download the data, and filter to a plausible subset (feature films, non-pornography, at least 1000 votes), we get this distribution:
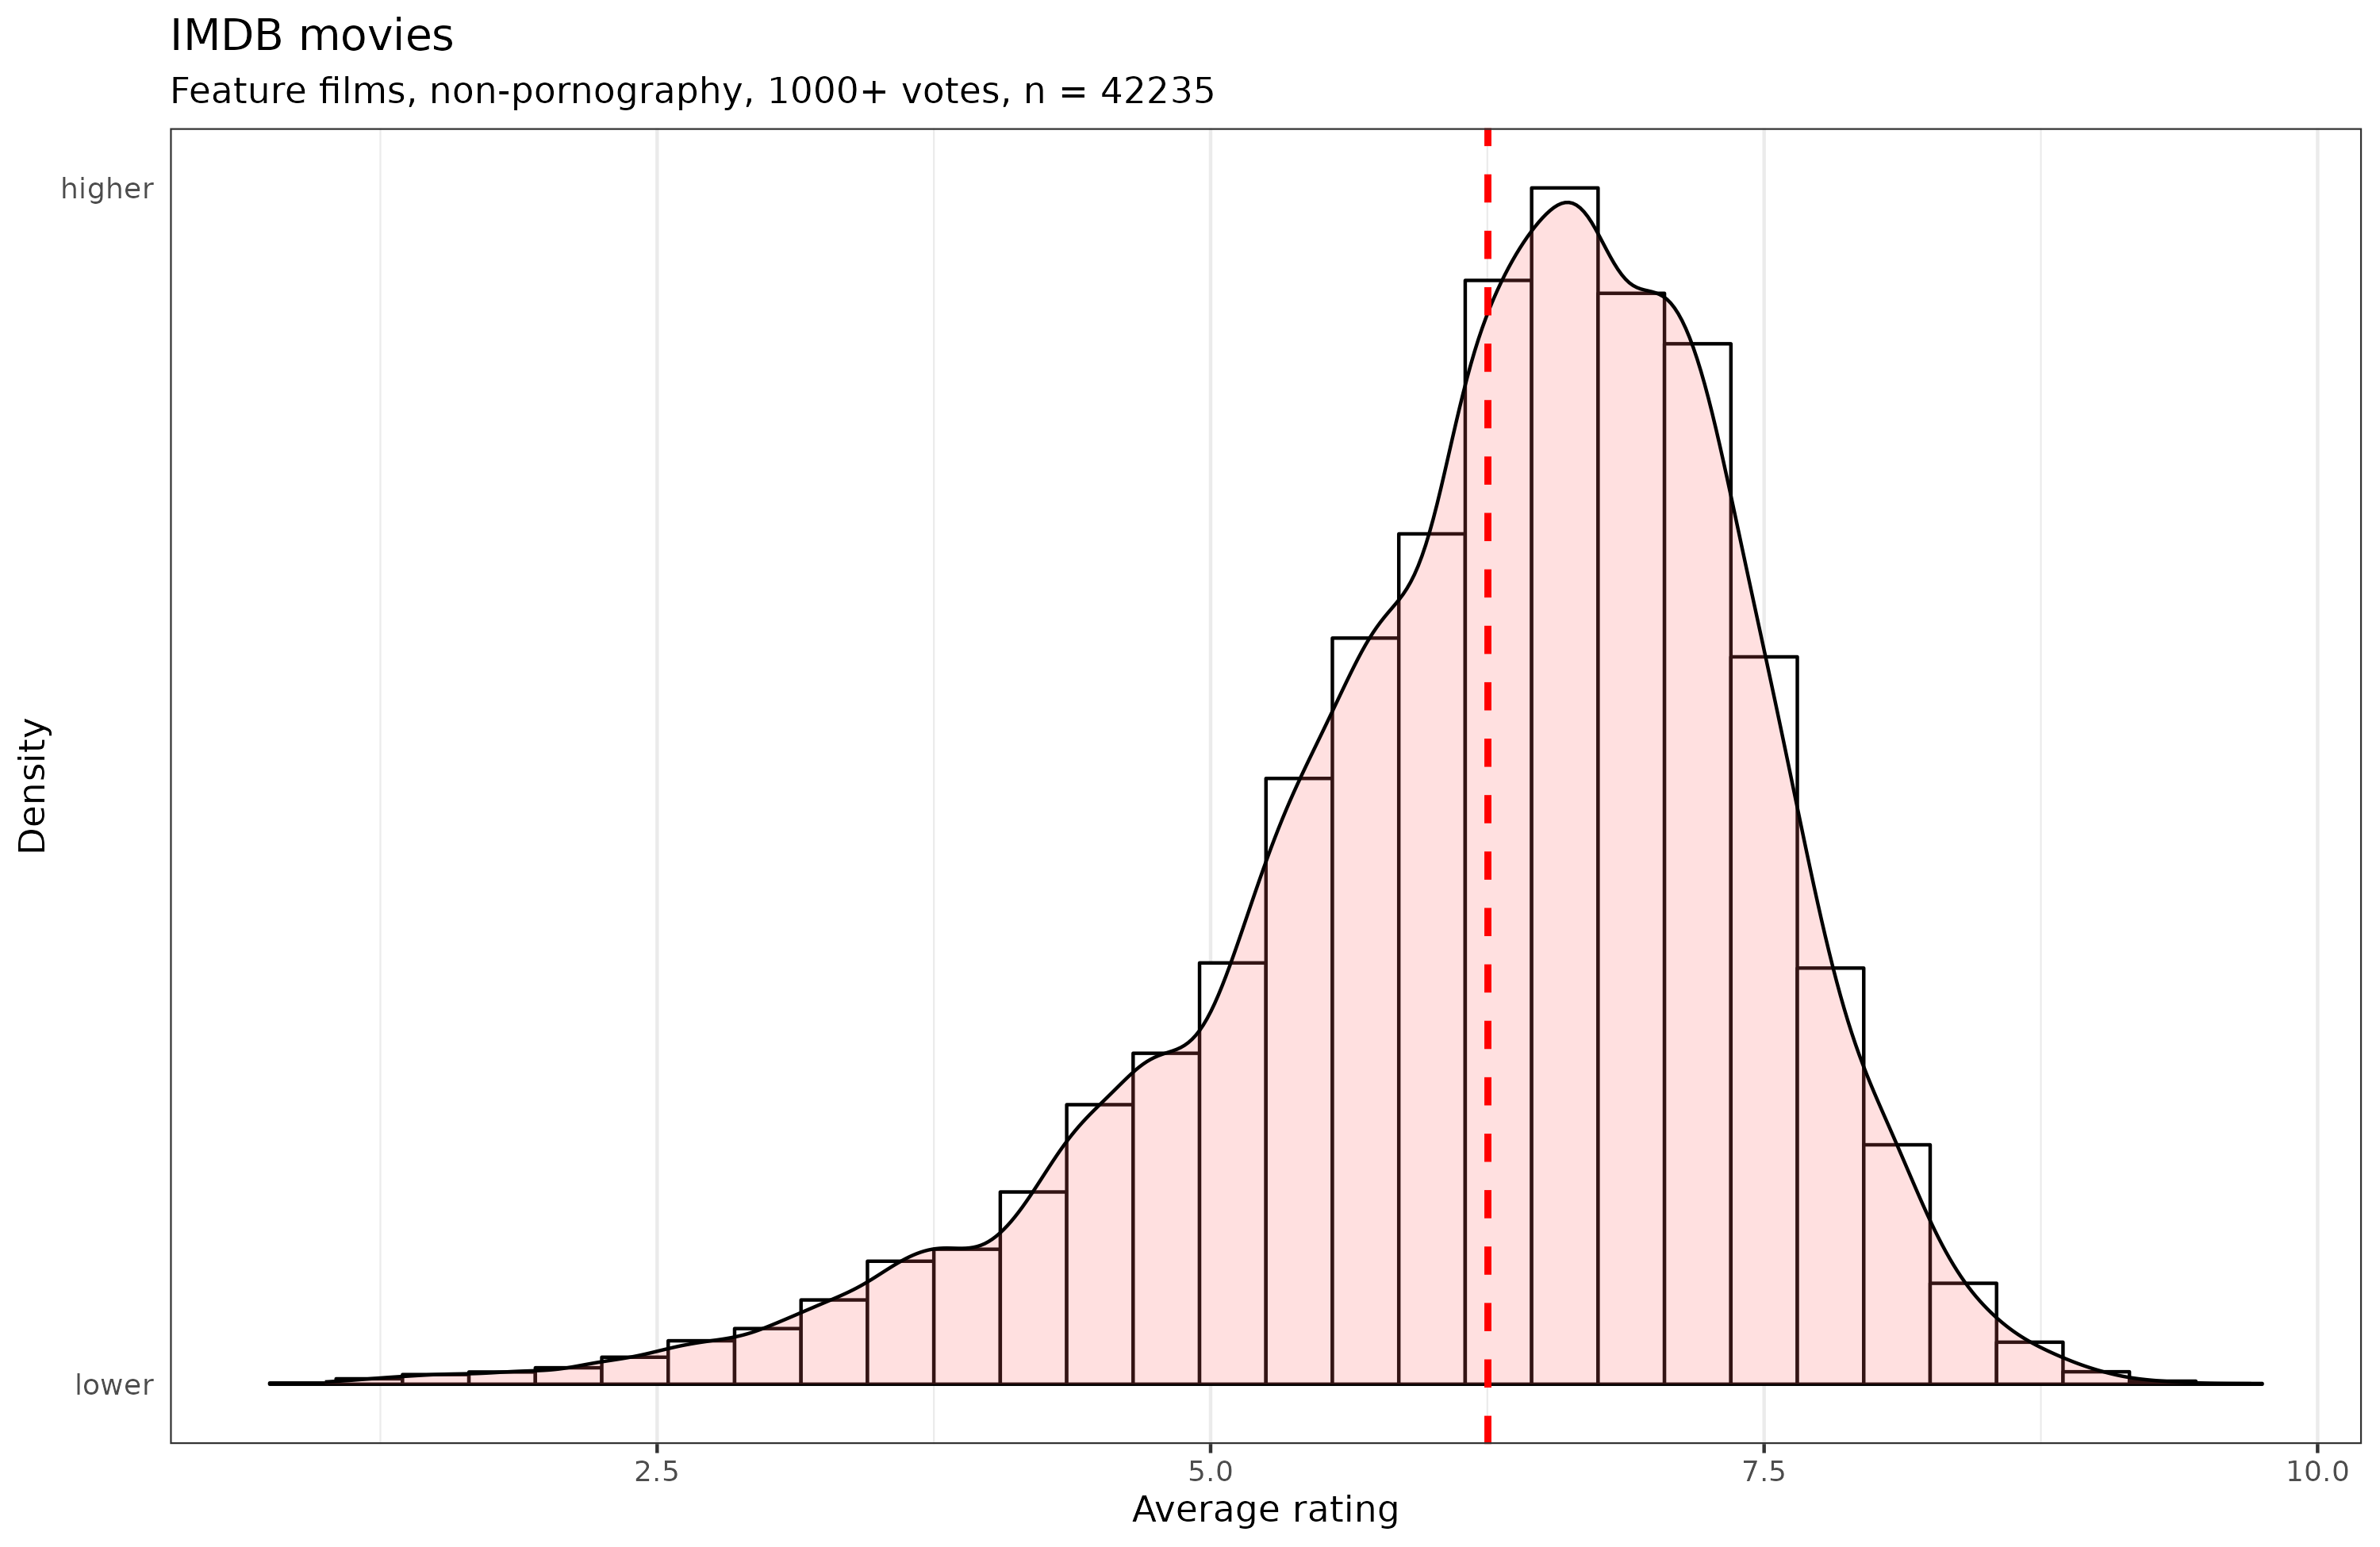
This isn’t entirely perfect because a bunch of poor, foreign movies have been rating boosted to the top. They are hard to filter out since the dataset doesn’t have country of origin or language, so that we can filter out the most cheating countries (primarily India). Still, we are reasonably happy with this subset of 42k films. Here’s the descriptive statistics:

The mean rating is 6.25, median is 6.4, standard deviation is 1.18, and MAD is 1.04. Since the distribution isn’t entirely normal, these can be misleading. A good rule of thumb, then, would be that anything above about 7.5 is good, roughly the top 10%.
Next up, we might wonder what predicts a good movie. We can do this two ways. We can look at various predictors one at a time. This tells us how good of a clue a single piece of information is by itself. Or we can look at their joint effects, i.e., the effect of a given clue holding the others constant. Let’s look at the individual clues first. Mainly, we have year of release, runtime, and the genres. First, though, let’s note that some genres are more popular than others:

Clearly, drama and comedy are the most popular categories (but note that movies usually have more than one category).
The singular effects of these clues alone looks like this, expressed in correlations:

(I used latent correlations for the binary variables.)
We see the familiar ‘documentary effect’. Maybe documentaries really just are better movies but I regard it as a rating bias. Horror movies suck, and so apparently do sci-fi movies, which is hard to believe (maybe because a lot of them are very poorly made). We also see that length (runtime) of a movie is an alright clue, longer is better (r = 0.26), and newer is worse (year; r = -0.18).
However, because the movie quality predictors are correlated with each other (e.g. historical movies are longer, horror movies are shorter), we might try to find their marginal effects. Here it gets a little complicated because we must assume a form of the relationship for the continuous variables (runtime and year of release). Since we have a massive dataset, we can afford to be agnostic and give them spline functions. Spline functions capture nonlinear effects, and are thus hard to interpret based on the coefficients. However, so we can begin with the strictly linear effects, which looks like this:

Useful here is that we also get the confidence intervals, which I was too lazy to add above. They are very small except for category = “News”.
Sorting the values turned out to be difficult using plot_coefs() so we have to make do with the unsorted. Nevertheless, we see that the effects are rather similar before and after. There’s still a positive effect of runtime and negative of year, and documentaries are highly rated, more than 1 extra point holding the other things constant.
The effect of year of release is interesting. We see there’s a decline, that’s what the negative value means, but is it really linear? We can fit the model again with a spline model to see:
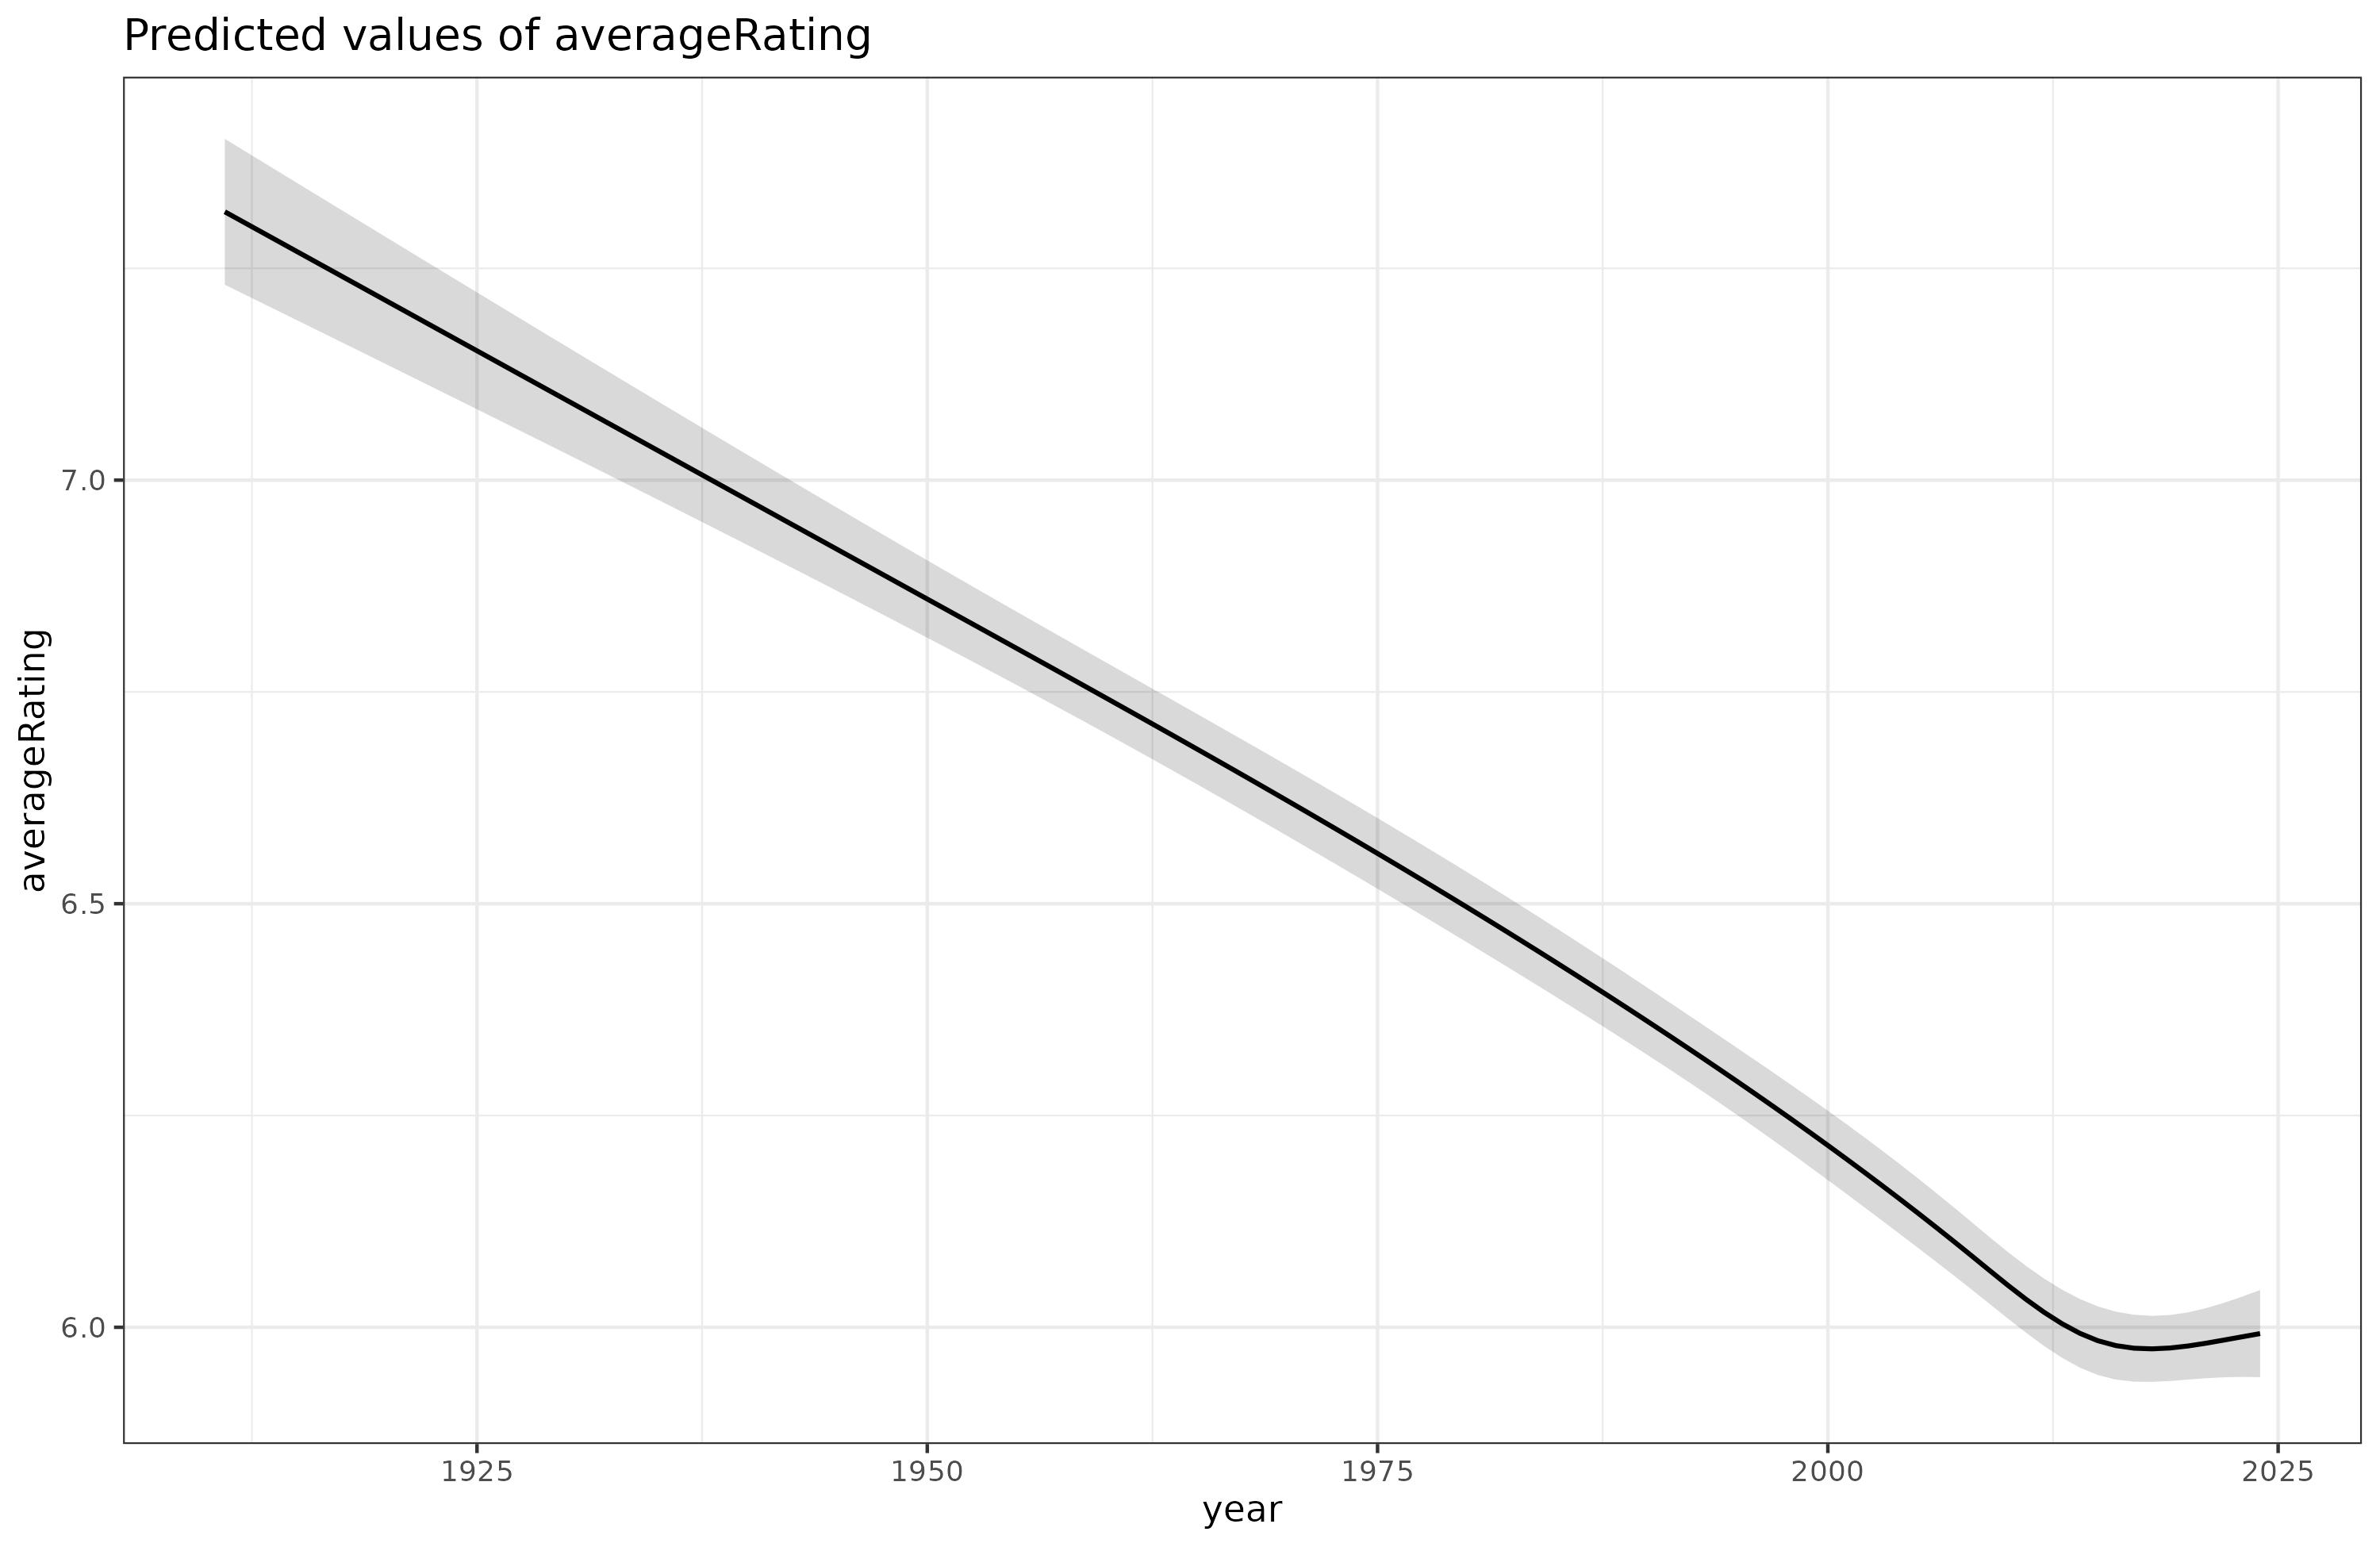
The decline does appear to be pretty linear except for the last few years. We have an idea about that. We know that recent movies are overrated on IMDB because fans go see them the first, and only later are they watched by average Joe (recency bias). We can figure out how this works by adding dummies for the most recent years on top of the linear model. Doing so, we get this result:
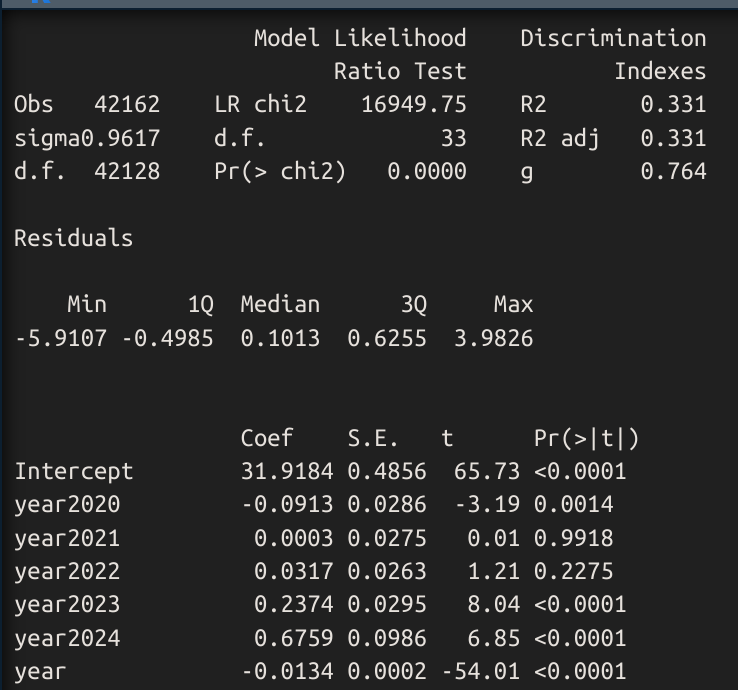
If IMDB had given us the individual votes and their time of voting, we could have more easily figured out the size of this bias by plotting a movie’s rating over time since release. We could still do this if we downloaded the IMDB dataset every month so we can follow the trajectory of all the movies over time. But I can’t do that just now, so we have to make do with this indirect method. What we see is that after taking into account the general decline — every year movies decline by 0.0134 rating — we see that being released in the current year (actually last 2 months) has a positive value of 0.68, and last year has a value of 0.24. These are plausibly taken as the biasing effects of fans voting first. The values for 2022 and 2021 are not beyond chance, and I don’t know why 2020 is slightly negative, but maybe some Wokeness effect.
Anyway, taking all this into account, we can now adjust the observed scores for recent movies using these values. Doing so means that Dune part 2 will decline from 9.0 to 8.3. 8.3 is still a solid rating:

Thus, we project that Dune 2 will decline from 0.999 quantile to merely 0.990, the top 1%.
My own ratings
Just out of curiosity, I downloaded my own ratings. In theory, one could build a prediction (recommendation) engine for movies this way, by training on the movies I watched and rated, and predict which ones I haven’t rated that I would like. First, we can check my ratings vs. IMDB average:

My agreement with IMDB is reasonably strong, r = .58, based on 847 ratings. The dotted line shows the line of perfect calibration, i.e., whether we can expect an 1 point increase in IMDB rating to predict an 1 point increase in Emil rating. It’s not entirely perfectly calibrated, but close enough.
We might also look at the cultural decline in movie qualities seen from my eyes:

And we see it here too, but it’s not so linear. Presumably this is because I tend to watch newer movies more at whim, and don’t watch random old movies. In other words, selection bias. Finally, we could attempt a prediction of movies I should see:

In fact, these are terrible suggestions since most of these are inflated Indian Turkish etc. movies. (That Godfather from 1991 is Indian too.) These prediction errors come from the fact that the model can only predict my preferences with r = 0.66, and it doesn’t know about which movies are Indian etc.
Conclusions
- Adjustment for recency bias turns out to be fairly simple. Subtract 0.67 for movies from current year, and 0.23 from last year. These values are based only on data from this year so far (March 4th), and will change a bit if we re-do this analysis in 6 months time. If we had publication date instead of year, we could do this with more granularity and thus precision.
- Dune part 2 is likely inflated at the current rating of 9.0, but the adjusted rating of 8.3 suggests it’s still a solid watch, about top 1%.
- There is a general decline in movie ratings over time, a kind of anti-Flynn effect. One can speculate about the many reasons for this: 1) general cultural decline, 2) making movies is cheaper so more dubious prospects get made, 3) older movies of lower quality are not given enough votes to make the inclusion criterion (>1000 votes), 4) increased proportion of poor foreign movies (though they often have inflated ratings).
- Trying to build my own recommendation engine didn’t work well because of the foreign movies with inflated ratings, which was not included in the model.
- I know, someone will complain about IMDB ratings vs. Rotten Tomatoes vs. whatever. My argument against this is:
Many more such cases could be cited: