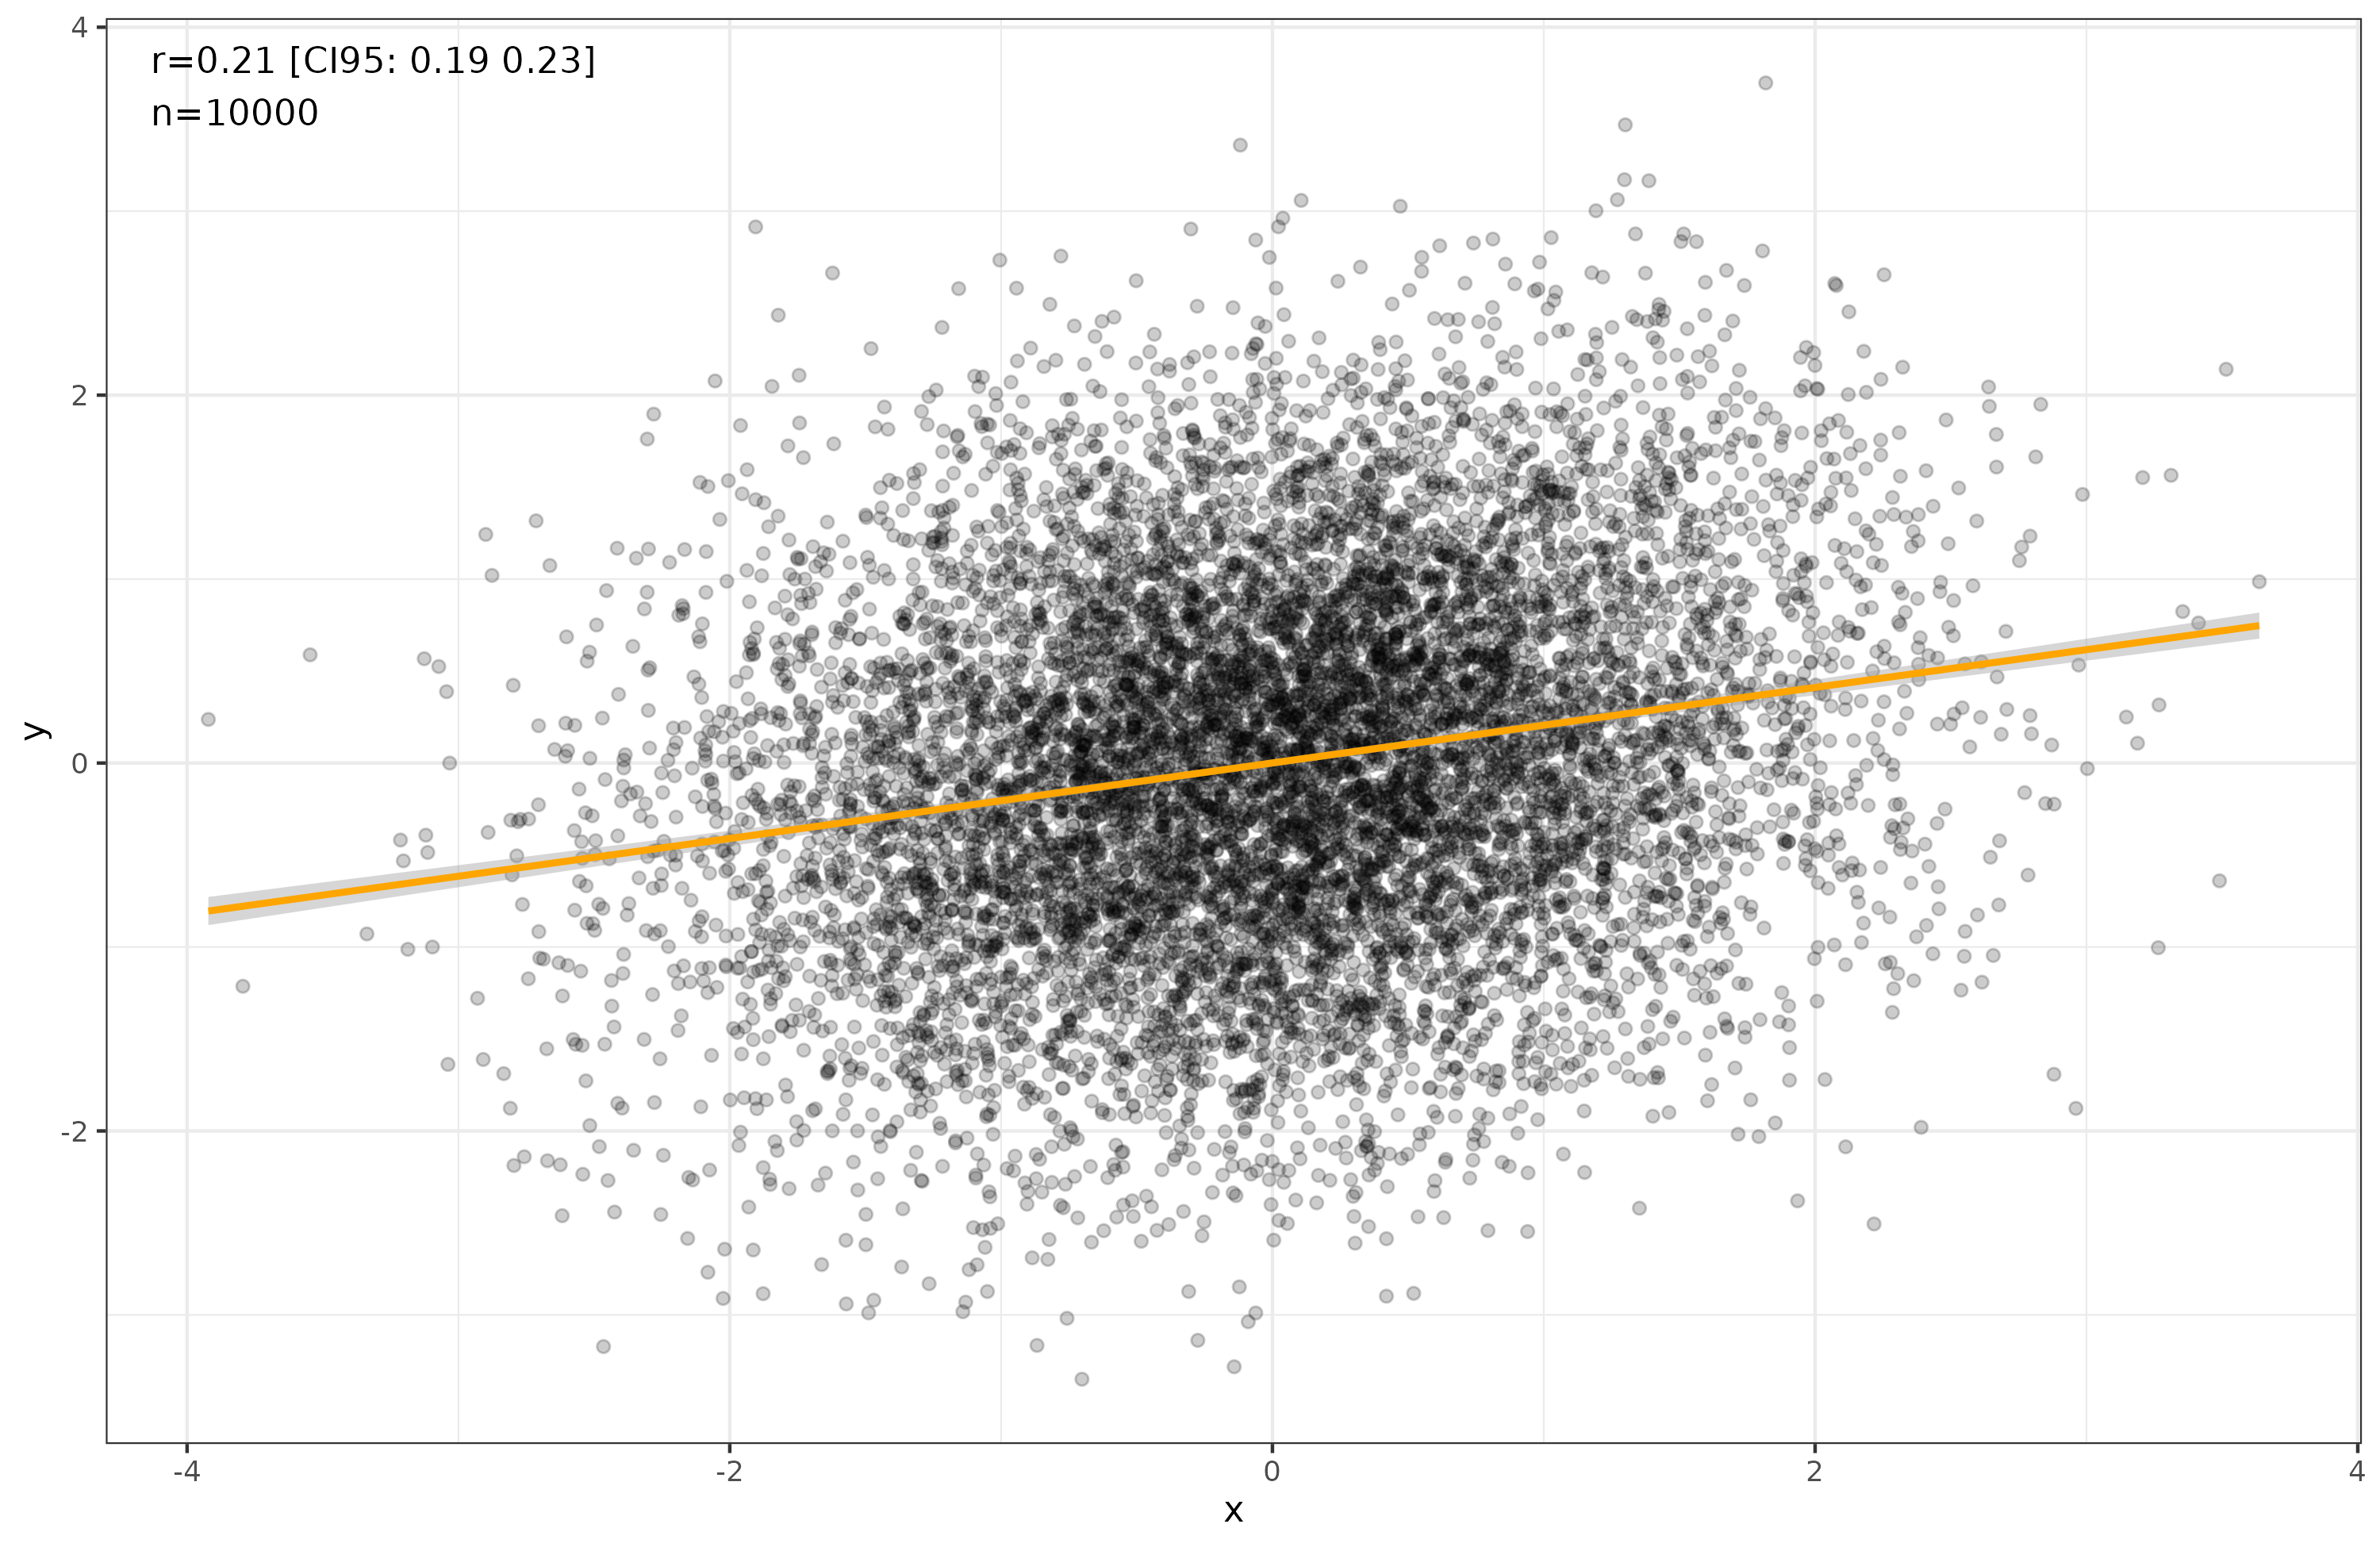
Let’s think about causality and group-level comparisons. Here I mean any type of group, whether nations, sub-national divisions (states, regions, provinces, communes), religious classifications, races, or any other grouping. Sometimes we know that one variable causes another variable when we look at individuals. Let’s say the correlation is fairly weak, r = .20. It looks like this:
If we classify cases into groups based on their values on X, we will see a near perfect group-level correlation, like this:
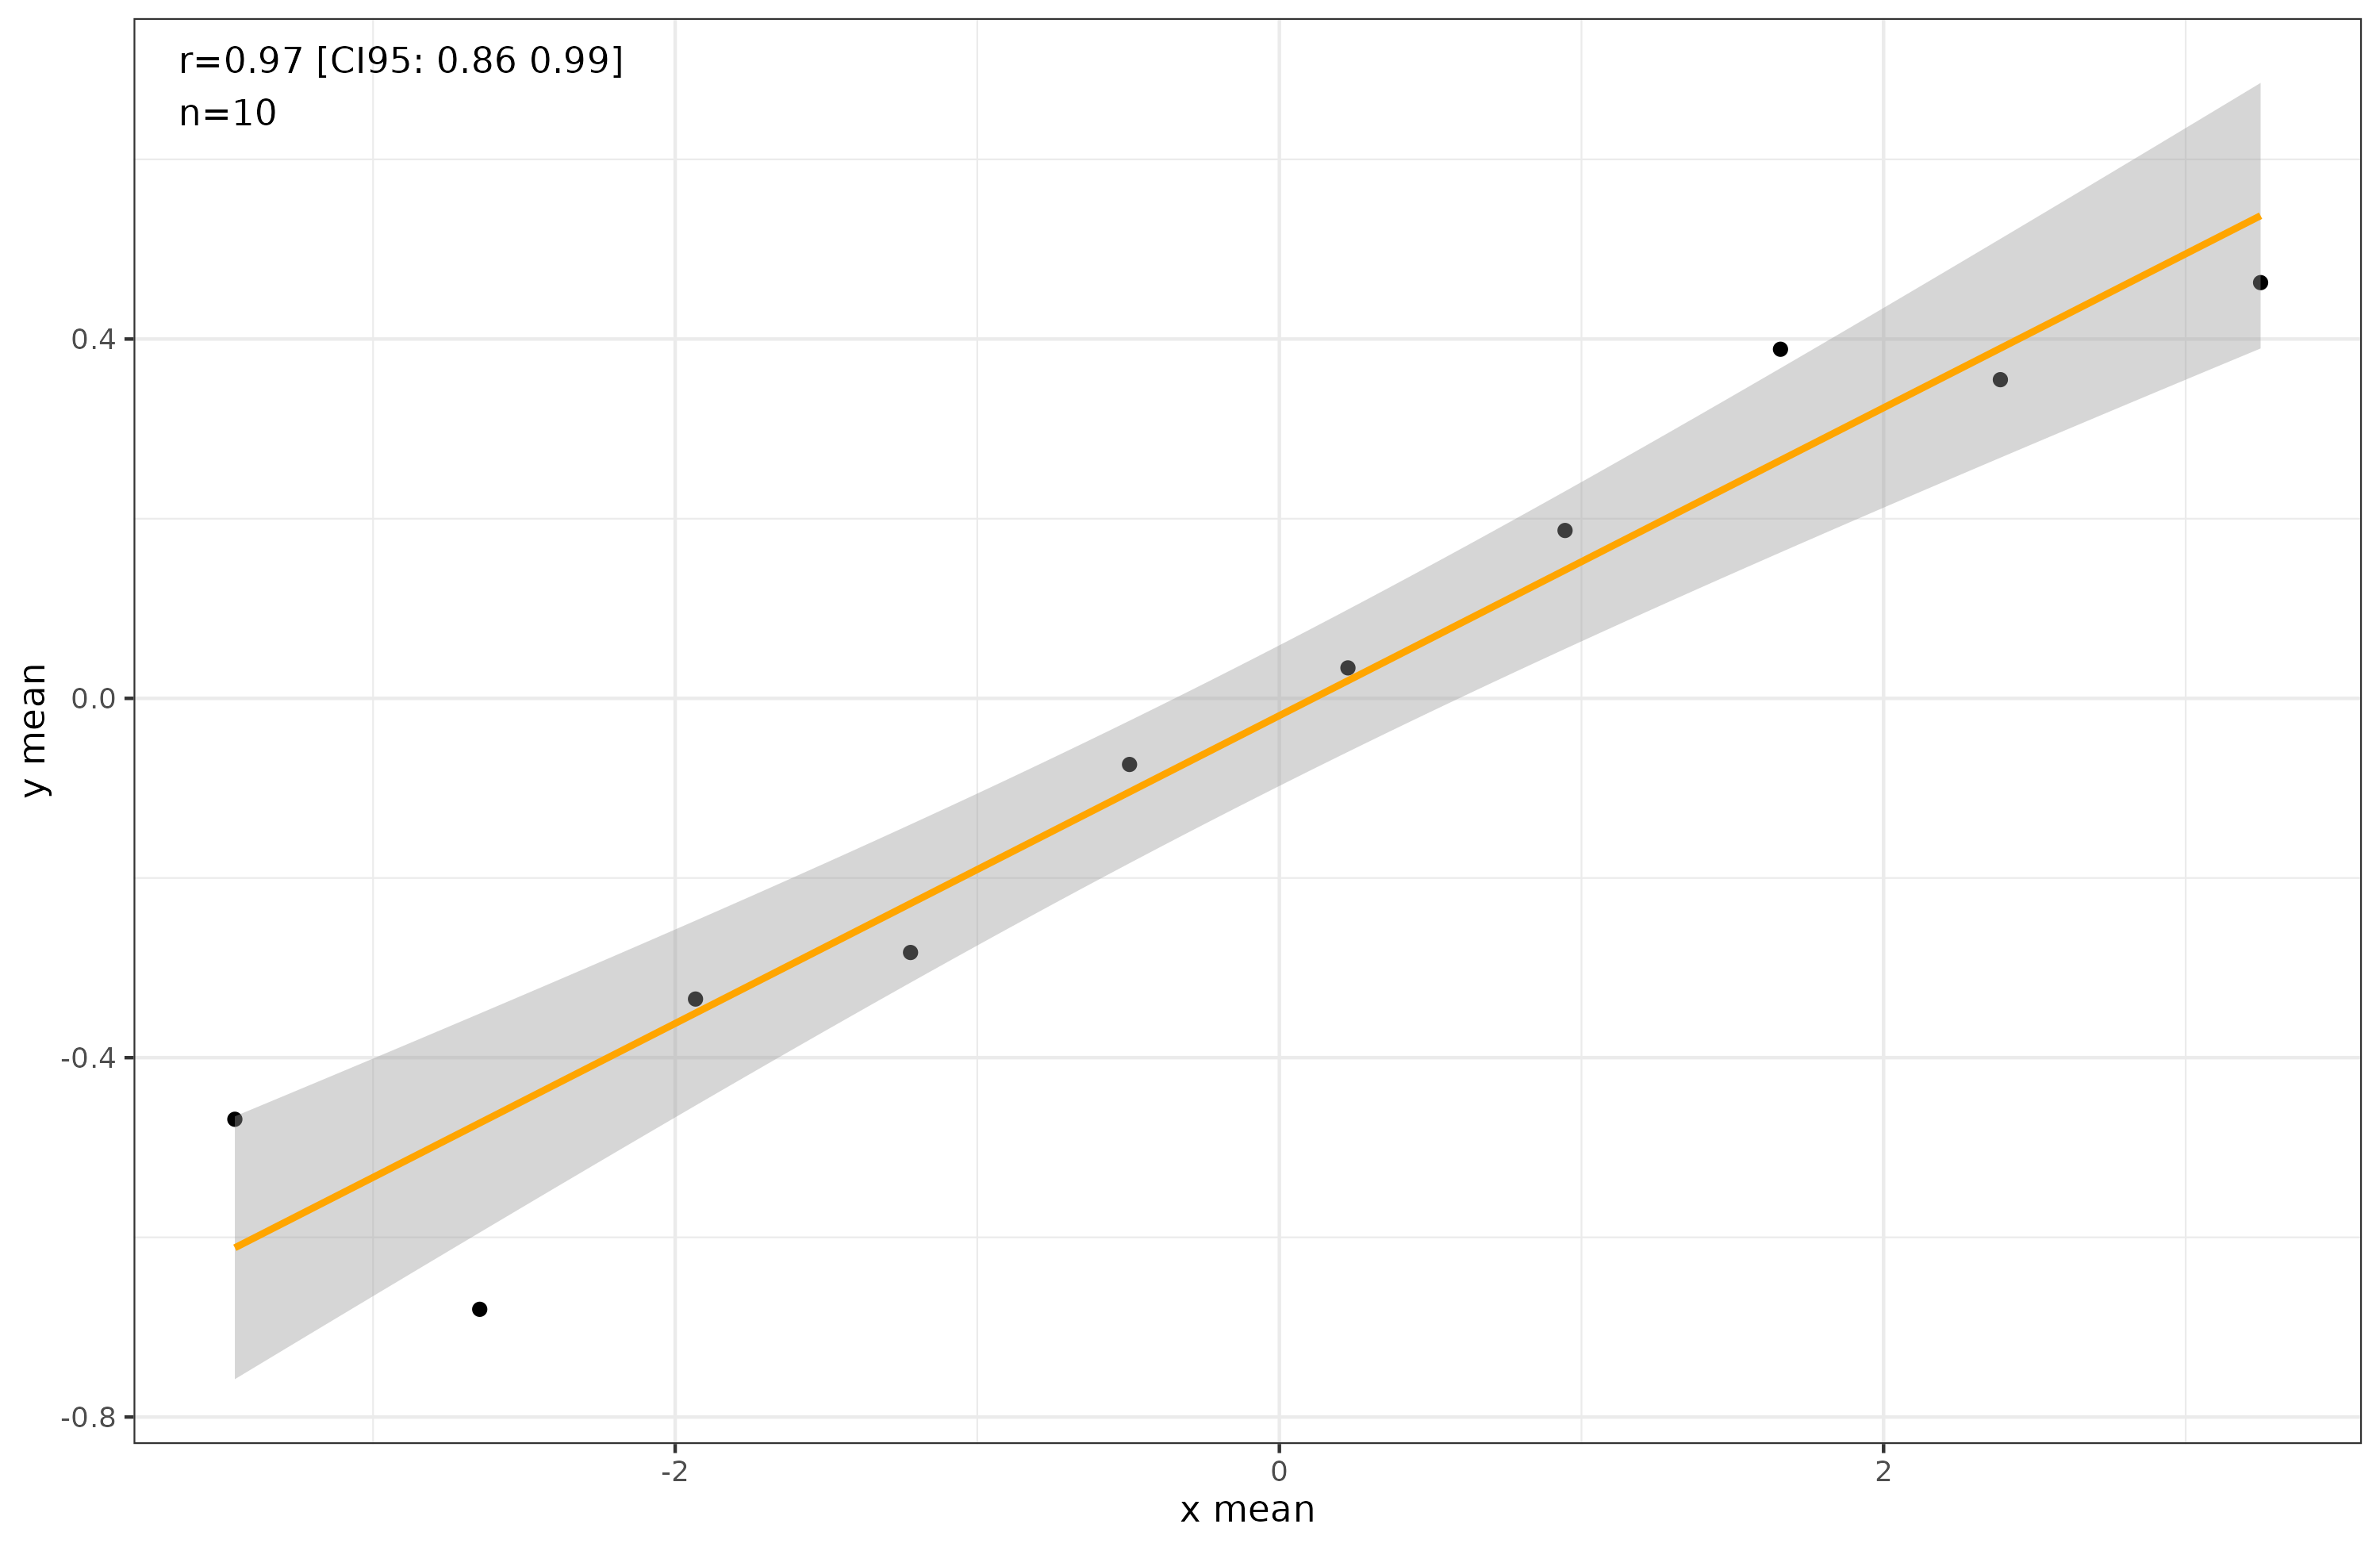
In this case, we know that at the group level, y is also caused by x because that’s the causation we stipulated. However, the correlation is now about 1, despite the causal effect size being the same. We can see this if we look at the regression slopes instead the correlation:

The regression slopes are 0.22 and 0.21, not far from the value we simulated at, 0.20. In this case, then, we can recover the effect size using grouped data.
But this doesn’t always work. Trying to infer individual level causality from grouped data is difficult, and someone will soon call you a bad reasoner for making the ecological fallacy. Famously, Simpson’s paradox is when the associations between levels of analysis are actually opposite. Years ago, I built a small simulator for this, and we can use that again here.
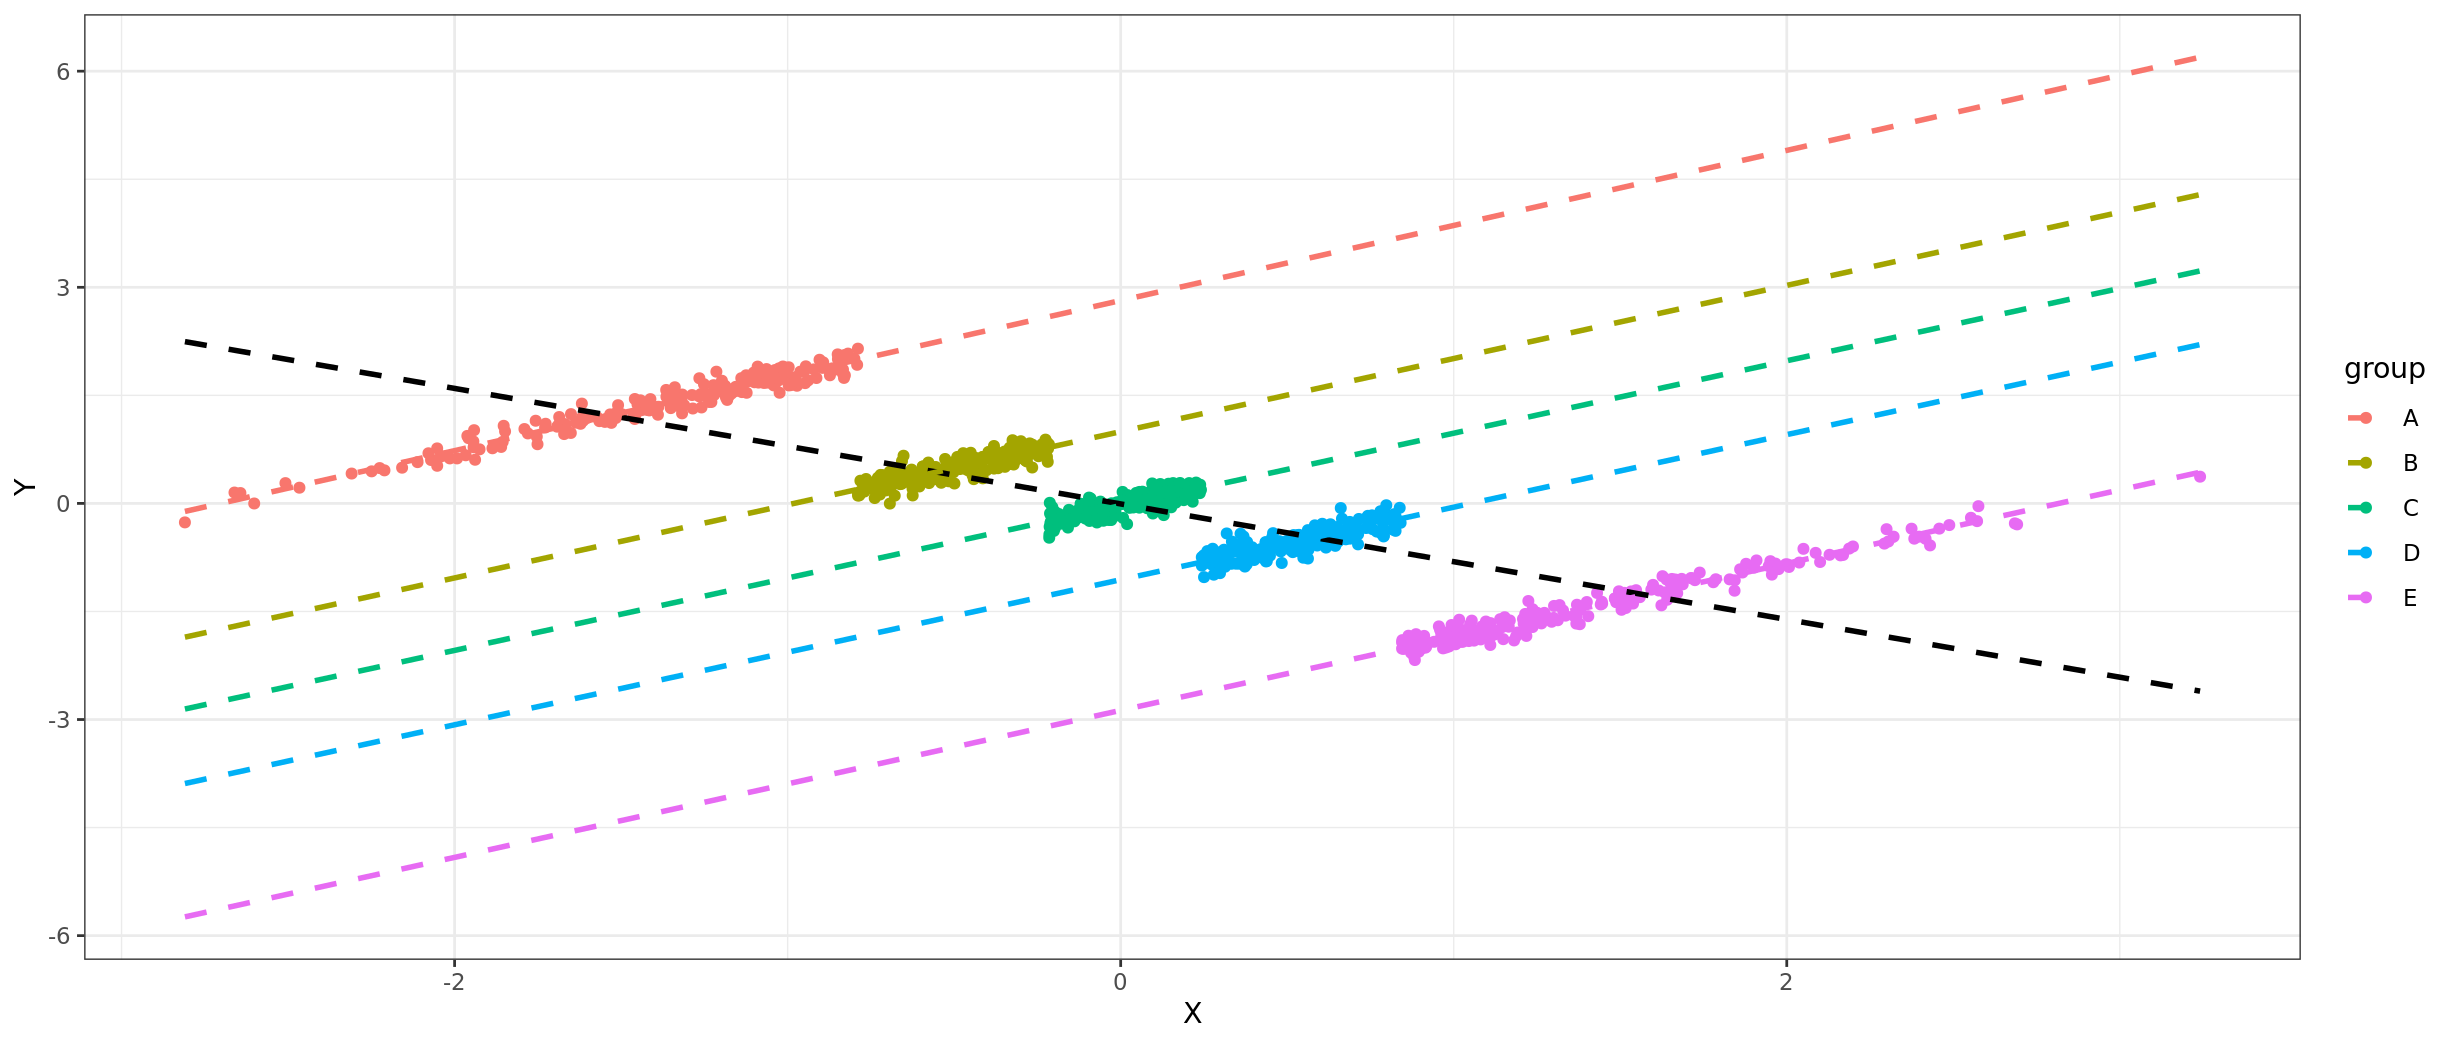
In this case, within each group, there’s a very strong positive correlation with x and y, but between groups, it’s reversed. Odd, perhaps, but does this really relate to real life? Yes, there are quite a number of such real life confusing cases. Famously, someone complained that women were being discriminated against in university applications at Berkeley:
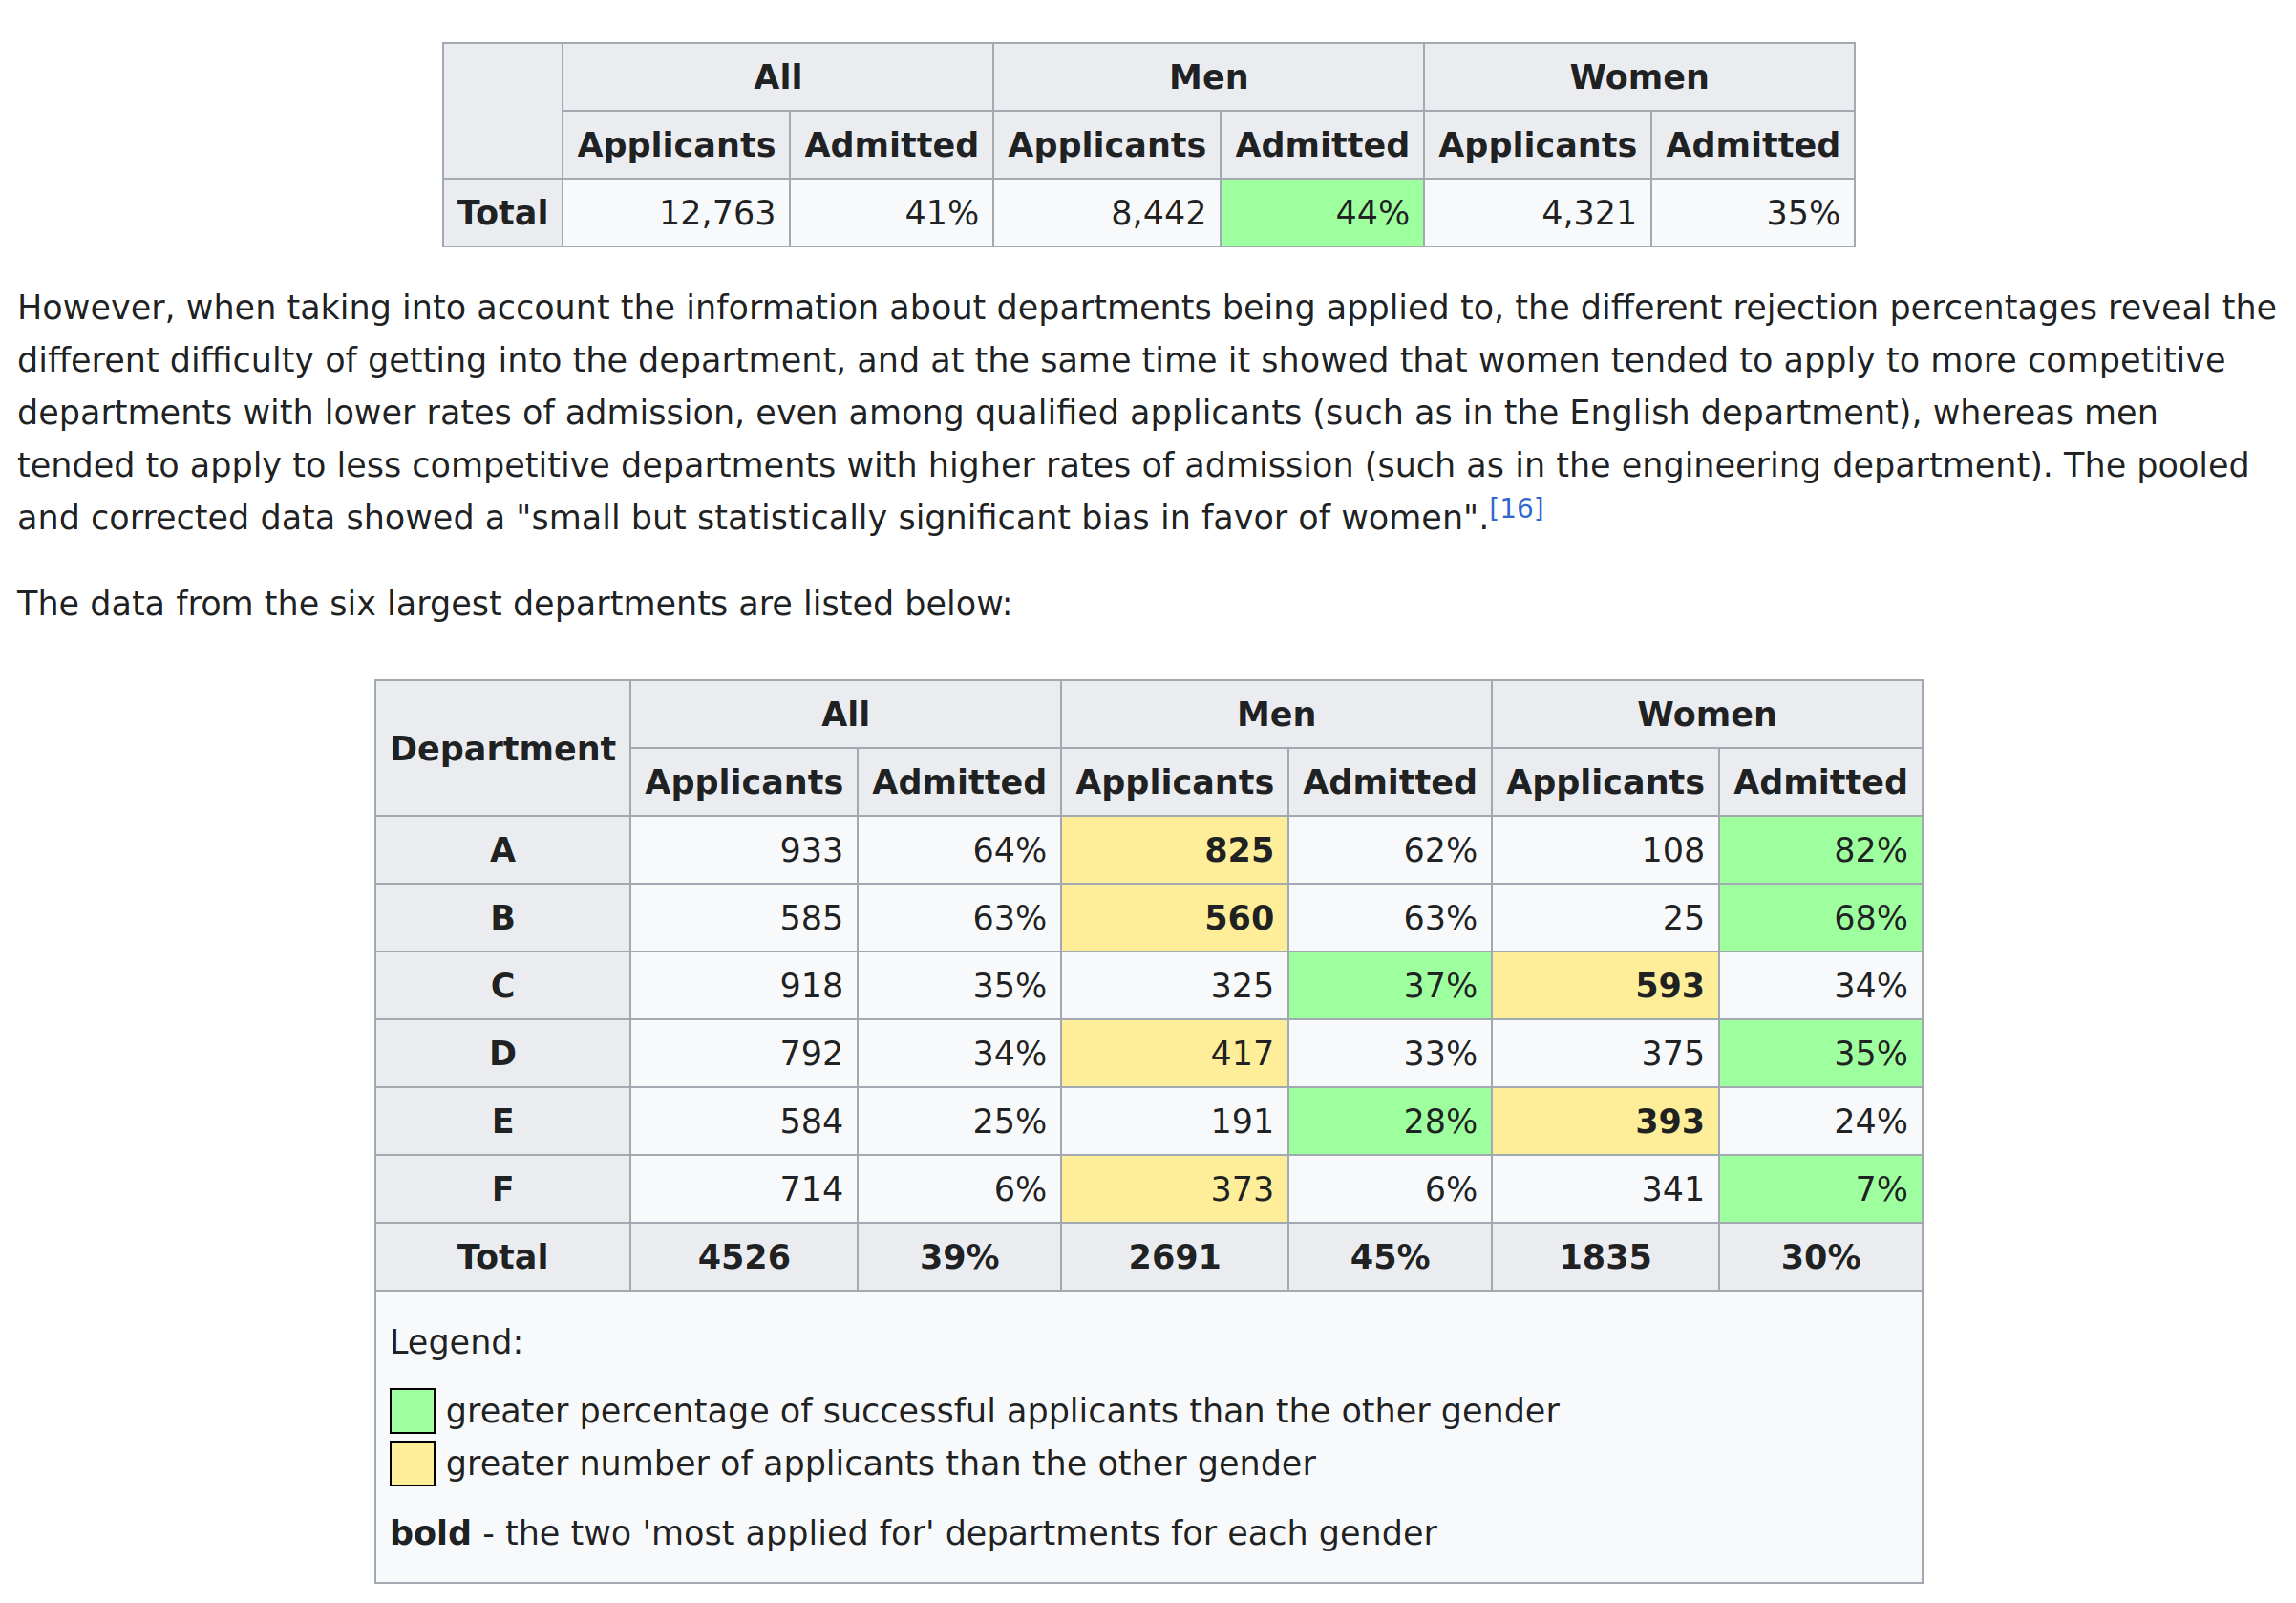
Using the grouped data, by sex alone, leads one to the false conclusion that femaleness causes lower admission rates in some maybe nefarious way, but in reality, women actually had a small advantage in admissions when looking within the fields they applied to.
In my last post on Rushton’s theory regarding developmental speed and intelligence, it was shown that earlier puberty is slightly positively related to intelligence and other good outcomes. However, between races, the pattern is negative. In some sense, the ordering of the races on timing of puberty must have another or a subset of the causes of the within race differences.
We can go on a hunt for more cases of reversals between and within groups.
Religiousness and fertility in Europe
If one uses only OECD data and squints a bit, one can find that religiousness seems negatively related to fertility rates between countries, but we also know that within population, it relates positively. I downloaded the European Social Survey data to verify this observation. Here’s the religiousness and fertility for those aged 45+ by country:
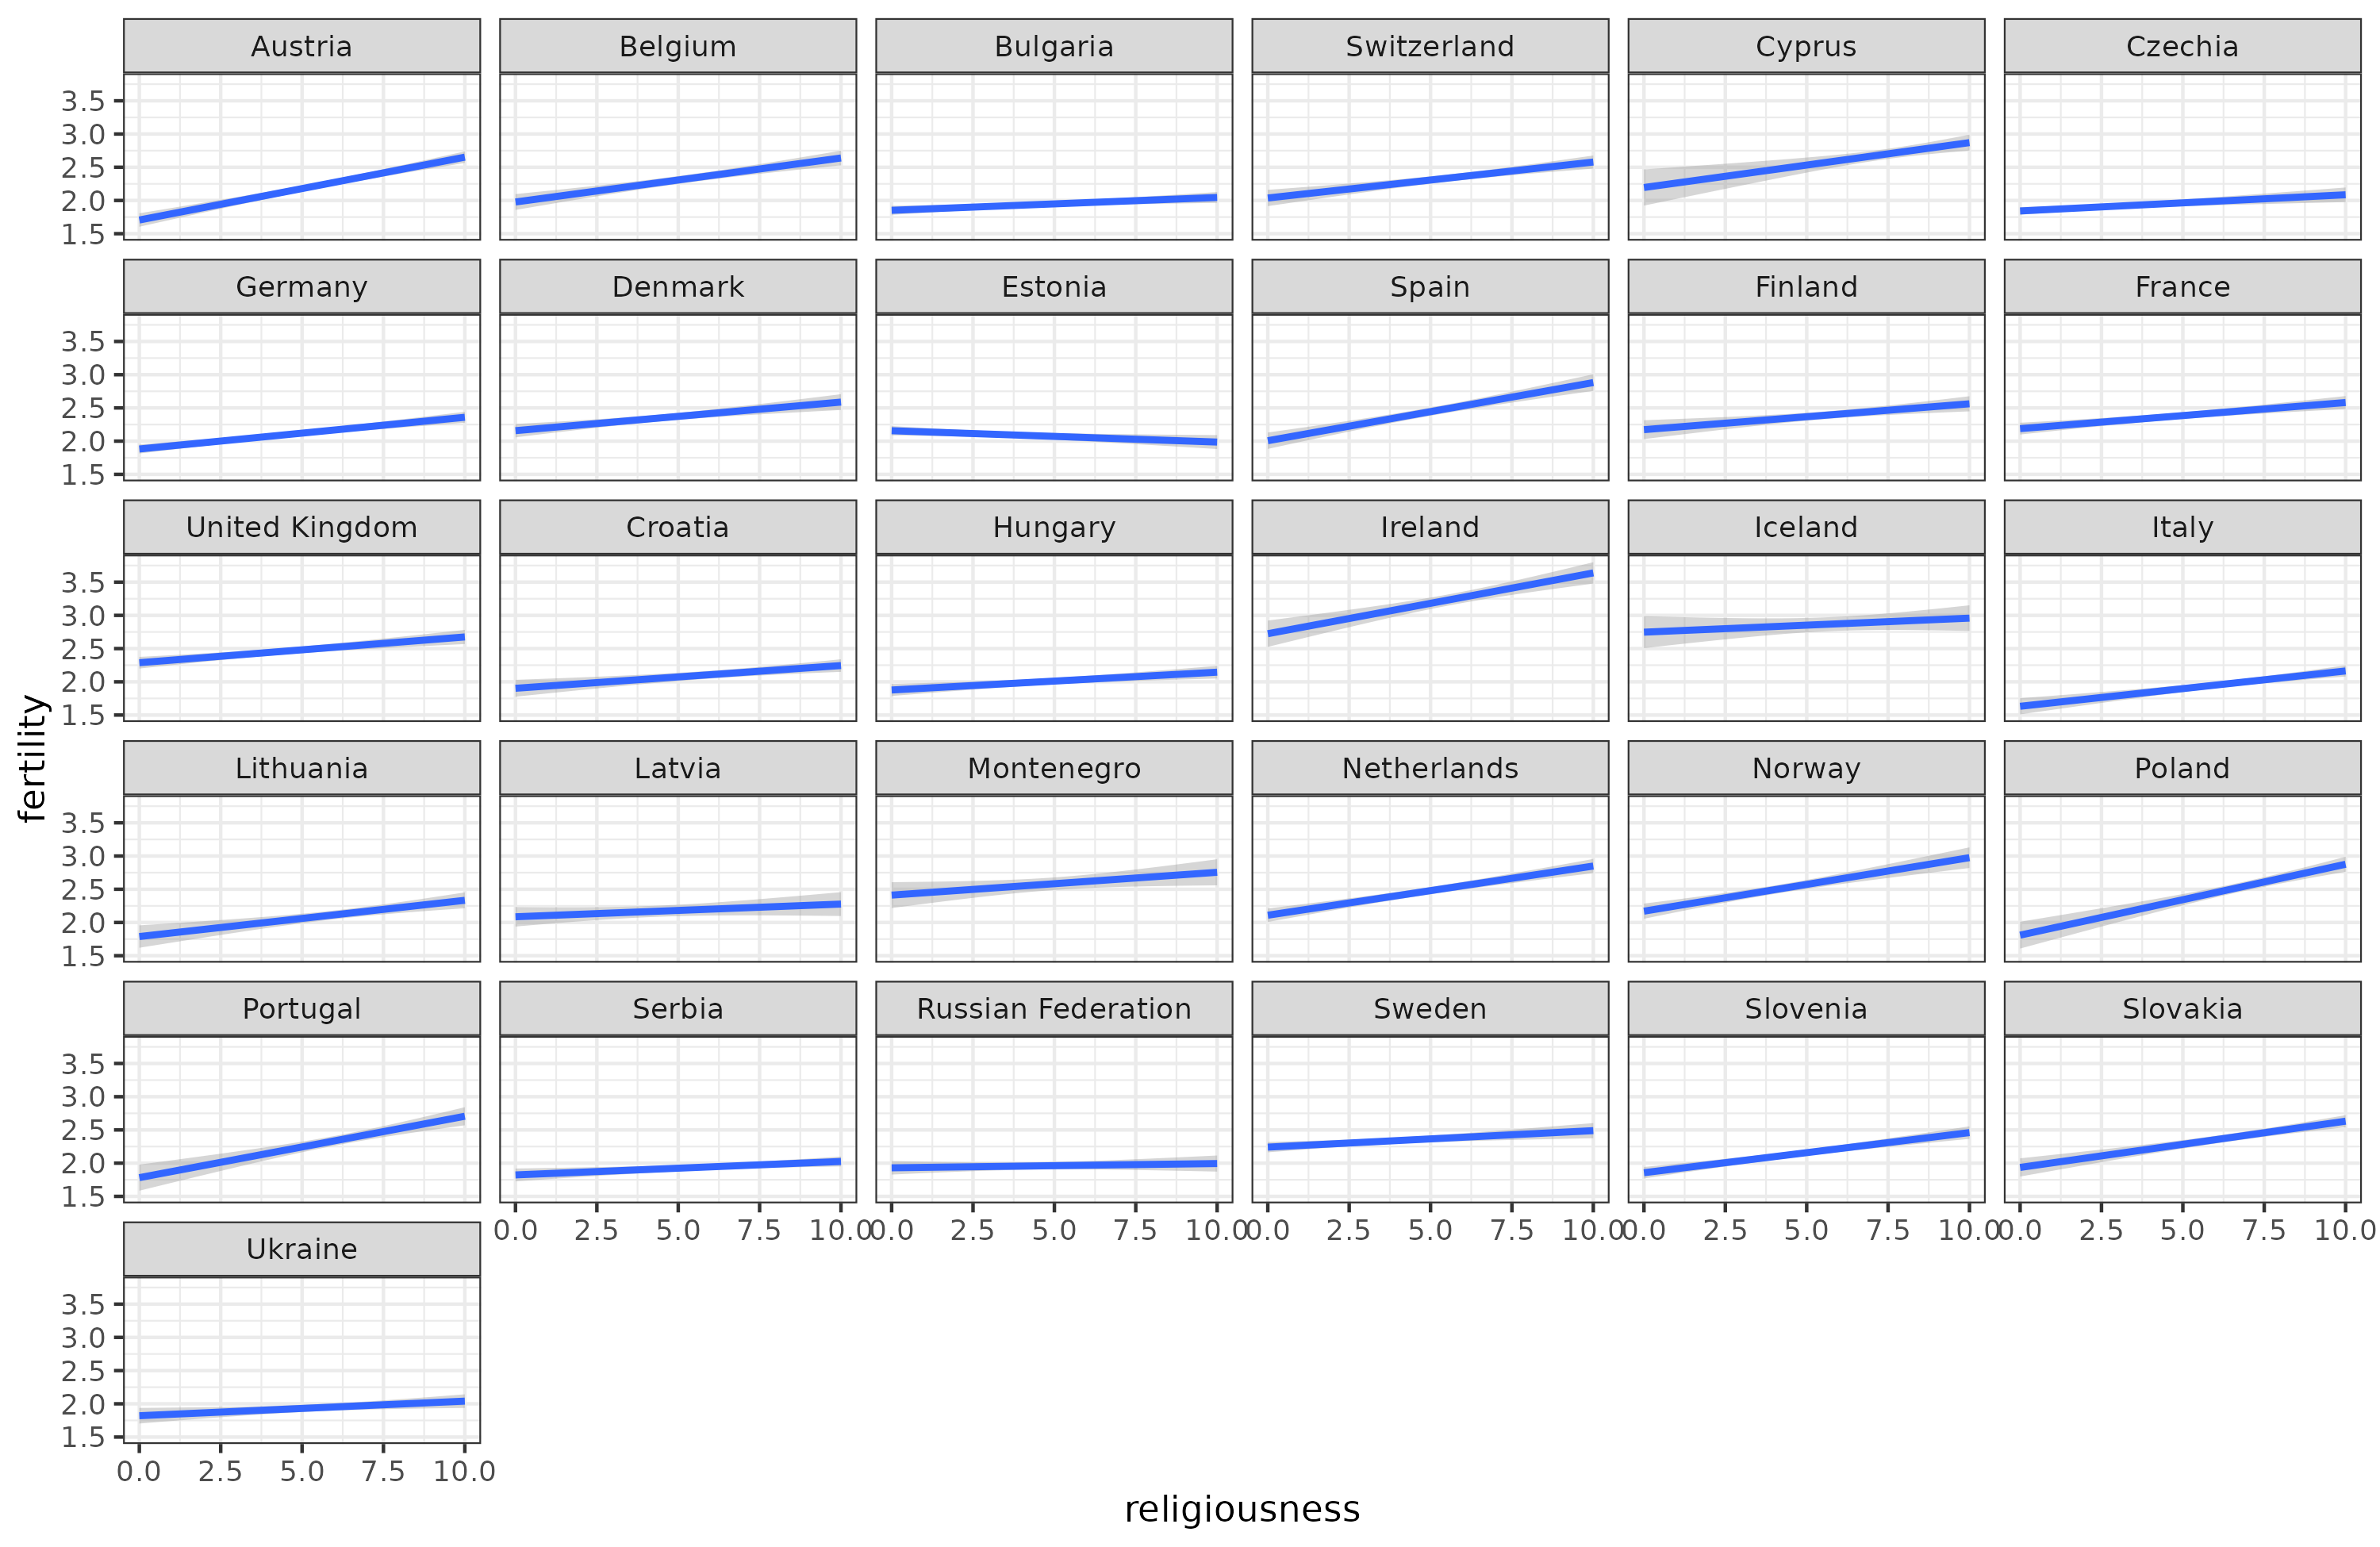
One country has a negative correlation, Estonia. My guess is that the Russian minority is more religious and less fertile. I couldn’t find fertility rates for them, but the population pyramids suggest this hunch is right:

We can also try modeling the data. We predict fertility from religiousness we find that going from 0 (not at all) to 10 (extremely) predicts an additional 0.5 children. This is true whether we just throw the data into a linear model without regarding countries at all, or whether we use a fixed effect for them, or get fancy with a multi-level model with varying slopes and intercepts.
If we plot the data at the country level, we get this result:
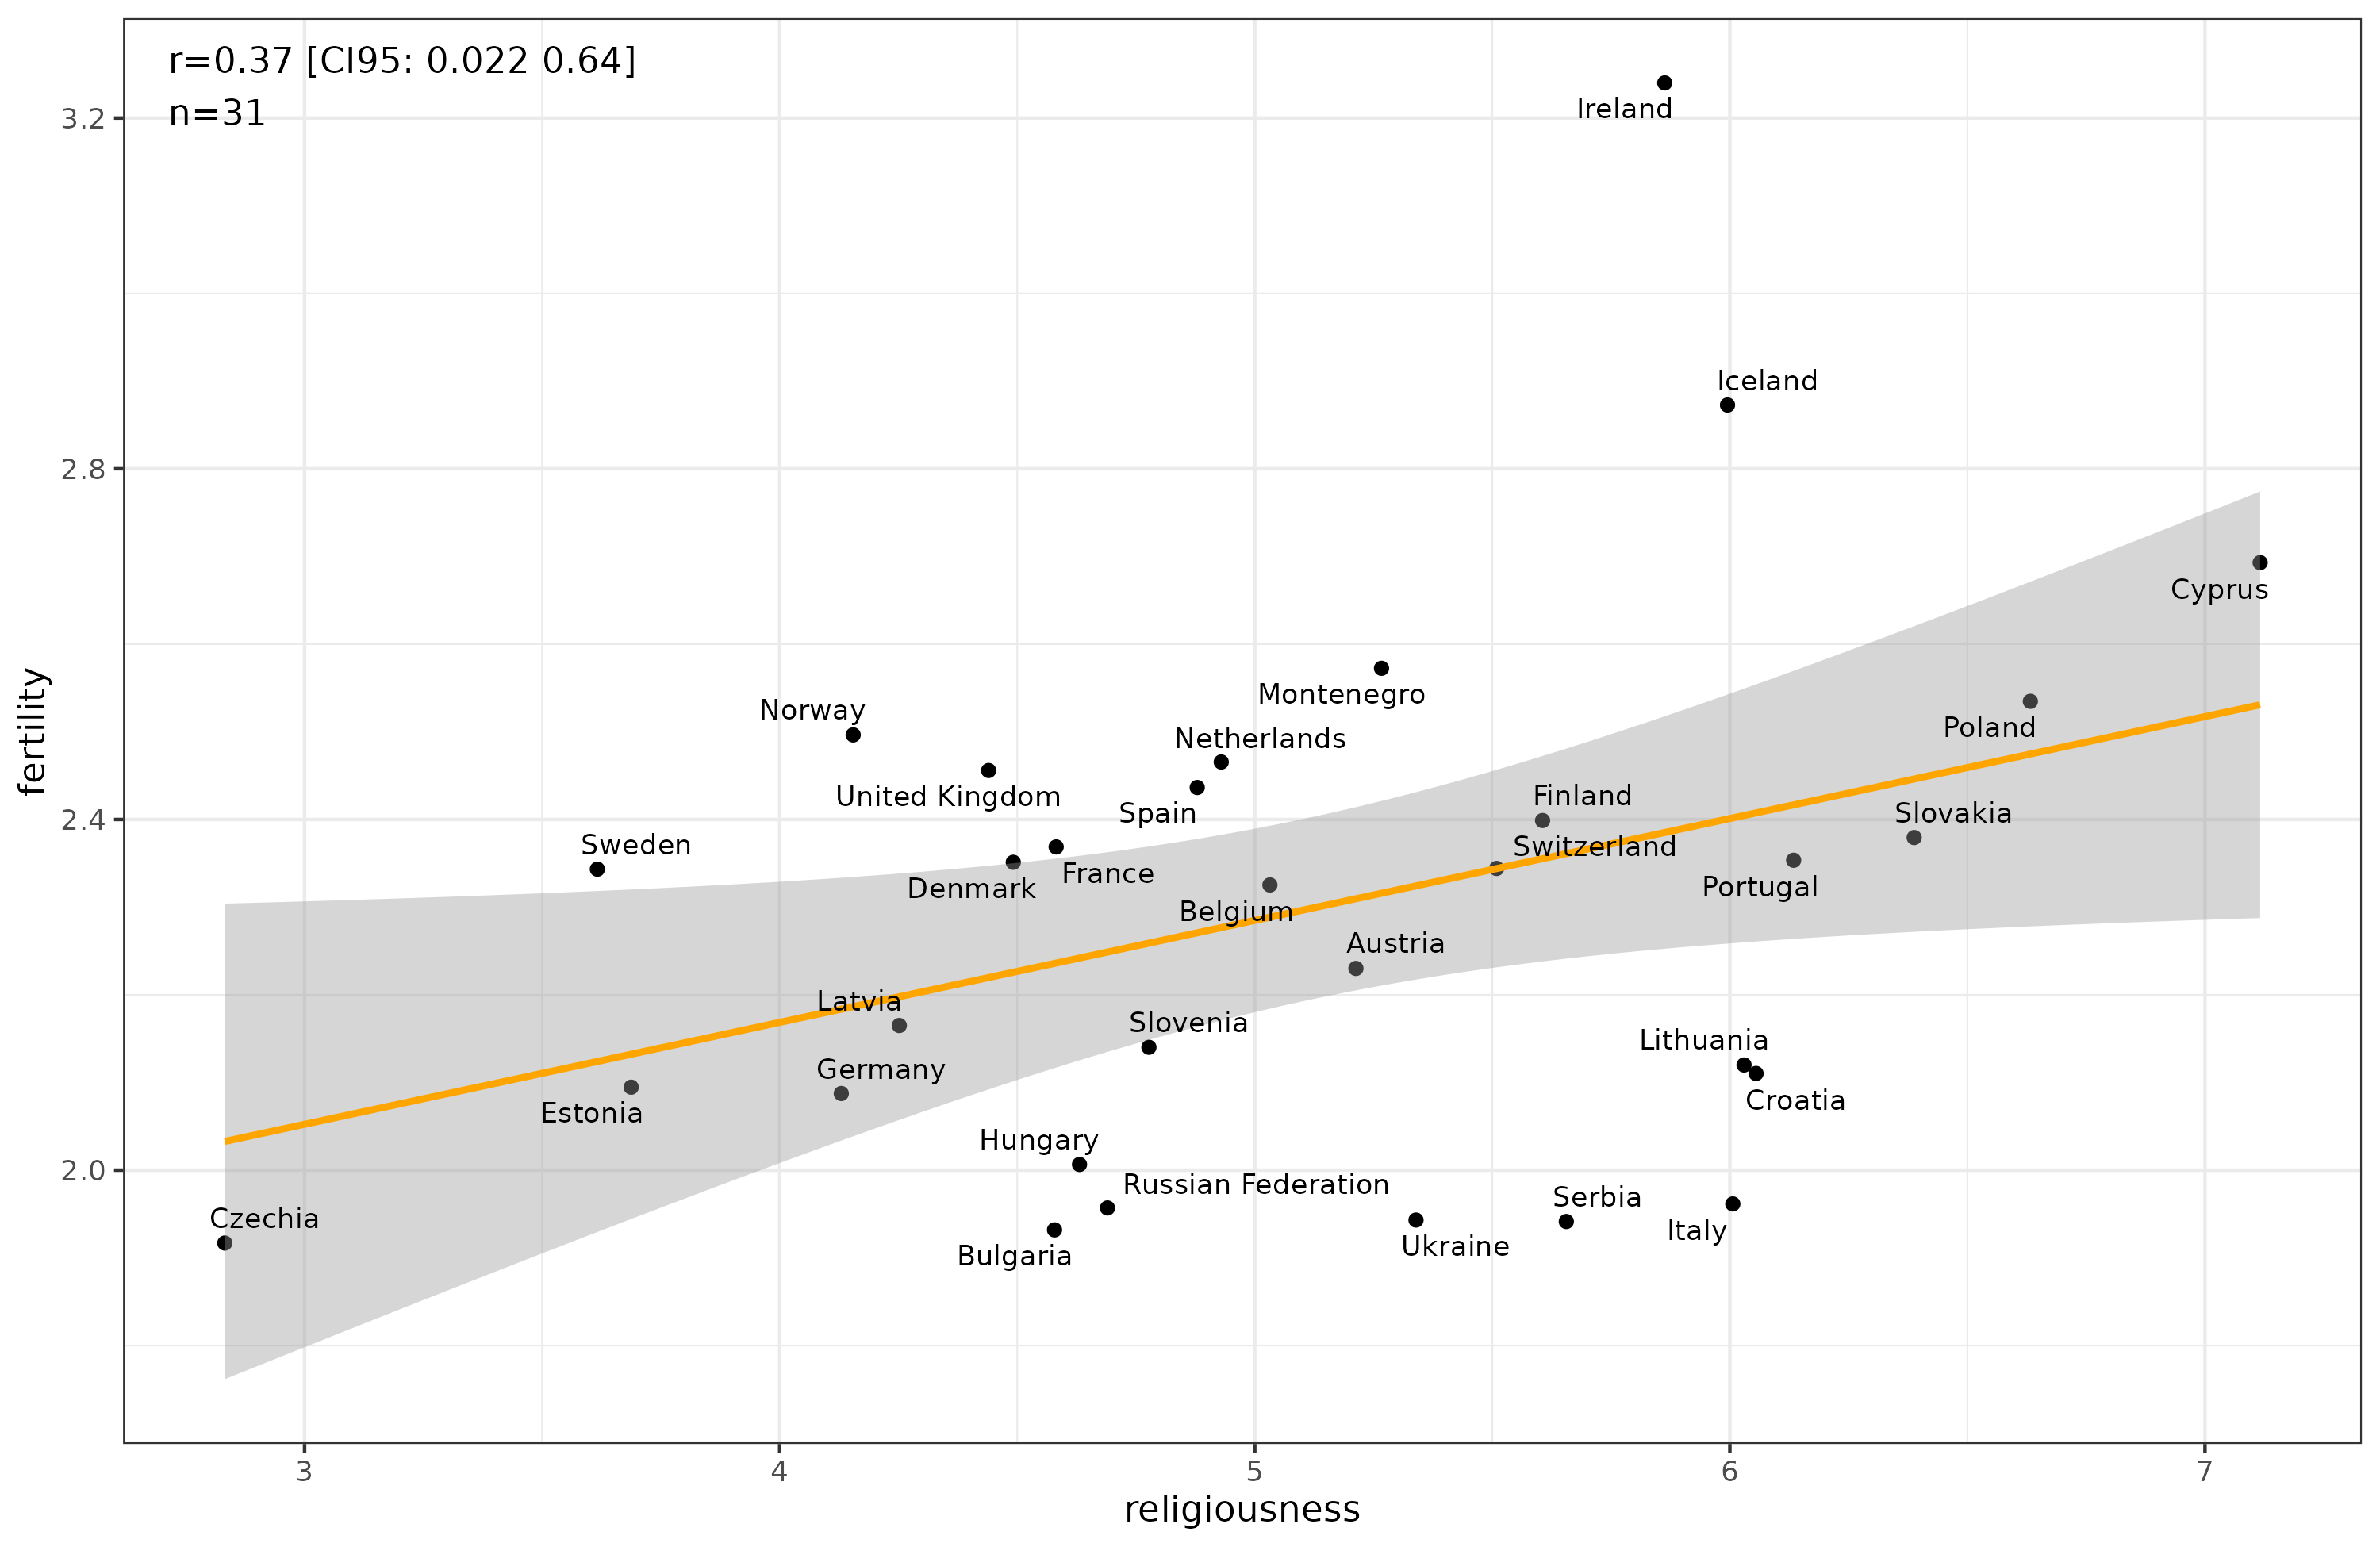
Using country-level data produces a stronger correlation (but p = .04), and with an inflated effect estimate compared to the individual level, the slope is 1.1, but we know the individual one is about 0.5. As such, there is no reversal in this case as one might expect based on the traditional understanding of atheistic fertile north Europeans vs. southern Catholic and eastern Orthodox countries.
So I got curious and I picked a bunch of plausible variables.

So there are a few of these reversals inside the European dataset (39 countries). For instance, happiness has a slight positive correlation of 0.06 with religiousness at the person level, but a -0.32 correlation between countries. Fertility and self-rated health correlate -0.10 within countries, but 0.65 between. This probably is because of the lack of age controls. For many other variable pairs, though, the associations are just much stronger at the country level. For instance, trust in the legal system correlates 0.20 with life satisfaction for persons, but 0.79 for countries.
Obesity and development
A more obvious example, perhaps, are the trends of obesity and country’s level of development, education, or intelligence. Within populations, more educated, smarter, richer people are slightly skinnier, but between countries it looks like this:
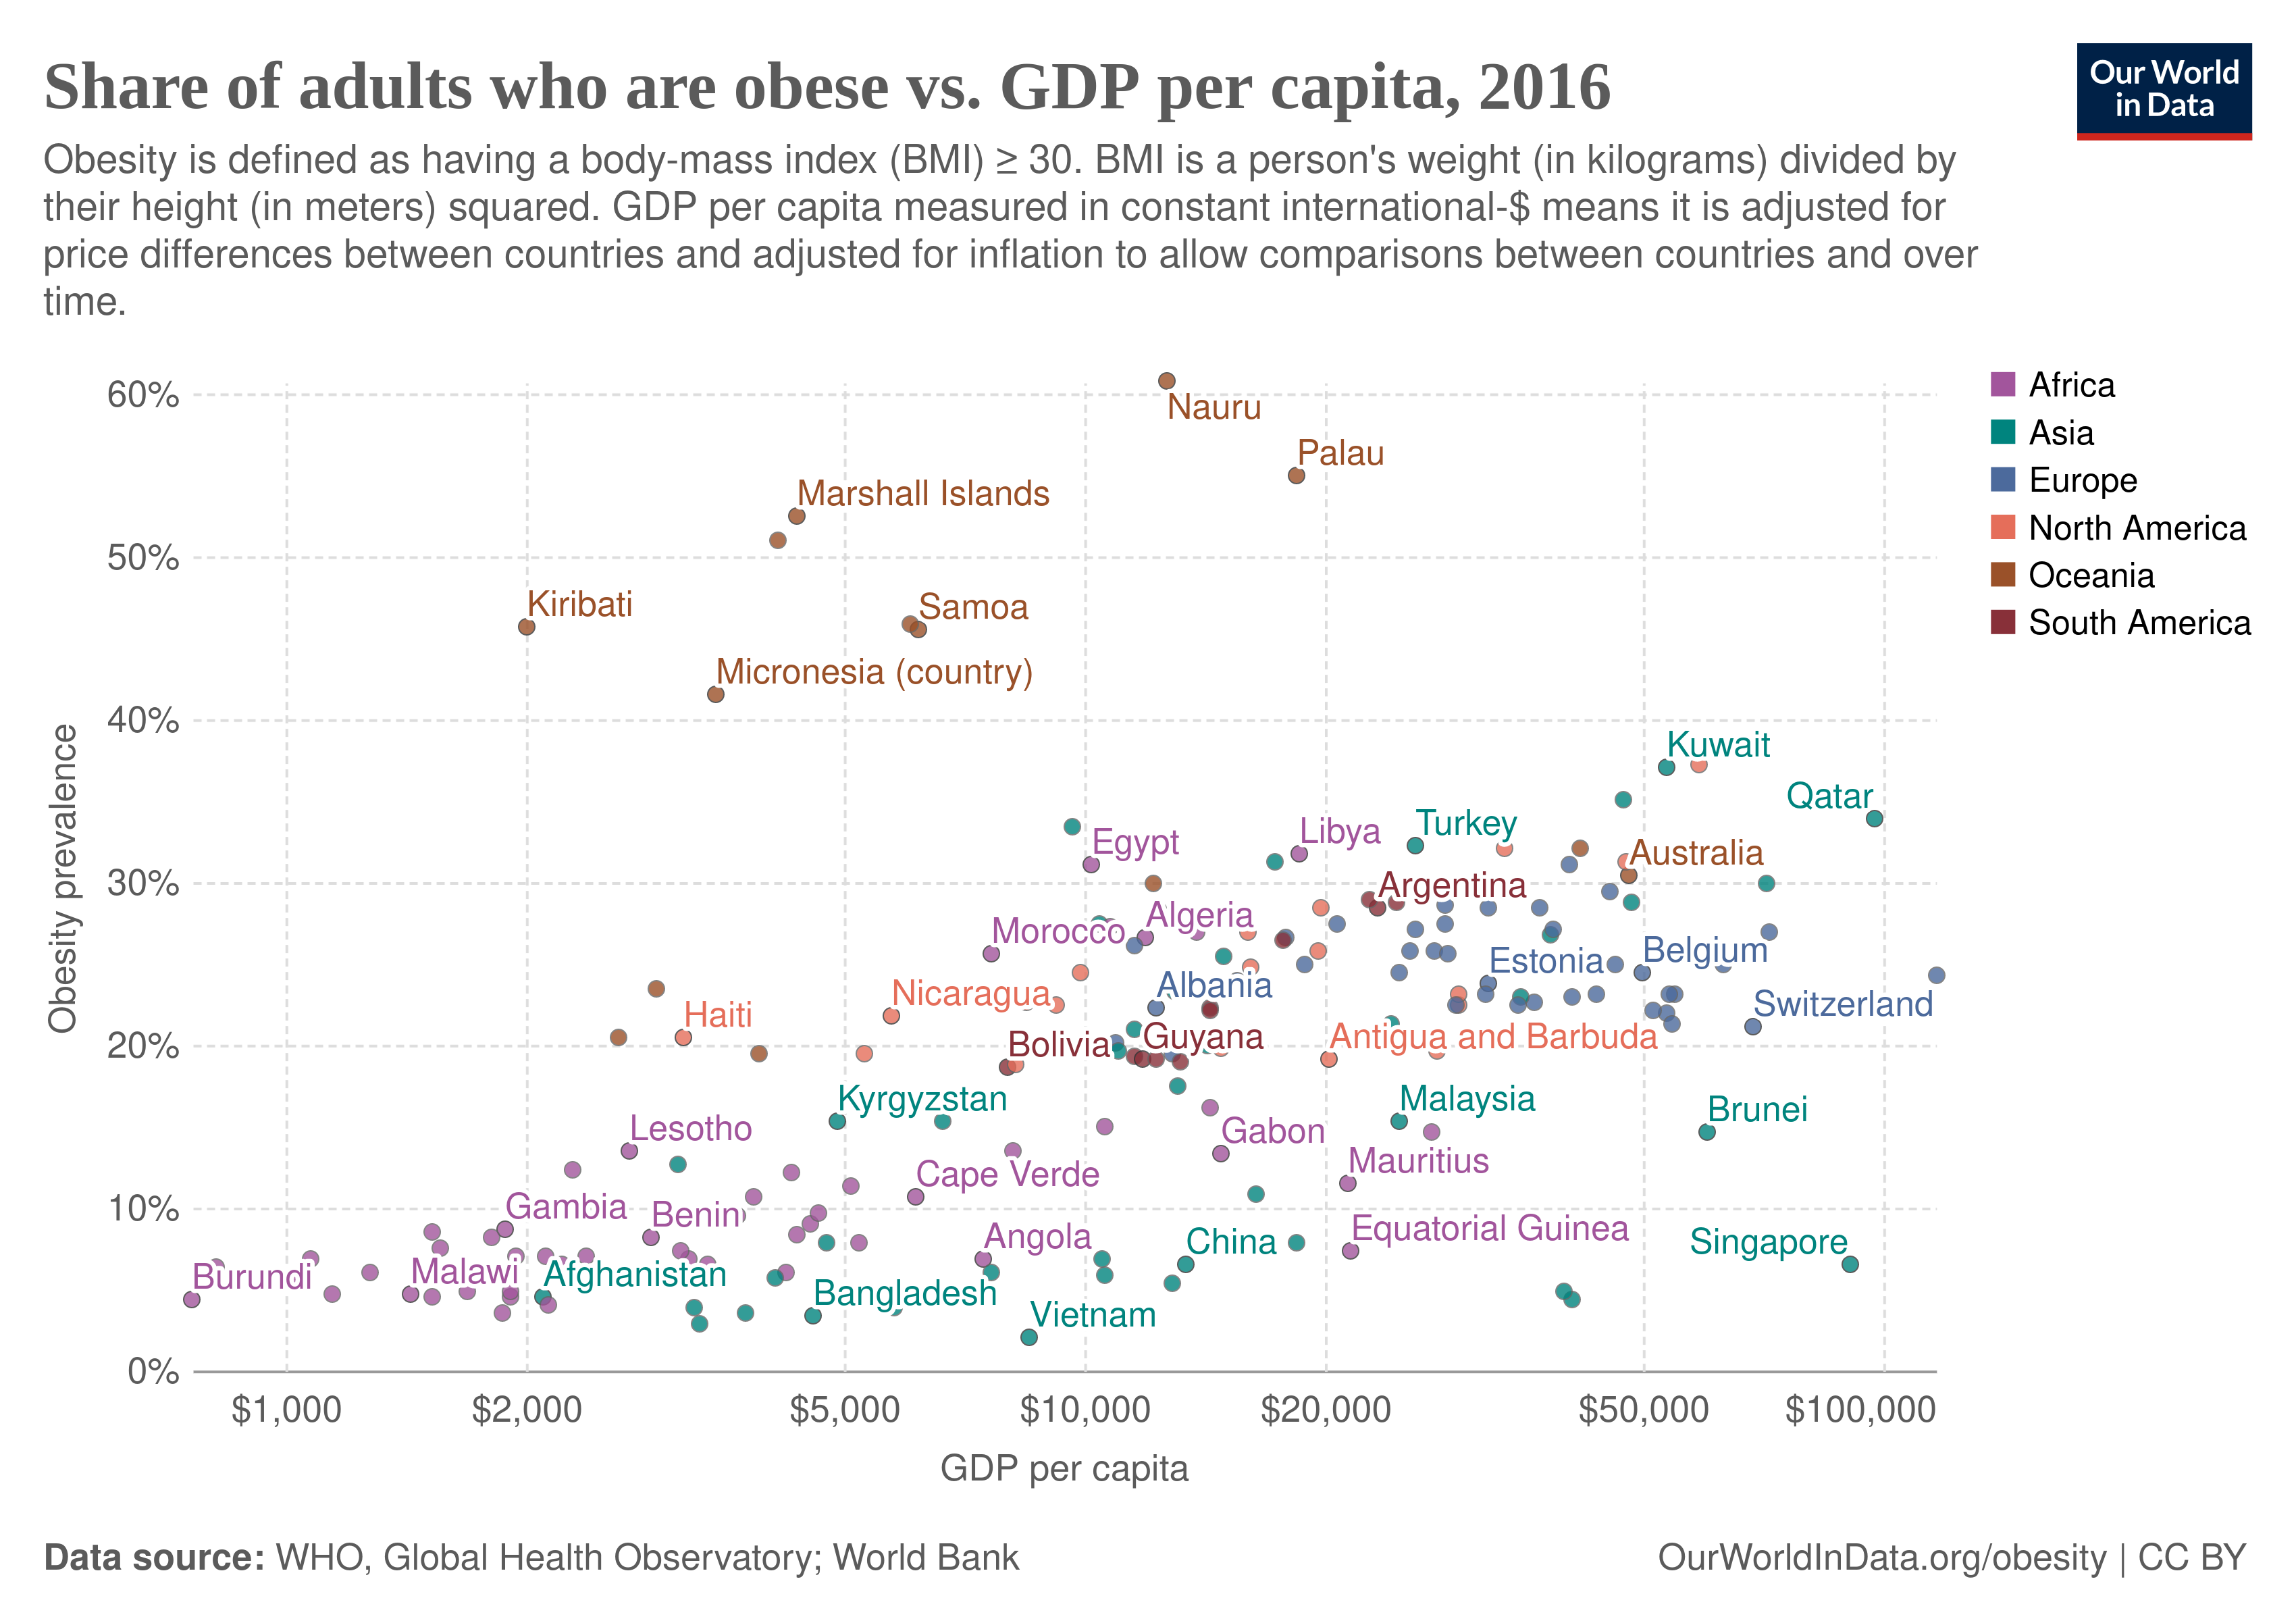
The causal explanation is something like this: within developed countries, smarter people and those with more self-control are better able to control their energy budget (energy in, energy out) and as a result stay slightly skinnier. But smarter, harder working people create massive wealth for their country which results in more money for food, and a greater variety, which in turn makes it harder to keep the energy budget (overeating), and thus obesity. There are other factors, such as jobs in higher intelligence countries involving less physical work, but in general, something like that.
Suicide and intelligence
There’s a number of studies like this one:
Methods We followed 26 315 Swedish girls and boys in population-representative cohorts, up to maximum 46 years of age, for the first suicide attempt in hospital records. Associations between GPA at age 16, IQ measured in school at age 13 and suicide attempt were investigated in Cox regressions and mediation analyses.
Results There was a clear graded association between lower GPA and subsequent suicide attempt. With control for potential confounders, those in the lowest GPA quartile had a near five-fold risk (HR 4.9, 95% CI 3.7–6.7) compared to those in the highest quartile. In a mediation analysis, the association between GPA and suicide attempt was robust, while the association between IQ and suicide attempt was fully mediated by GPA.
Conclusions Poor academic performance in compulsory school, at age 16, was a robust predictor of suicide attempt past young adulthood and seemed to account for the association between lower childhood IQ and suicide attempt.
But between countries, it looks like this:
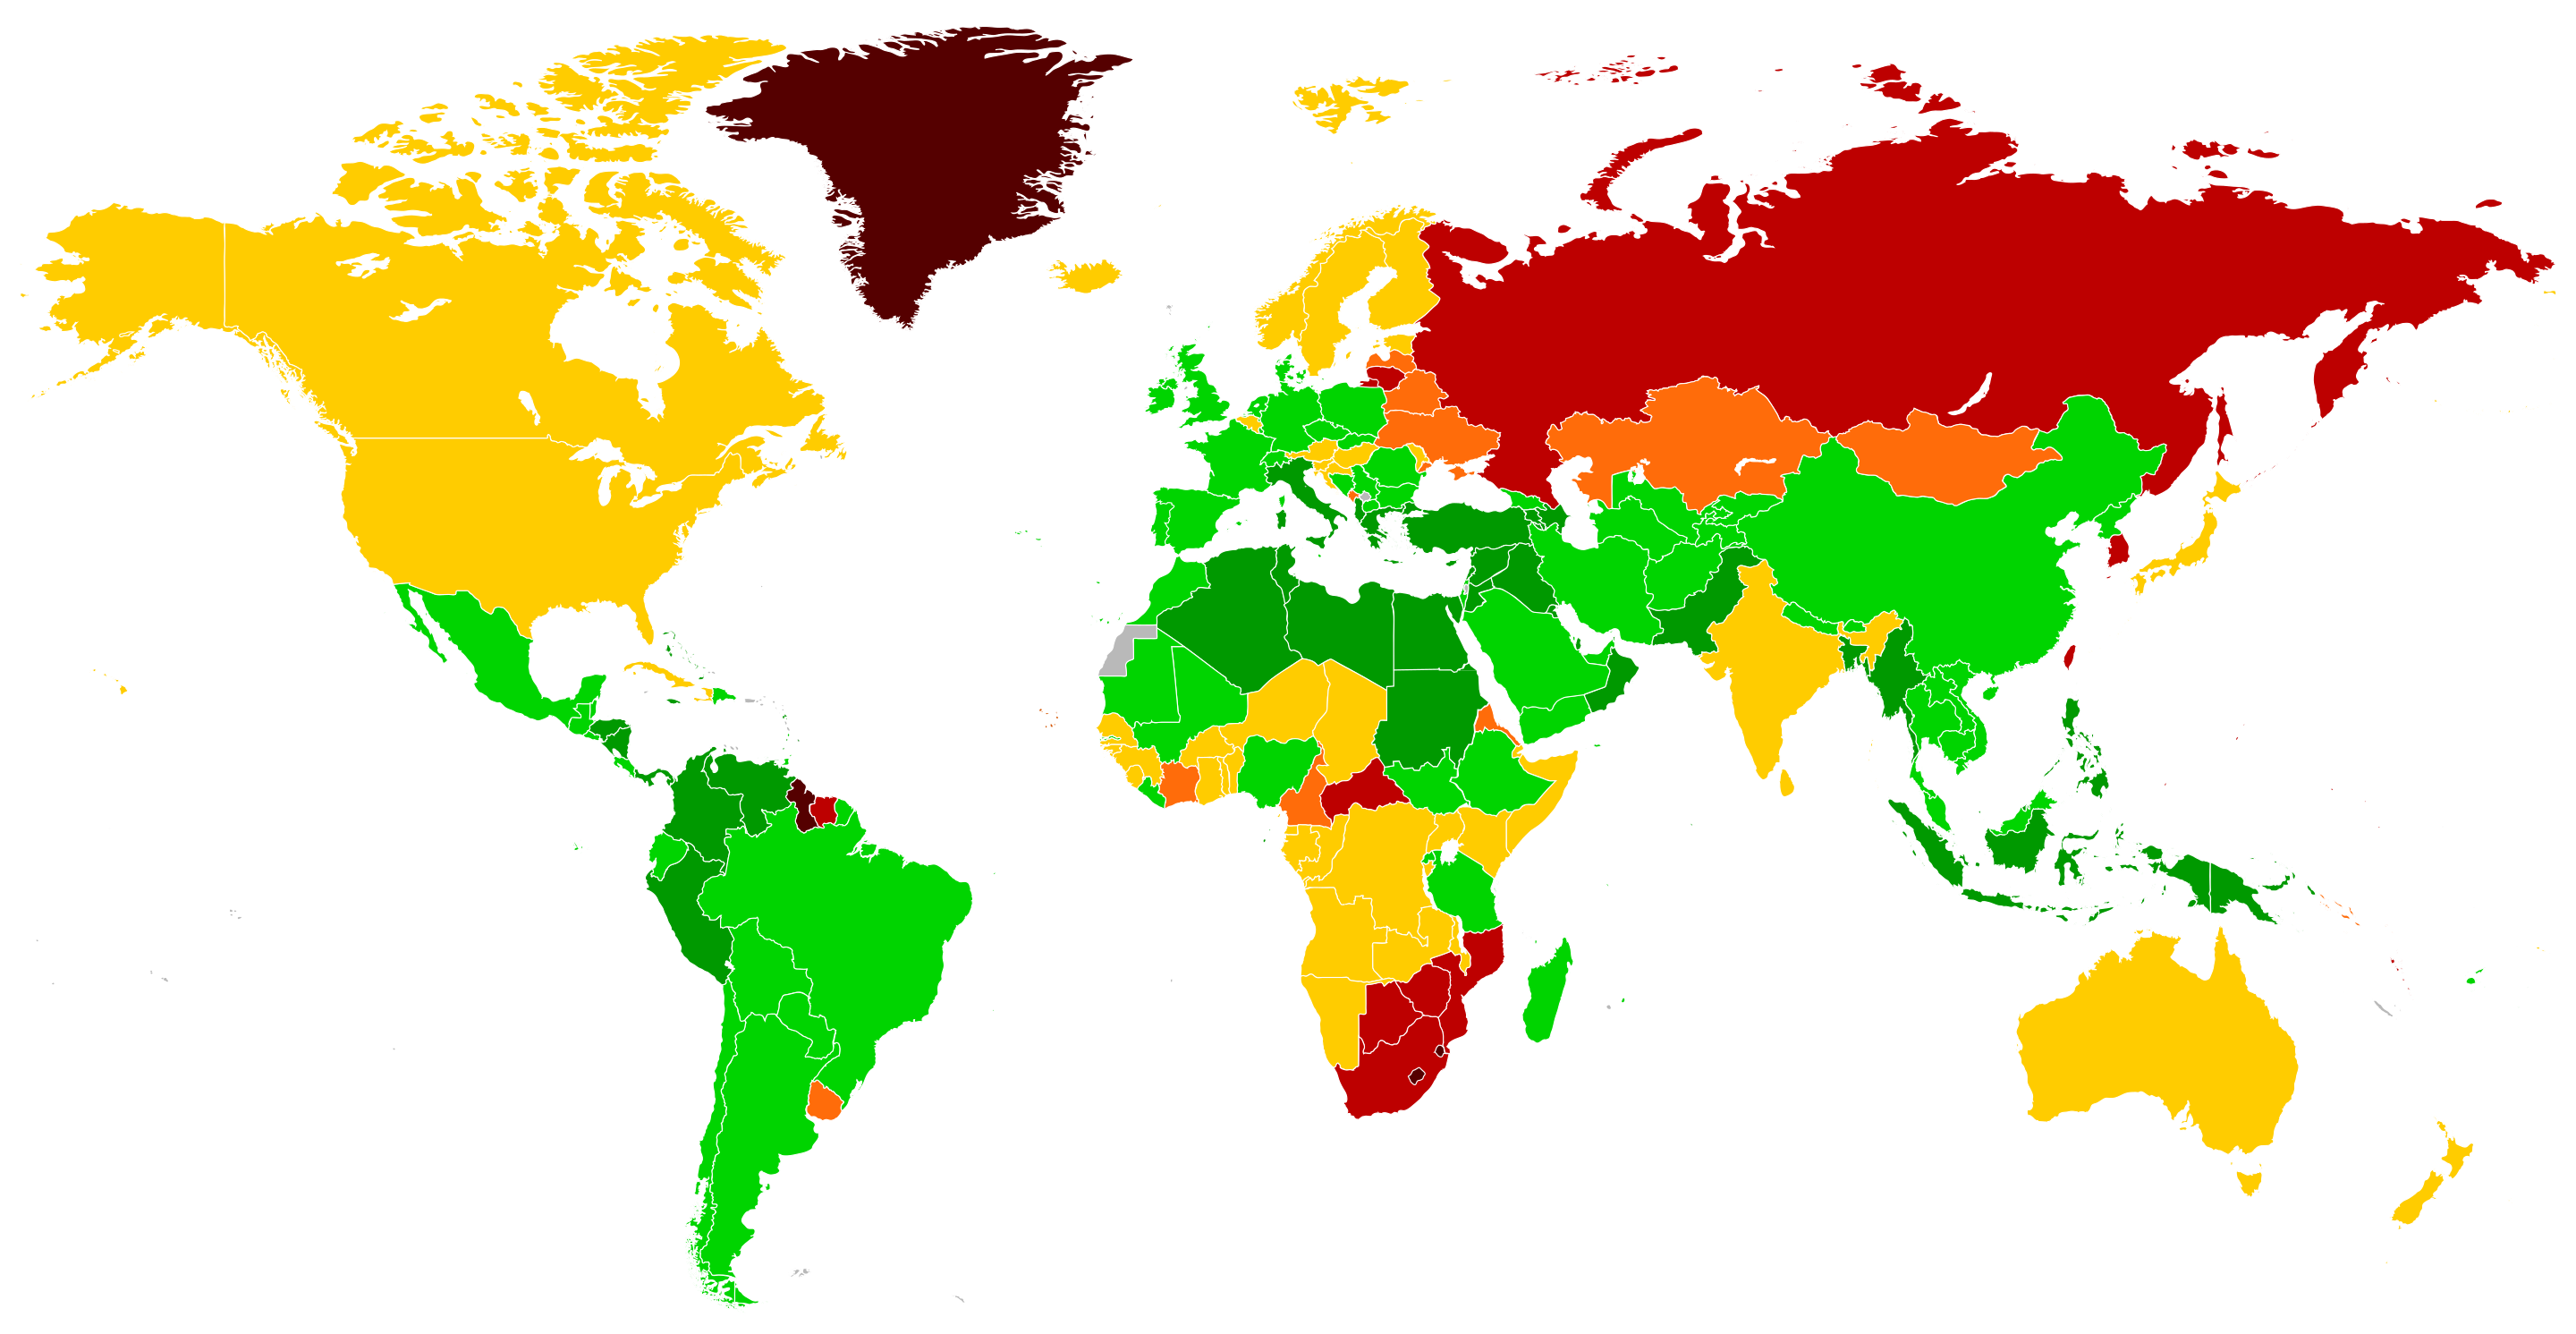
Back when Intelligence was a less cowardly journal, Martin Voracek published a study in 2004 looking at then current national IQ measures and suicide rates. He found:
Across 85 countries, national IQ was significantly positively related to national male (r = 0:39) and female (0.46) suicide rate (both ps < 0:001). Both relations remained stable when countries per capita GDP and a dichotomous variable coding whether a country’s IQ was calculated or estimated were jointly partialed out; rp = 0:43 and 0.44 for the relation with male and female suicide rate, respectively (both ps < 0:001). GDP was weakly positively associated with the male (r = 0:10; p = 0:19) and female (r = 0:17; p = 0:06) suicide rate.
Which he speculated is because:
This study tested the hypothesis that intelligence and suicide mortality are positively related, as suggested by de CatanzaroÕs evolutionary theory of human suicide. The evidence from this ecological investigation of 85 countries is in favour of this hypothesis. Assumed population differences in intelligence may result in varying population proportions that rank beyond a threshold intelligence necessary for suicidal ideation, and this in turn could contribute to observed cross-national differences in suicide incidence. This explanation is possible because the statistical properties of the tails of overlapping distributions are such that even small mean group differences inevitably yield a marked imbalance in regards to the group membership of individuals found in the uppermost percentiles, i.e., the high-end tail, of the joint distribution (Hedges & Nowell, 1995).
In short, it takes a certain level of intelligence to consider the idea to begin with. After all, killing yourself is usually very bad for your selfish genes. The map above also reveals strong cultural factors, as suicide rates are very low in Muslim countries, which are about average IQ by world standards. East Slavic countries under Putin and his allies’ power are quite high in the suicide rate, as well as other problems. Interestingly, the Nordic countries and Anglos also seem elevated for some reason.
By the way, he later showed that this group-level pattern holds within Australian districts, which cannot so easily be explained by the above model. And even that suicidality follows immigrants when they move to new countries:
Objective: Multifaceted evidence (family, twin, adoption, molecular genetic, geographic and surname studies of suicide) suggests genetic risk factors for suicide. Migrant studies are also informative in this context, but underused. In particular, a meta-analysis of the associations of immigrant (IMM) and country-of-birth (COB) suicide rates is unavailable.
Method: Thirty-three studies, reporting IMM suicide rates for nearly 50 nationalities in seven host countries (Australia, Austria, Canada, England, the Netherlands, Sweden and the USA), were retrieved.
Results: Total-population IMM and COB suicide rates were strongly positively associated (combined rank-order correlation across 20 eligible studies: 0.65, 95% CI: 0.56–0.73, P < 10−9). The effect generalized across both sexes, host countries and study periods.
Conclusion: Following the logic of the migrant study design of genetic epidemiology, the correspondence of IMM and COB suicide rates is consistent with the assumption of population differences in the prevalence of genetic risk factors for suicide.
General causal considerations
In some sense, if X causes Y, then in grouped data, X must also cause Y, at least in part. The trouble is that other factors may be much stronger and cause reversals in the directions of association, or more commonly, make them much stronger. We have seen a few examples of this in this post. It can be more complex too, as with obesity and wealth/development/education. In this case, there is emergent causation of how societies work as a function of the population’s distribution of various traits, such as intelligence. One cannot really predict such emergent causation from observing individuals. An even worse idea is to try to infer causation at the individual level from group level data, which is why it is called the ecological fallacy.