Heiner Rindermann sent me his new review paper:
-
Rindermann, H. (2025). Low cognitive ability estimates in developing countries: A statistical analysis of their credibility. Human Evolution, 40(3–4), 257–284. https://doi.org/10.14673/HE2025341159,
Developing countries tend to achieve weak results in international assessments of cognitive competence. Their performance is typically about one to two standard deviations below the average scores obtained in Western countries. The results are sometimes so low that they appear difficult to believe. For example, in the World Bank dataset, Nigeria scored 262 student assessment points (SASQ, about two and a half standard deviations below the norm of 500, equivalent to an IQ of 64). In the Altinok and Diebolt dataset, Yemen scored 273 SASQ (equivalent to an IQ of 66). These results have sparked criticism, and ethical as well as political-ideological debates, culminating in motivated retractions of scientific papers. In this paper, we cross-validate the reported values by comparing different data sources and applying statistical predictions. Across test paradigms, the results for groups of countries appear consistent. However, substantial discrepancies remain for individual countries. The same holds for comparisons across test collections: aggregated country results are similar, while single-country outcomes differ. Using education, GDP per capita, and political indicators to predict test scores yields somewhat higher values for the Global South (by about 5 IQ points), with the strongest effects observed in Latin America (rising from 78 to 86 IQ points). Where large discrepancies occur between observed and predicted test results, the potential for improvement appears substantial. Cultural and evolutionary background factors proved to be stronger predictors than political variables, whereas genetic distance to South or East Africa was less predictive.
The current thing in censorship science is getting national IQ papers retracted. It’s another Rebecca Sears undertaking:
Such low results have sparked opposition, scientific critique, and ethical and political-ideological debates, at times leading to motivated retractions of scientific papers (e.g., Rindermann, 2024a). For instance, Rebecca Sear (2022, p. 1) wrote that Lynn and Becker’s IQ dataset were “not fit for purpose” and “not only inaccurate but systematically biased”. Or Kevin Bird (2020, p. 472) accused the Lynn data of “systematic bias”. Of course, all scientists, including those from other disciplines, may condemn Lynn and Becker’s data.1 However, when using student achievement data, the results are generally similar or even worse. For example, instead of IQ 68 for Nigeria (Lynn & Becker), student achievement-based estimates yield IQs of 84 or 71 (SASQ converted to an IQ scale, benchmark UK 99 IQ points, Lim et al.) and 64 or 59 (UK=98, World Bank). Similarly, instead of IQ 72 for Yemen (Lynn & Becker), the corresponding estimates are 75 or 70 (UK=99, Lim et al.) and 63 or 57 (UK=98, World Bank).
The topic is relevant and interesting, and I have discussed it at length (and Rindermann wrote another paper one year ago about the same). The issue is that many countries seemingly have average scores around 70 IQ or lower. Is this even possible? Clearly, the tests must be wrong and biased right? The first strategy was to claim that Richard Lynn had systematically faked or biased the data collection. This became rationally untenable once it was shown that multiple other independent teams can get the same results (Sears is still stuck in the first strategy). So what now? Well, the other teams wisely called their collections something else, definitely not national IQs, but instead basic skills, ‘human capital’, “learning-adjusted years of schooling“, and so on. Still, the results stay about the same, as Rindermann shows above. Here’s my own comparison table for Sub-Saharan African countries from 2 years ago:
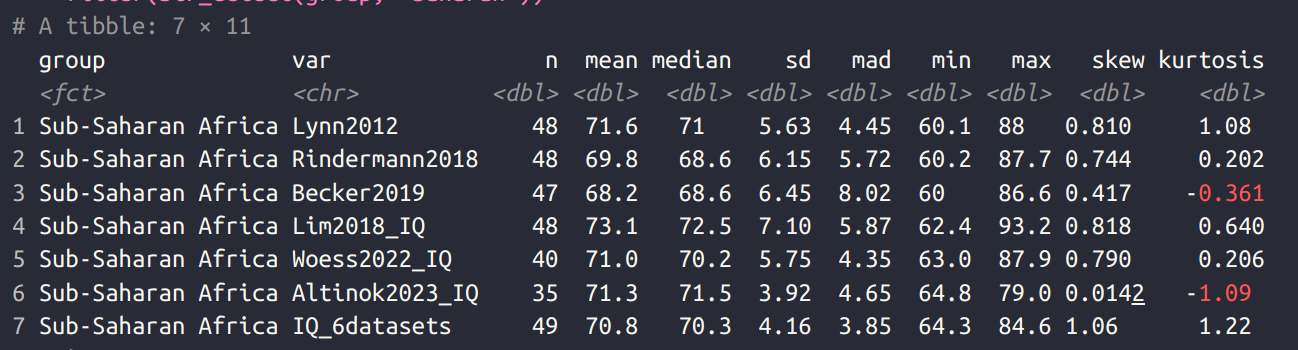
The average estimate ranges from 68 to 73, with a mean of 71. Two of these compilations are made by World Bank economists, and another by a group of Asians who plagiarized Lynn’s work and published it in The Lancet (!?). It doesn’t matter because the underlying data tells the same story more or less.
Some year ago, Noah Carl proposed an imputation strategy to validate estimates. If we exclude the African countries, and impute their IQs based on other country-level data (GDP, HDI etc.) what do we get? Well, 75 maybe. I later showed that this method tends to produce imprecise estimates. Rindermann follows the same approach but simpler:
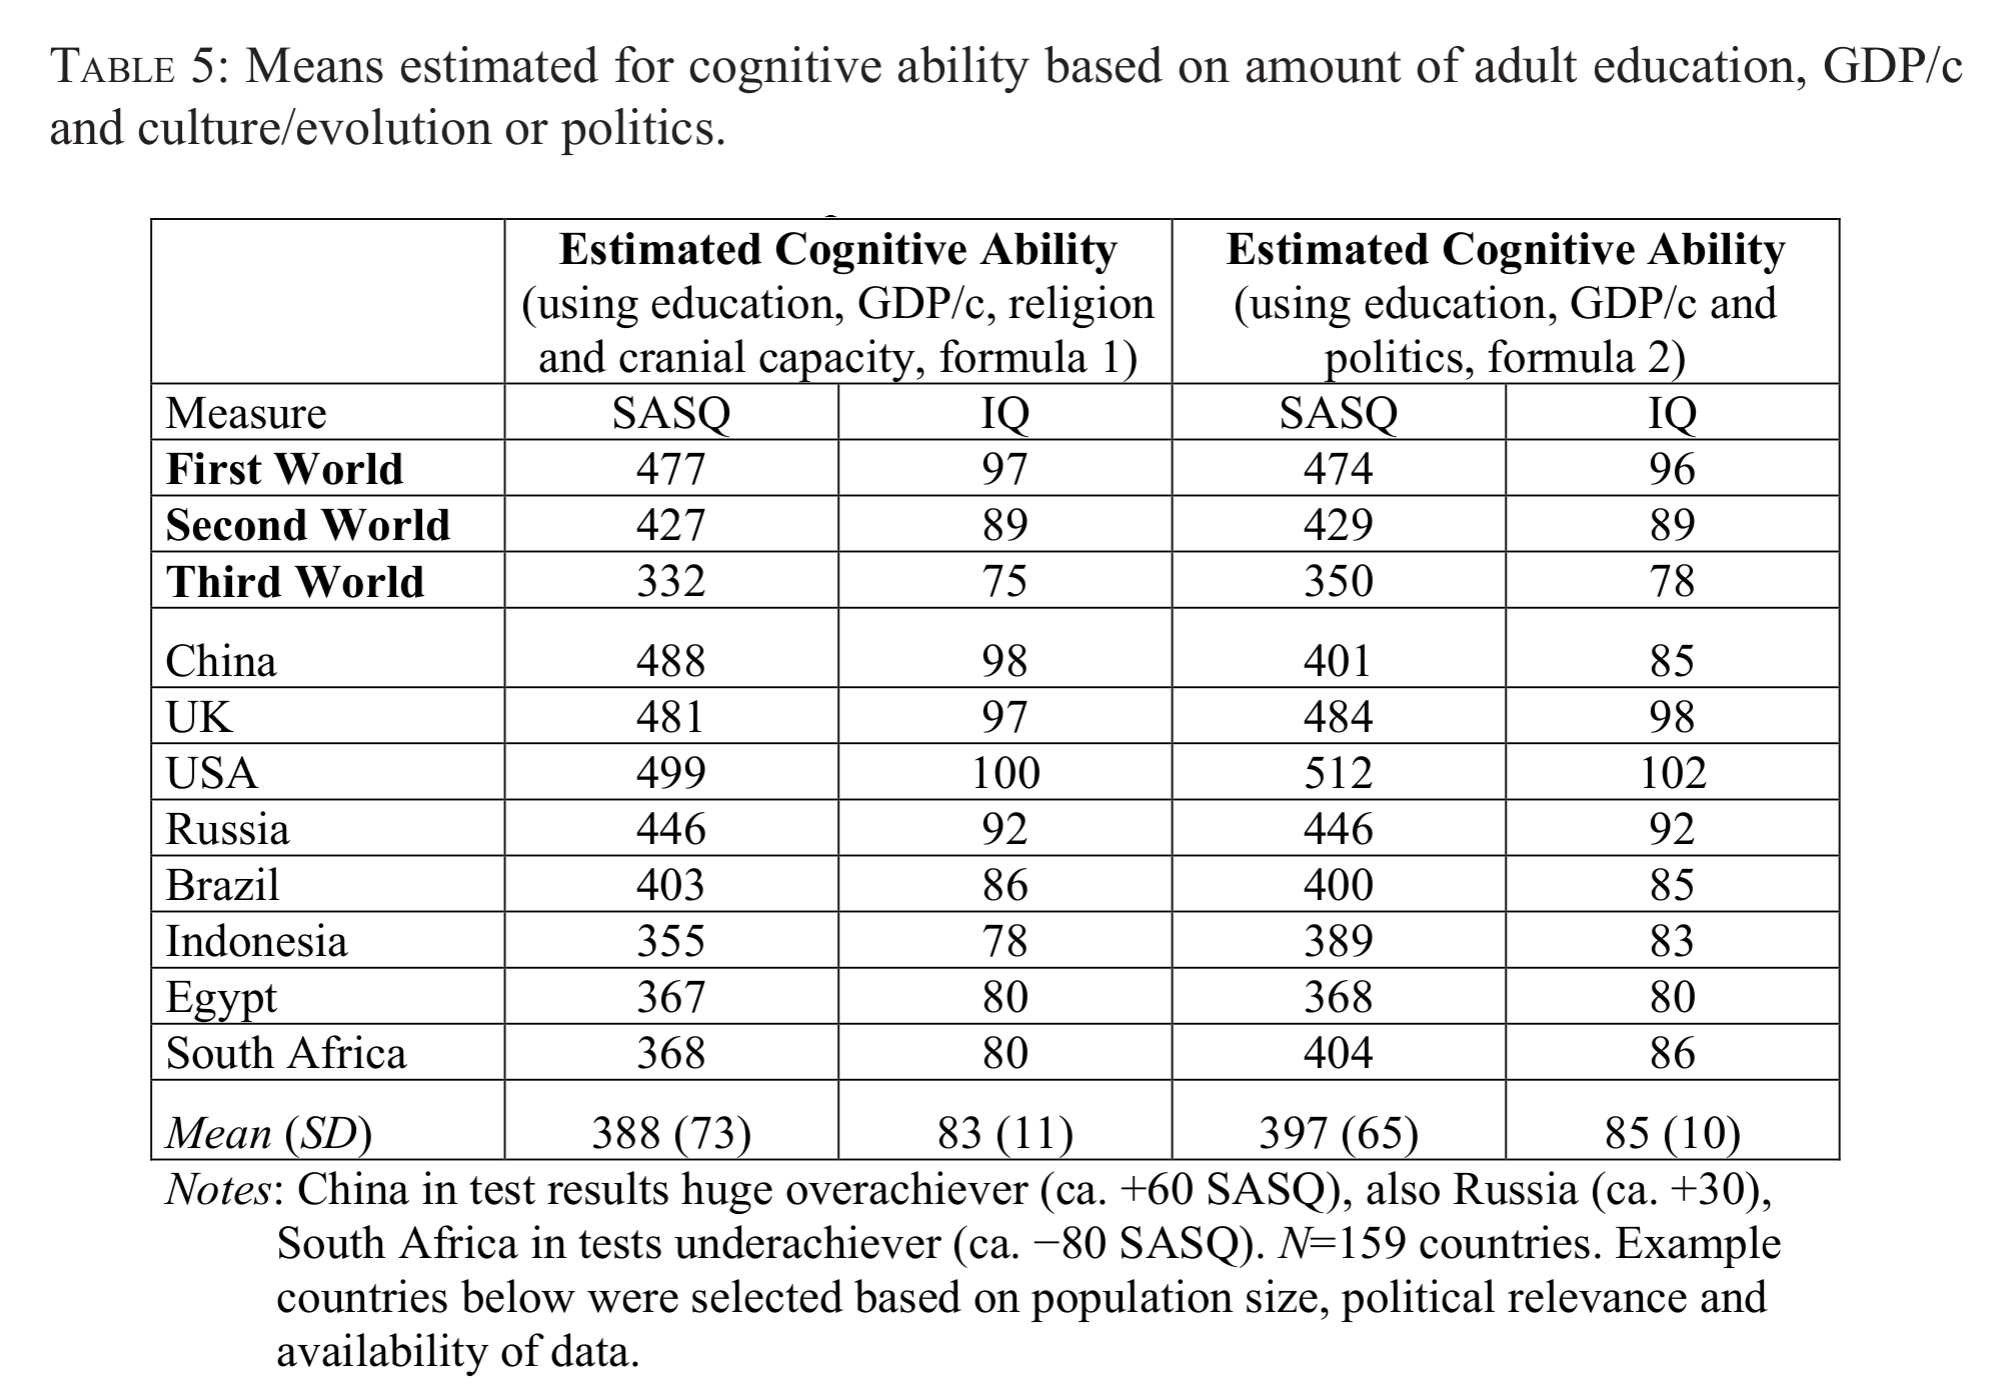
He obtains predicted scores for 3rd world of 75 and 78. I showed that the dataset chosen to project from and the method chosen results in a variety of values:

The range is from 60 to 83 IQ, which is not so satisfactory, though the mean is 73 IQ which is only slightly higher than what we have observed in the compilations above.
One key problem is that imputation results in regression towards the mean:
In general, it is important to note that when values are predicted using regression equations, extreme values tend to be regressed toward the mean. This can be seen by comparing the standard deviations (here reported to two decimal places). The measured cognitive mean from Rindermann (Table 2b, column 1) has a standard deviation of 12.52 (IQ scale), whereas the predicted values (Table 5, columns 2 and 4) have standard deviations of 11.01 and 9.68. The measured mean is negatively correlated with the differences between predicted and observed values (predicted − measured) at r=−.52 and −.67 (N=157 countries). In other words, countries with high measured values tend to decrease, while countries with low measured values tend to increase.The negative correlation is stronger for the less predictive second formula (lower multiple correlation).
This is a ‘trivial’ result of imperfect prediction accuracy, but we can also show this by pure simulation. This fact has nothing really to do with IQs as such but everything to do with how regression works. Here’s what I did:
- Simulate 50 variables with variable correlations with NIQs from 0.23 to 0.82 with a mean of 0.47. This is typical of international social metrics.
- Repeat 1000 times:
- Pick 5 of the NIQ correlated variables at random and use them to predict NIQs using linear regression.
- Train only on the countries below 75 or above 90 (n = 50 for each).
- Predict values for the not-seen cases, and save the mean.
The results look like this:
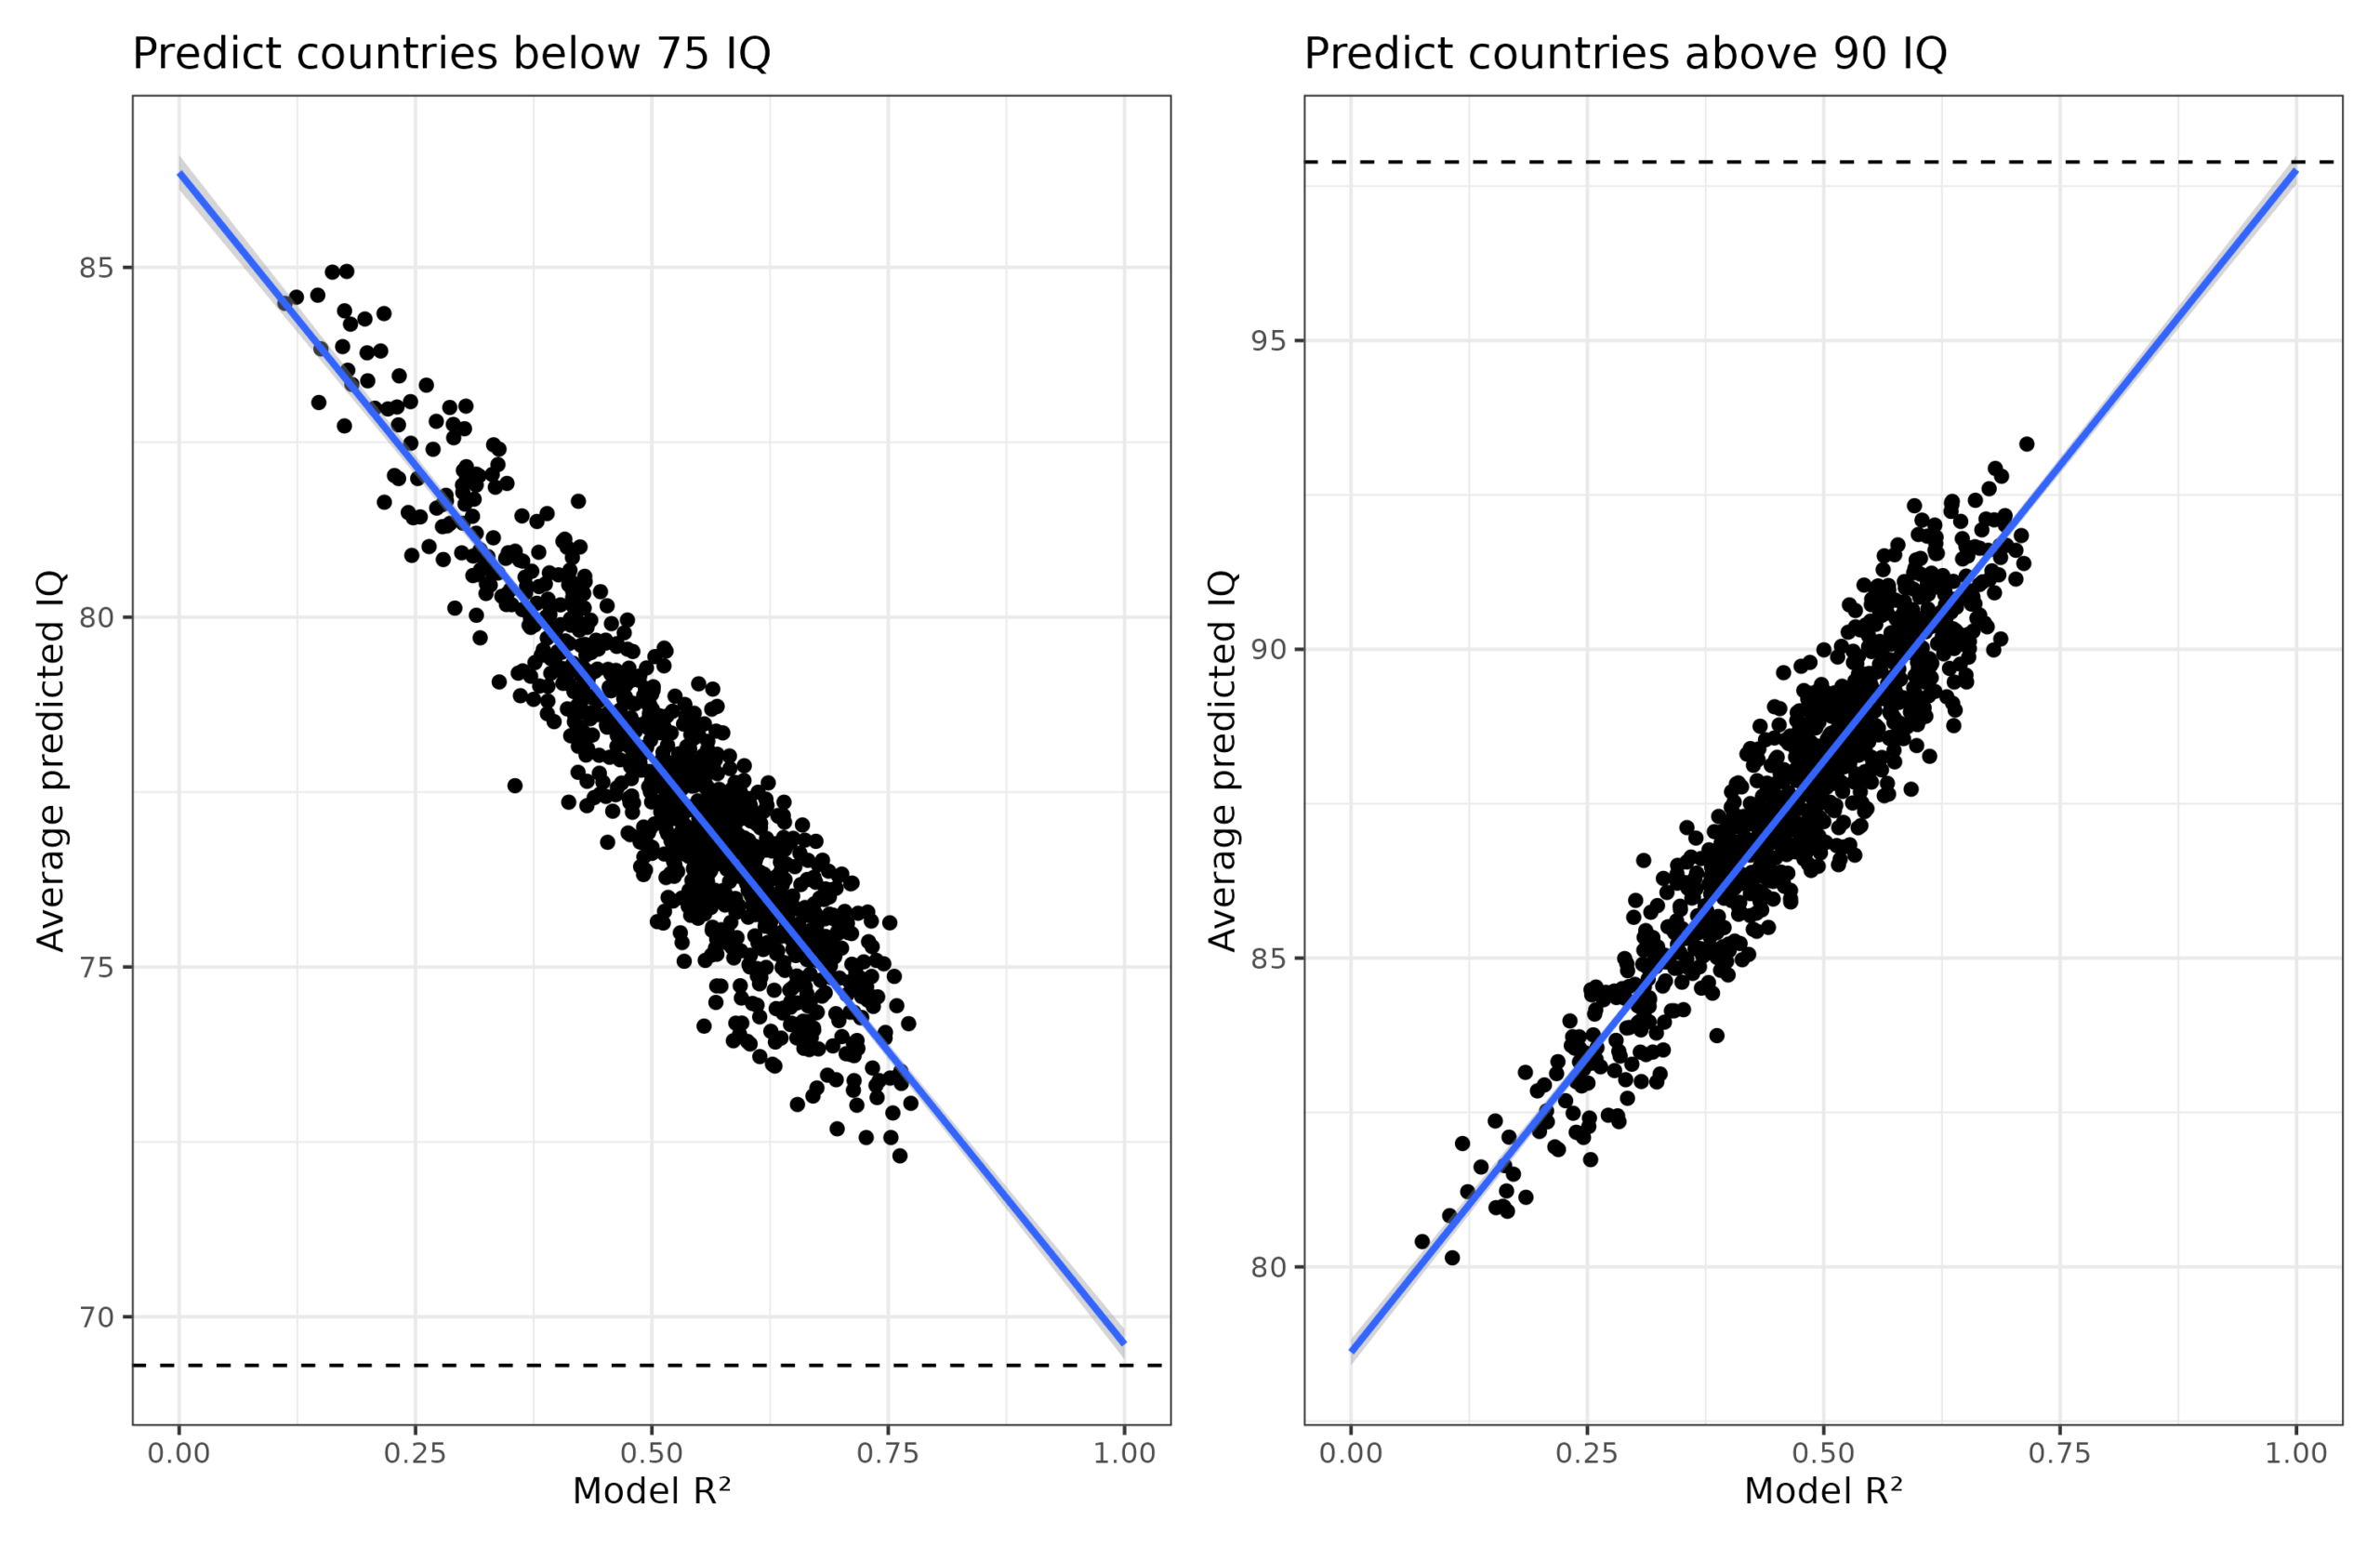
The horizontal lines show the actual mean NIQs for those countries left-out (69.3 and 97.9 in this dataset). Notice as the regression models get more accurate in R² terms, they approach these values. In fact, using a hypothetical model with R² = 1.00, the predicted mean IQs would be 69.6 and 97.8 IQ, basically perfect. In other words, we can predict the mean of the unobserved values using this meta-regression approach.
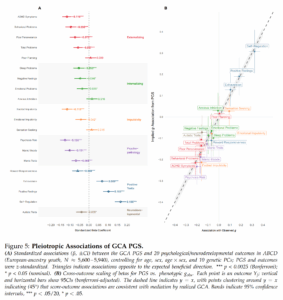
So far so good, so let’s repeat my prior study and apply this meta-regression and see what values we obtain for African countries. This is the same approach as above but using the Social Progress Index database of 51 country-level indicators and generating random models with 2-7 variables. This gives us this plot:
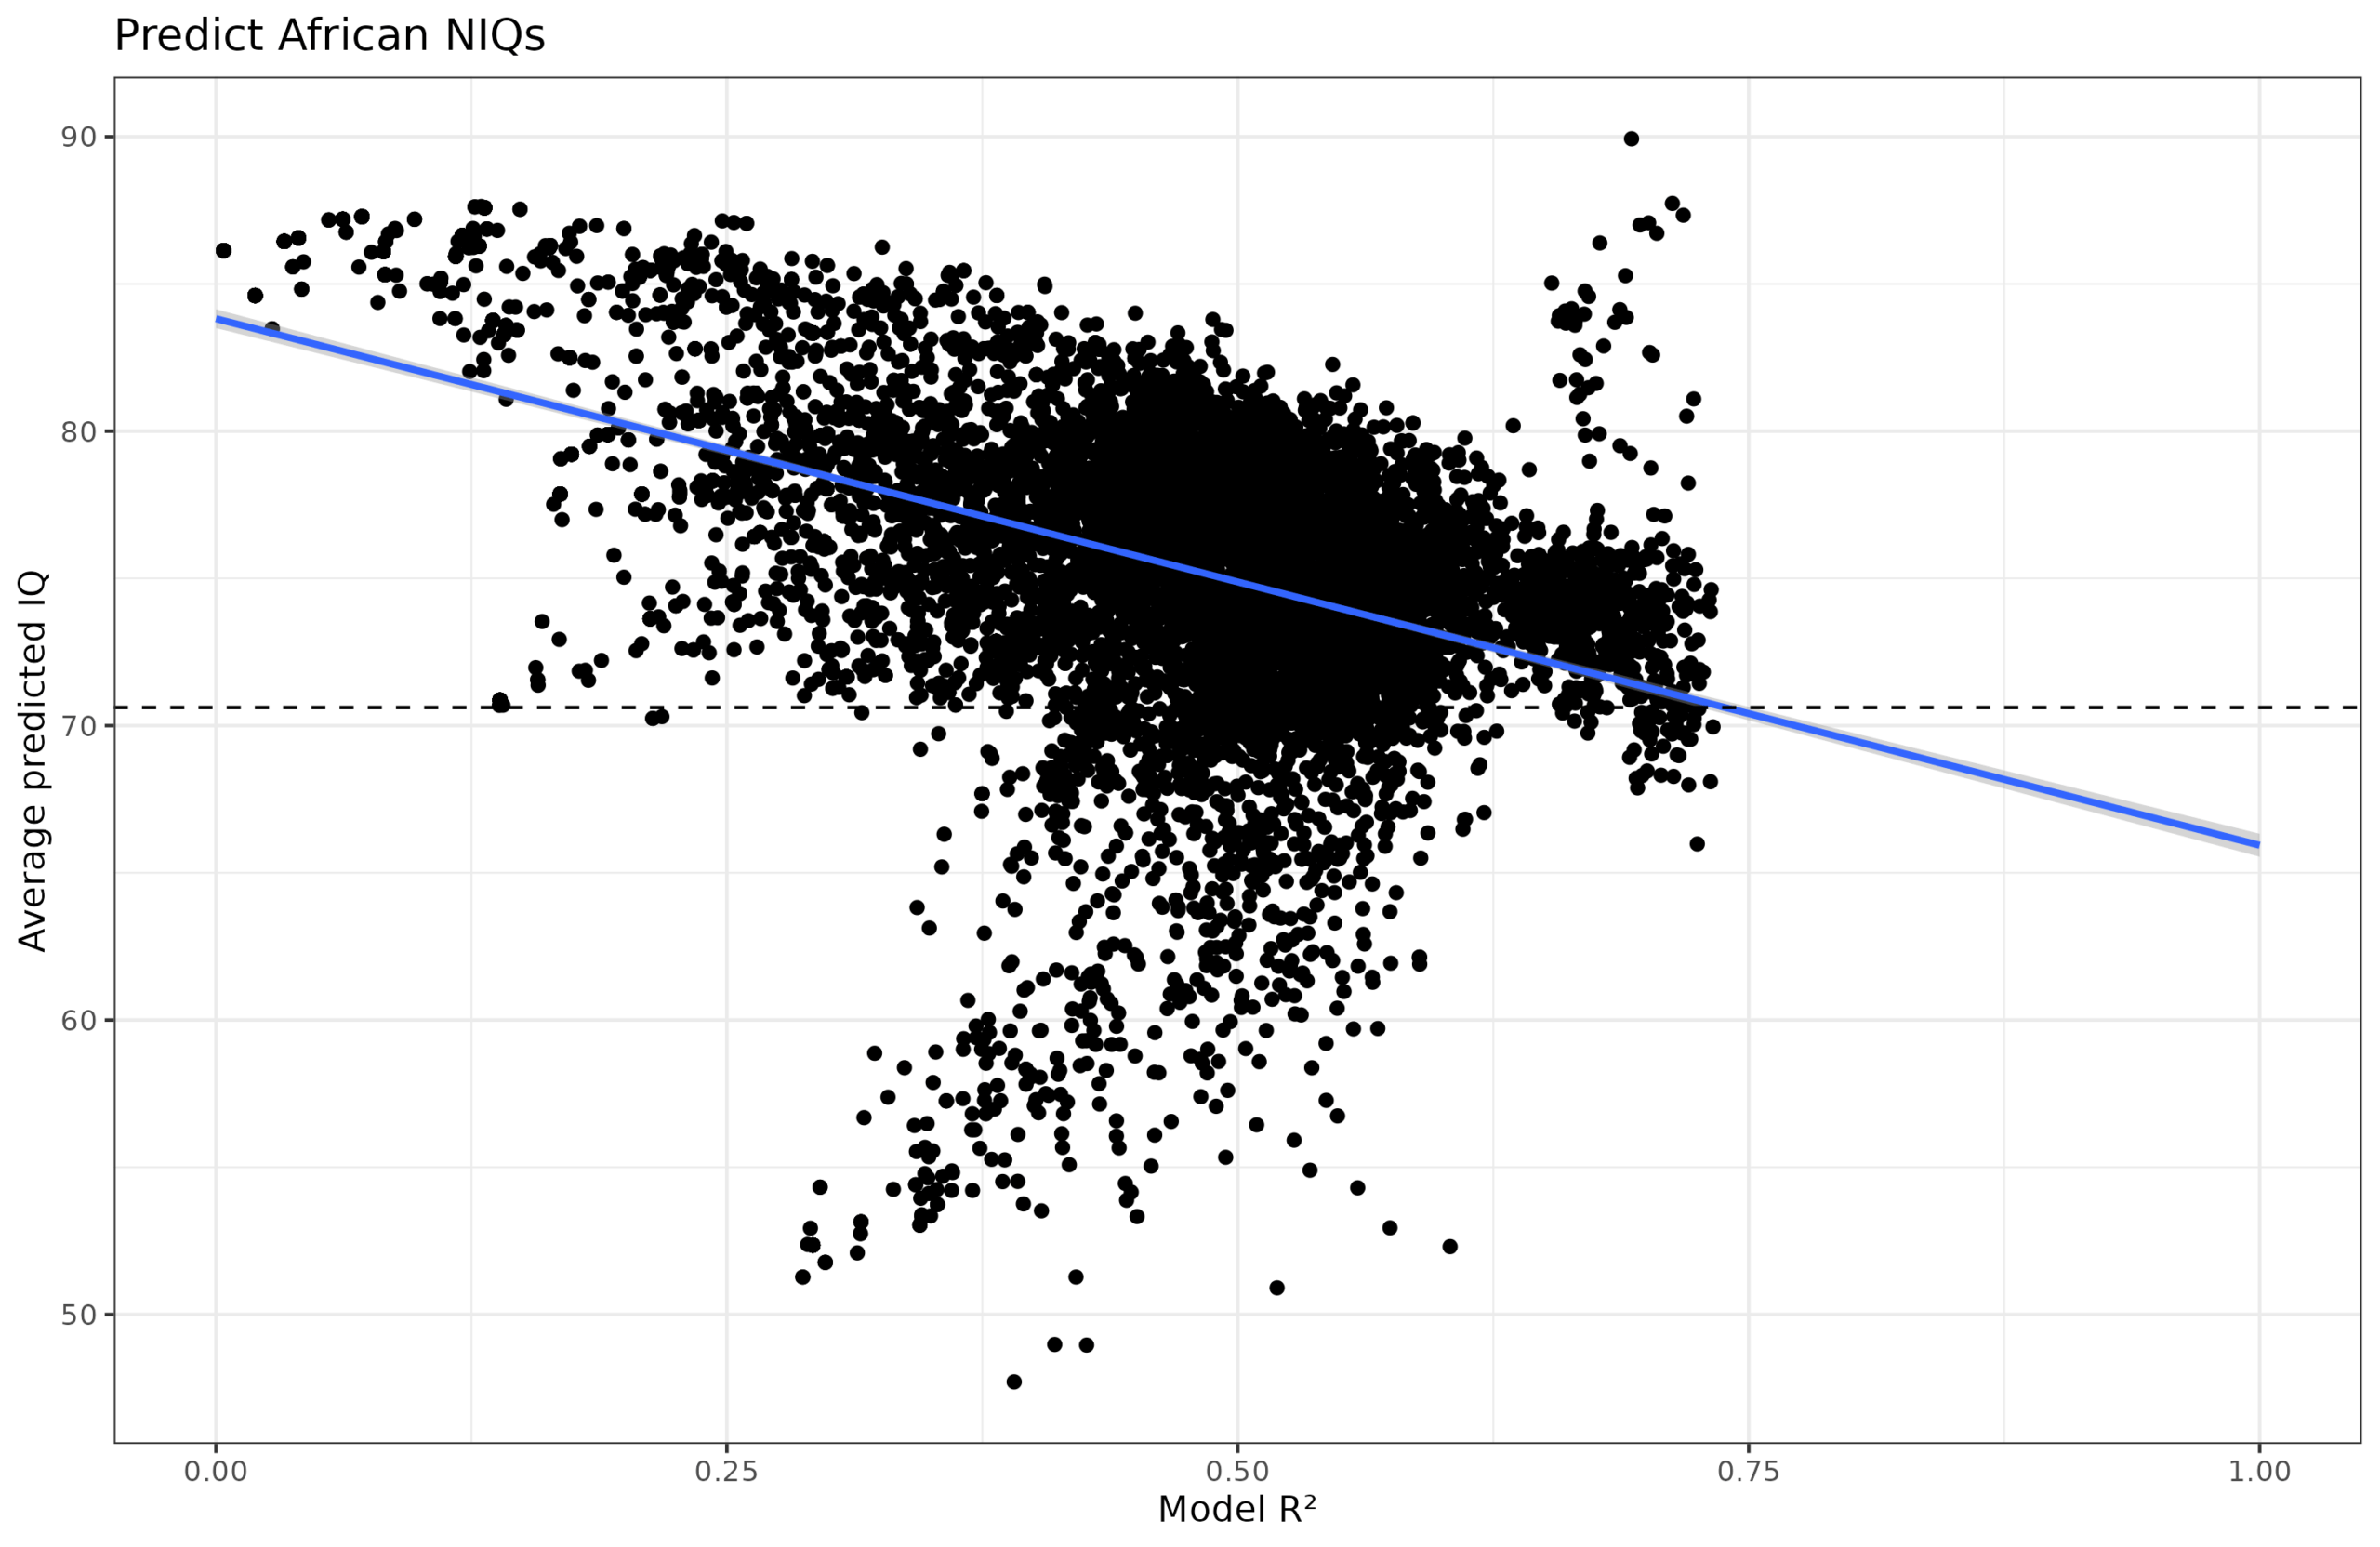
It’s somewhat of an abomination, which even looks like an animal of sorts. Why? It turns out it is mainly because of one variable: deaths from infectious diseases per 100k. This variable causes the models either to severely underestimate or severely overestimate the African IQs:
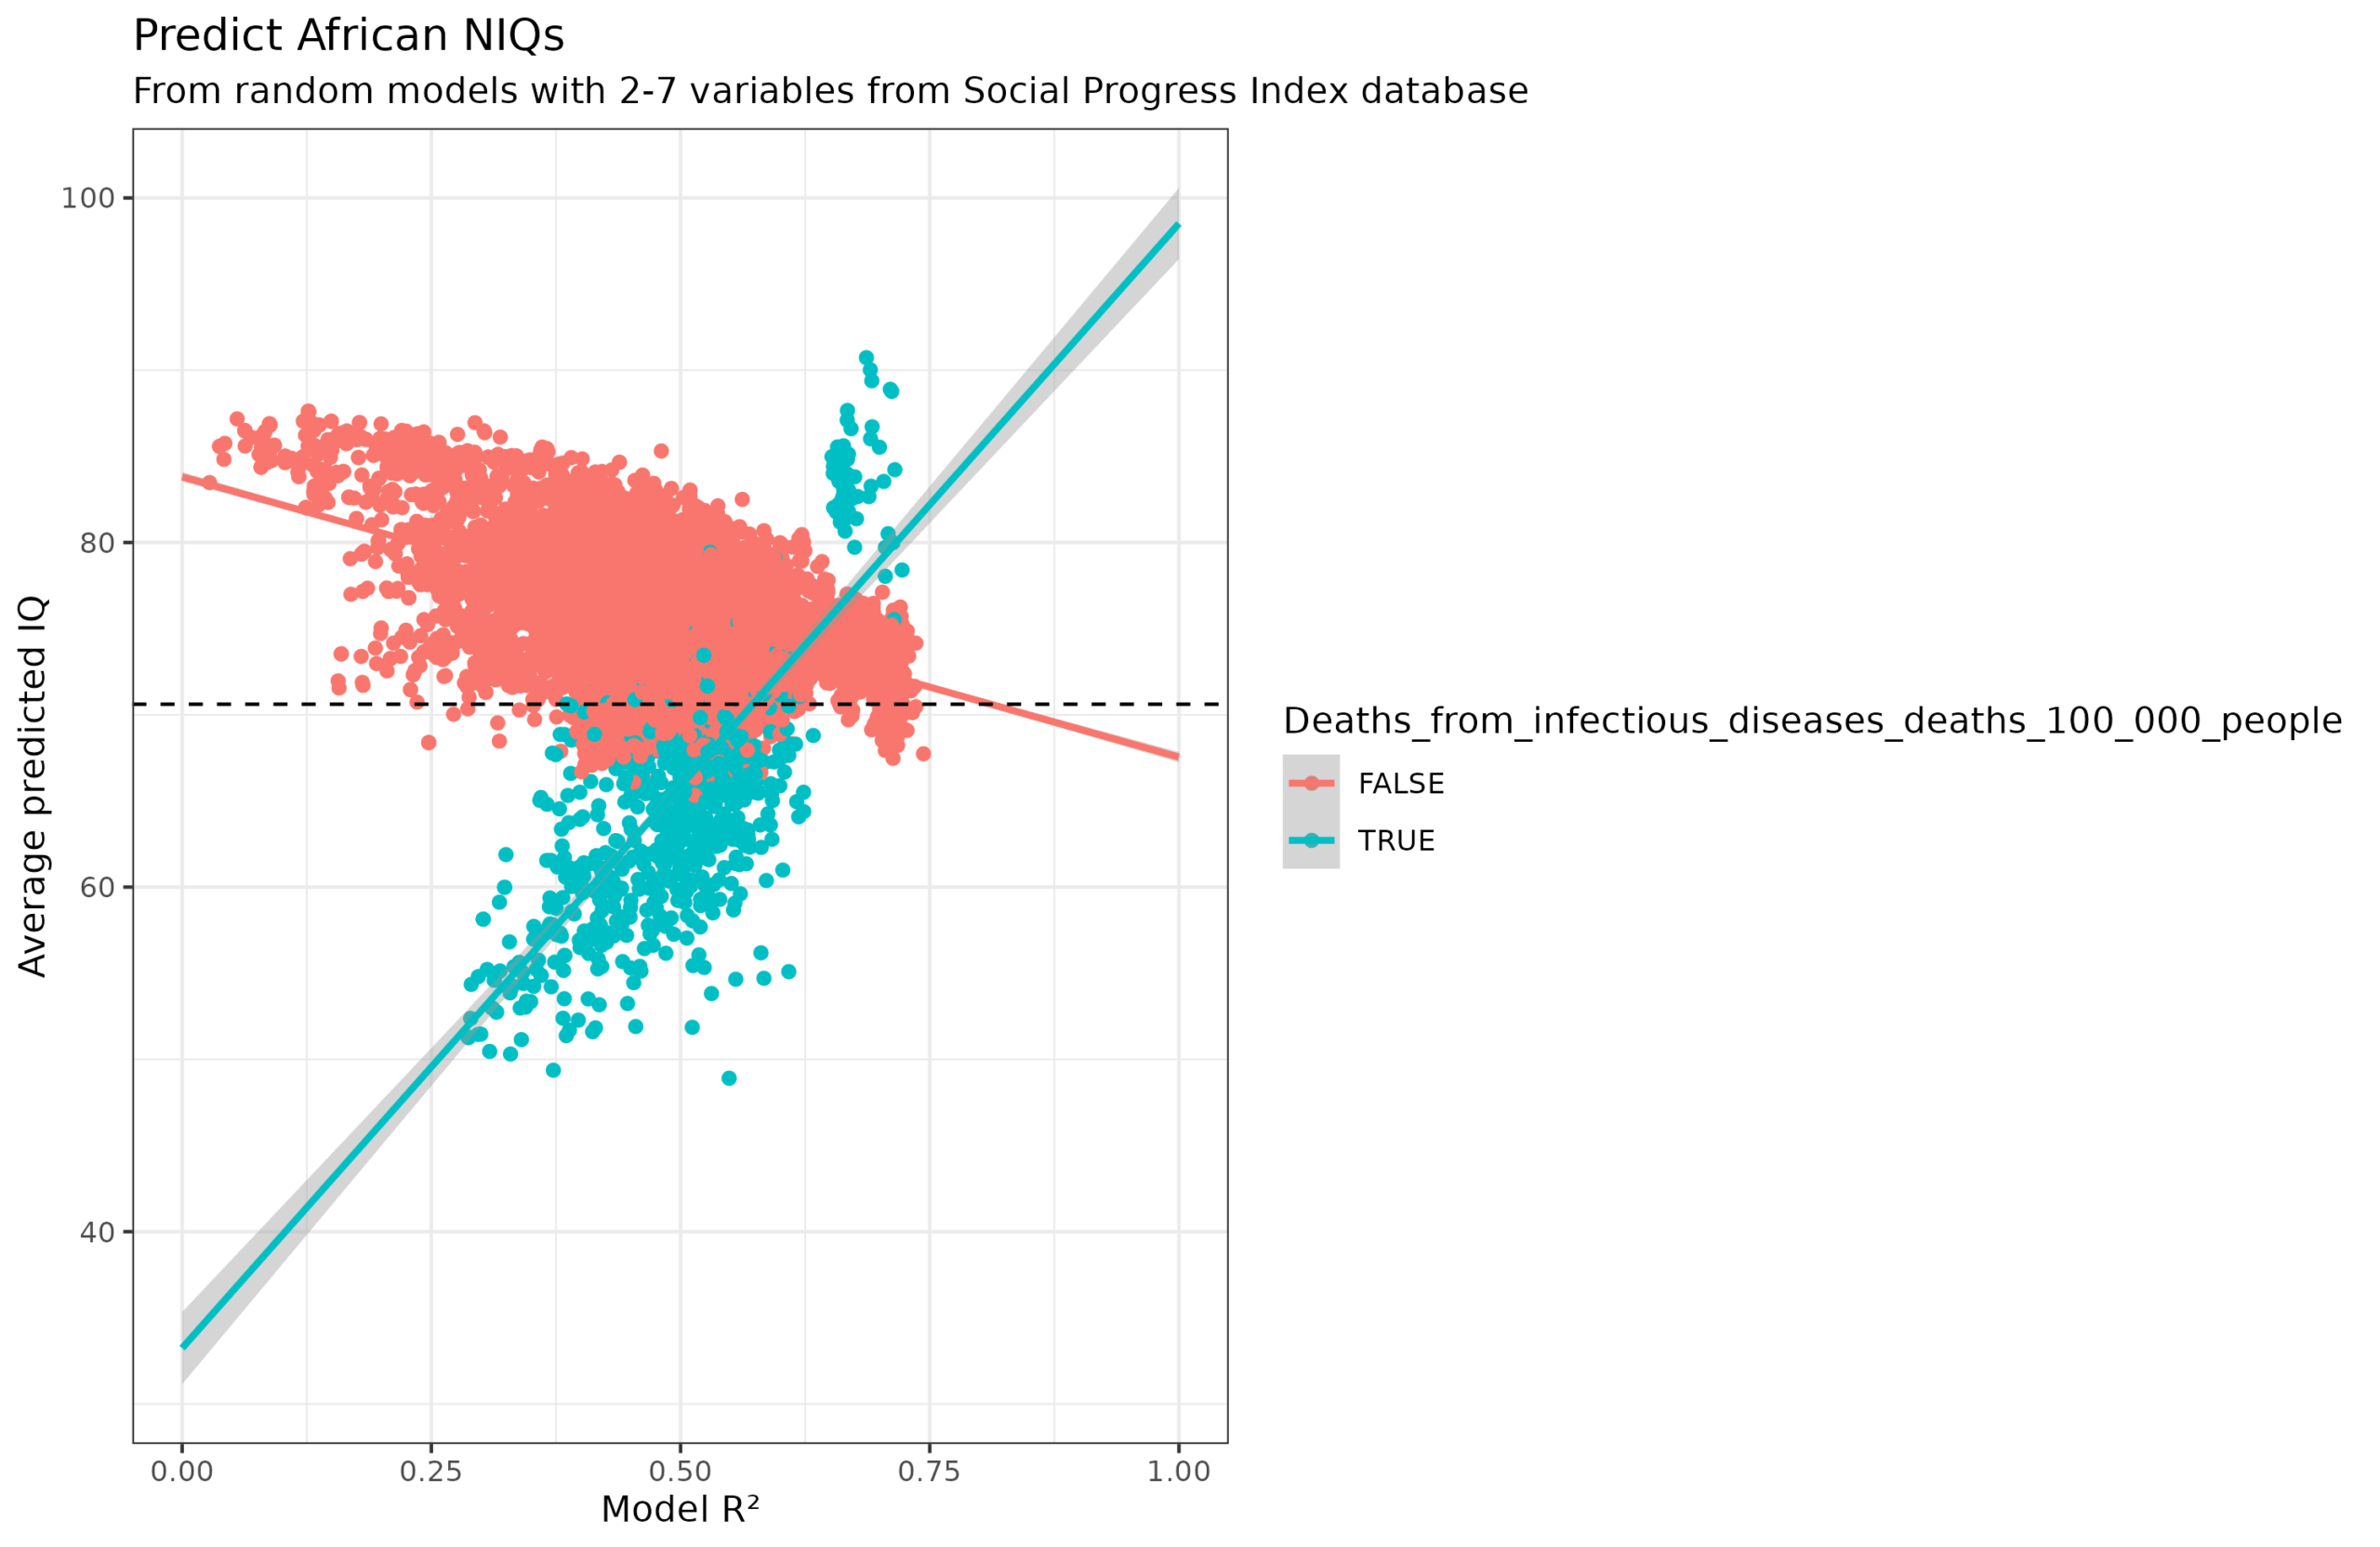
What about the second cluster of too high values? It turns out to be an interaction effect with another variable, access to essential services:
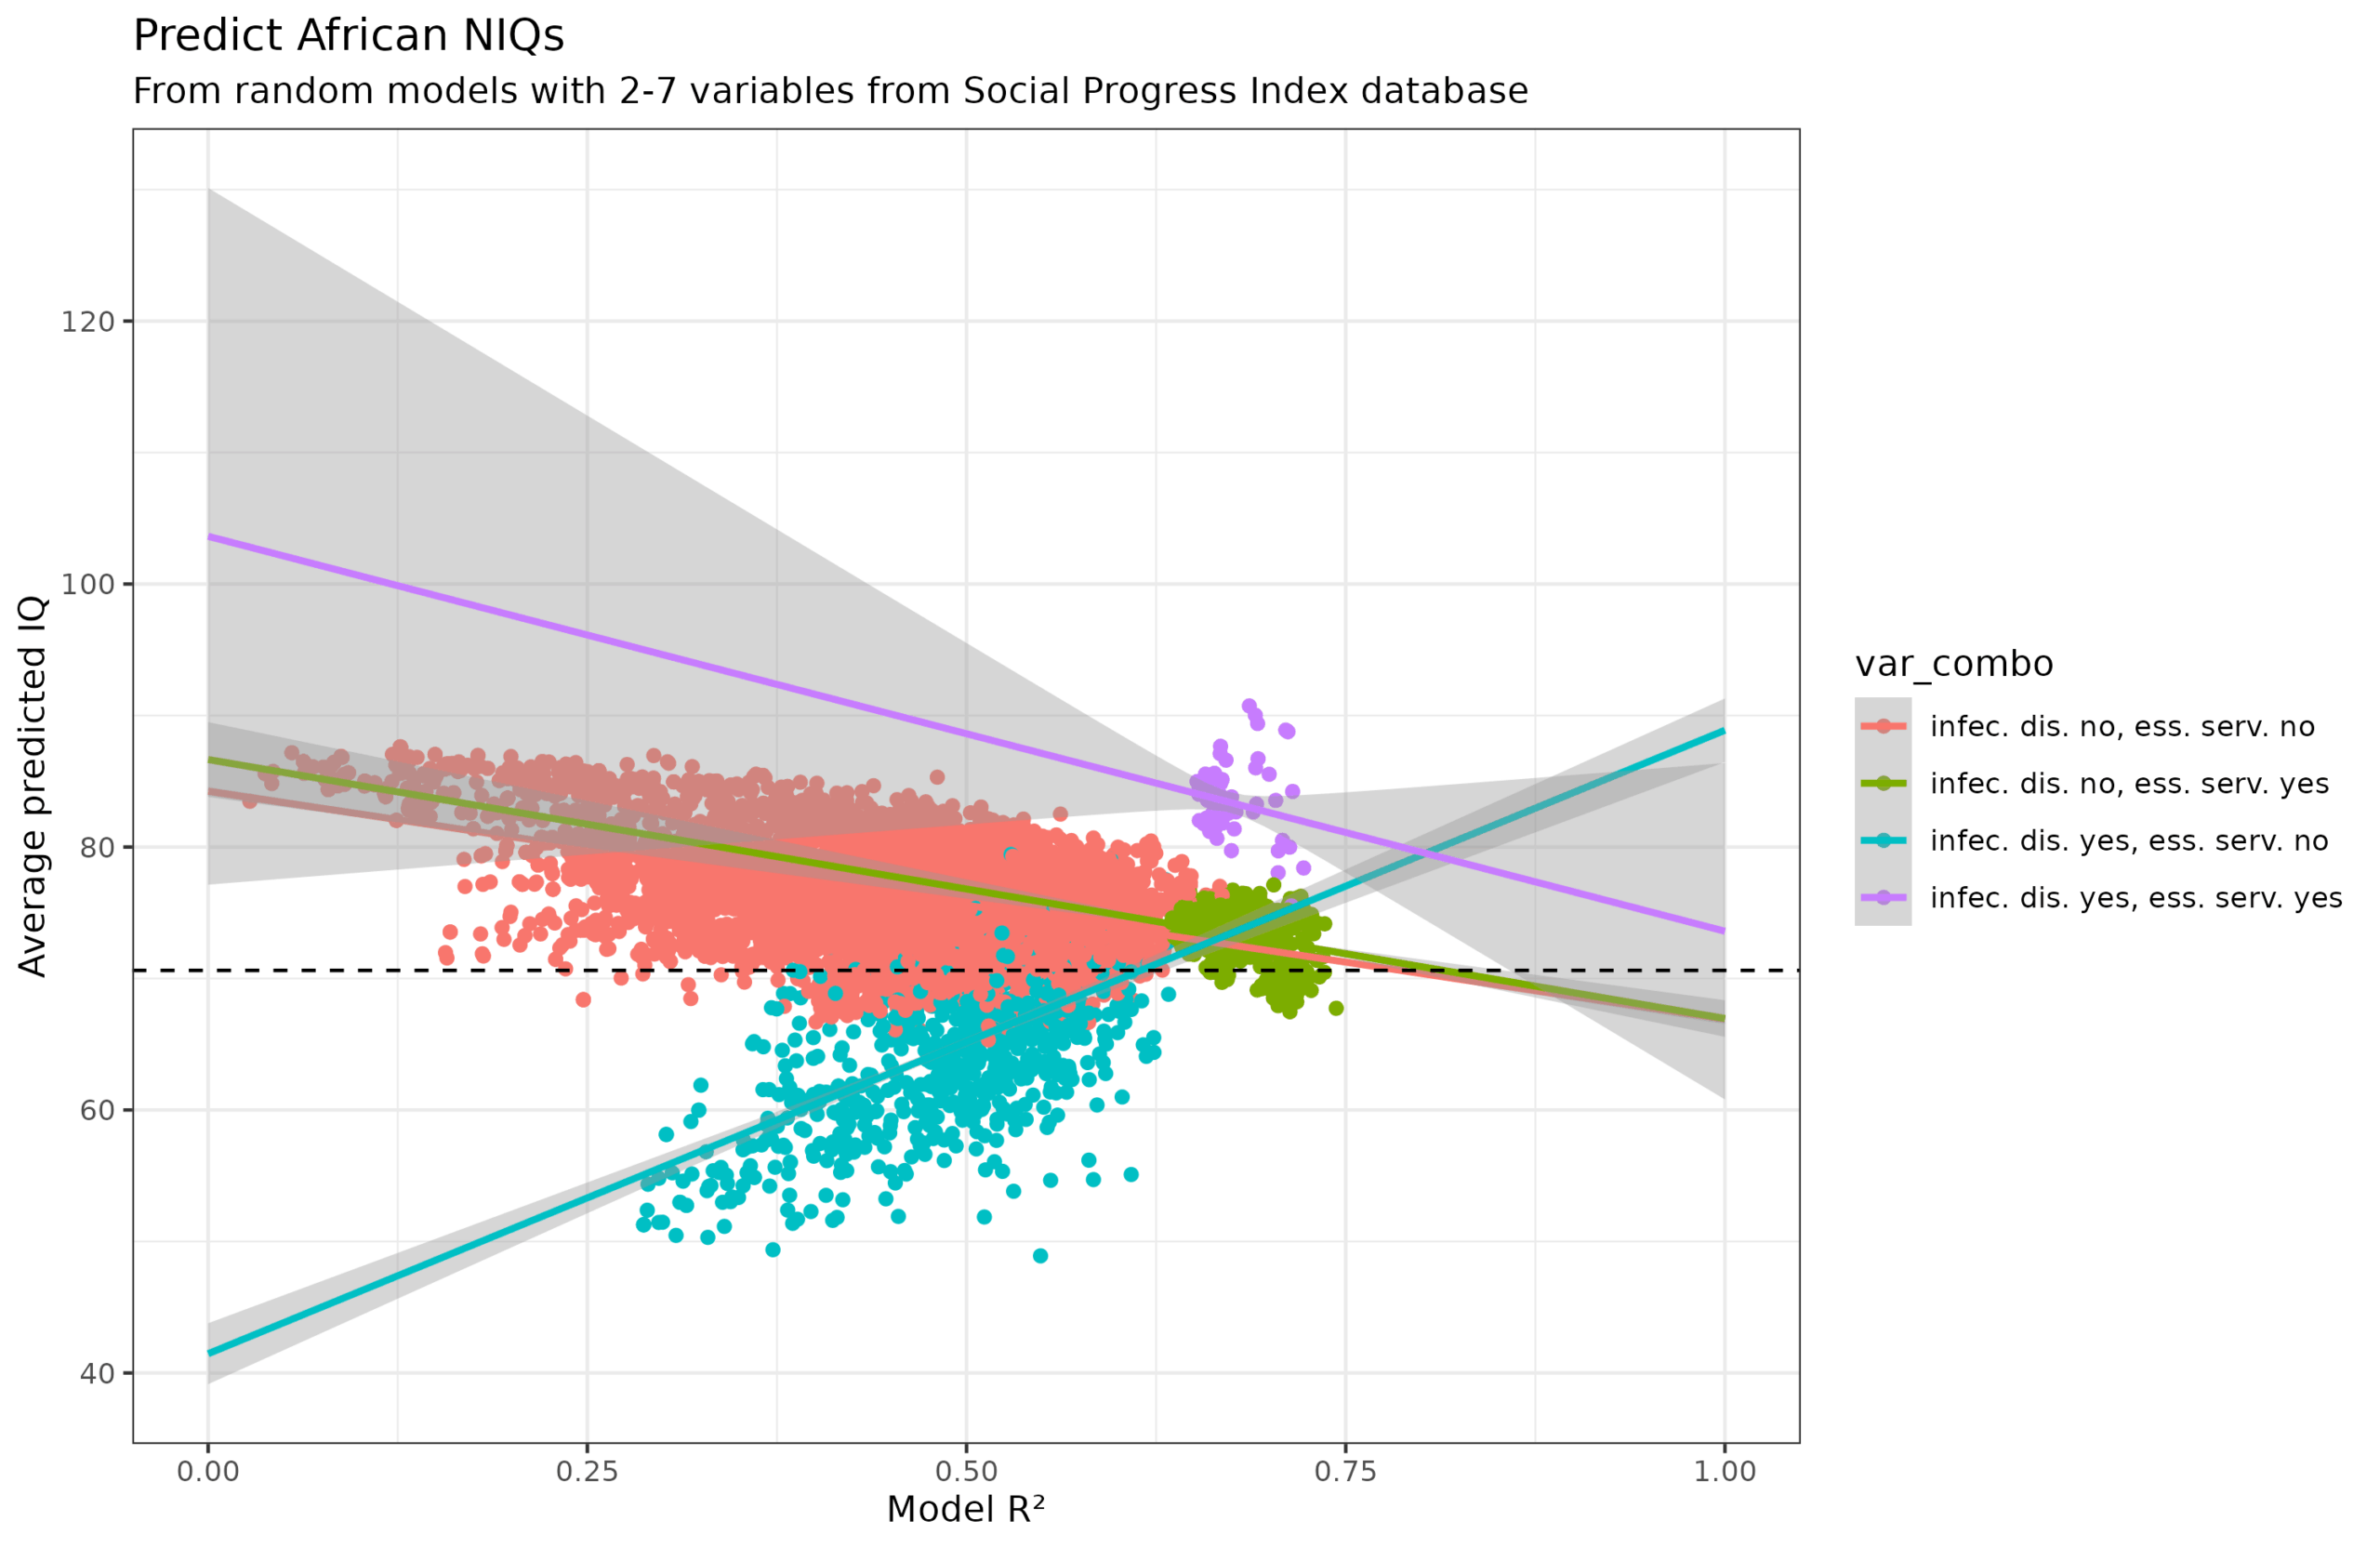
When infectious diseases is in the model but not essential services (teal), African countries are underestimated and the slope is wrong. Then, even weirder, when essential services is also in the model (purple), the IQs are overestimated (and the slope is correct). However, essential services by themselves being in the model don’t cause issues (green) nor disagrees with the models without either variable (red). This is pretty strange, and I don’t really understand it.
Anyway, disregarding this peculiarity, the predicted IQs of the Sub-Saharan countries are:
- Model R² alone: 68 IQ
- Model R² + model size: 69 IQ
- Model R² + model size + dummies for each SPI variable: 71 IQ
- Model R² alone (without infectious diseases variable): 68 IQ
The ‘true’ value from this combined dataset is the one shown with the horizontal line, which is 71. As such, we can recover the African IQ mean using variables from another source combined with the non-African IQs. This means that critics have to not only deny the low IQs of African countries, but have to deny the non-African ones too, since these allow one to recover the unobserved African IQs.
Speaking of dubious values, Rindermann notes:
Problems in studies of individual countries should not be swept under the carpet. In the case of Cuba (LLECE) and Kazakhstan (PIRLS and TIMSS), there are suspicions of fraud, as the reported results appear implausibly high. For some countries (e.g., Cambodia and Namibia), measured and predicted values (based on education, GDP/c, etc.) deviate considerably. Many countries have only participated in a single survey or regional study. It would be advisable for these countries to participate regularly in major international student assessment studies (e.g., PIRLS, PISA, TIMSS). This is especially true for India (only two regions took part in PISA 2009), China (data are available only for eastern regions), and, above all, sub-Saharan Africa. To improve outcomes and competencies, expanding educational provision (e.g., more years of kindergarten, extended schooling) and improving teacher training are recommended. Where large discrepancies exist between predictions and test results, the potential for improvement appears particularly high.
There is another weird case of this I just saw on X, TIMSS 2022 for Turkey:
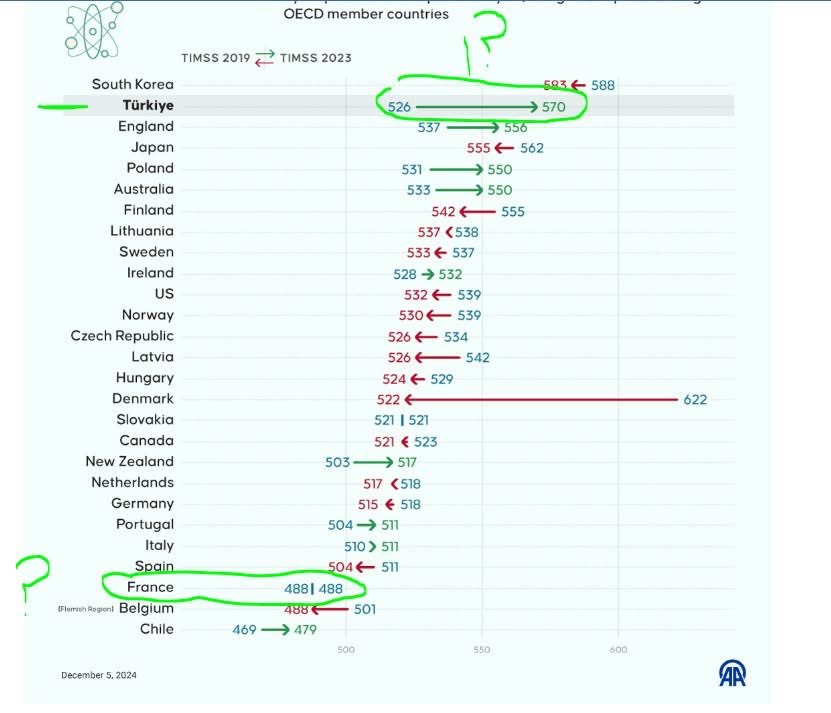
I couldn’t find a specific source of the image, but the logo is from the Turkey news site AA.com.tr (AA logo in the bottom) which has an article about this topic. Turkey appears to have magically gained a lot of points, while Denmark lost 100 points between TIMSS 2019 and 2022. I checked TIMSS 2022 website and it is true that Turkey moved up a lot (the value they are using is the highest one, 4th grade science). This appears to be because they are cheating with the exclusions which is not so surprising because Turkey is a authoritarian state. The TIMSS 2023 appendices show that Turkey excluded 20%+ of the students in the testing population. The Denmark massive decline appears to be because whoever made the plot typed in the wrong values. TIMSS 2019 wesbite shows Denmark with scores of 525 and 522 (math and science), and the scores were 524 and 522 for 2023.
Our new national IQ compilation is now published
And speaking of national IQs, we have released our new joint estimates of national IQs with values for almost every country. These are based on aggregating the existing datasets, main work by mr. Parra:
- Parra, L., & Kirkegaard, E. O. W. (2025). National IQs: measurement and defense. OpenPsych. https://doi.org/10.26775/op.2025.11.17
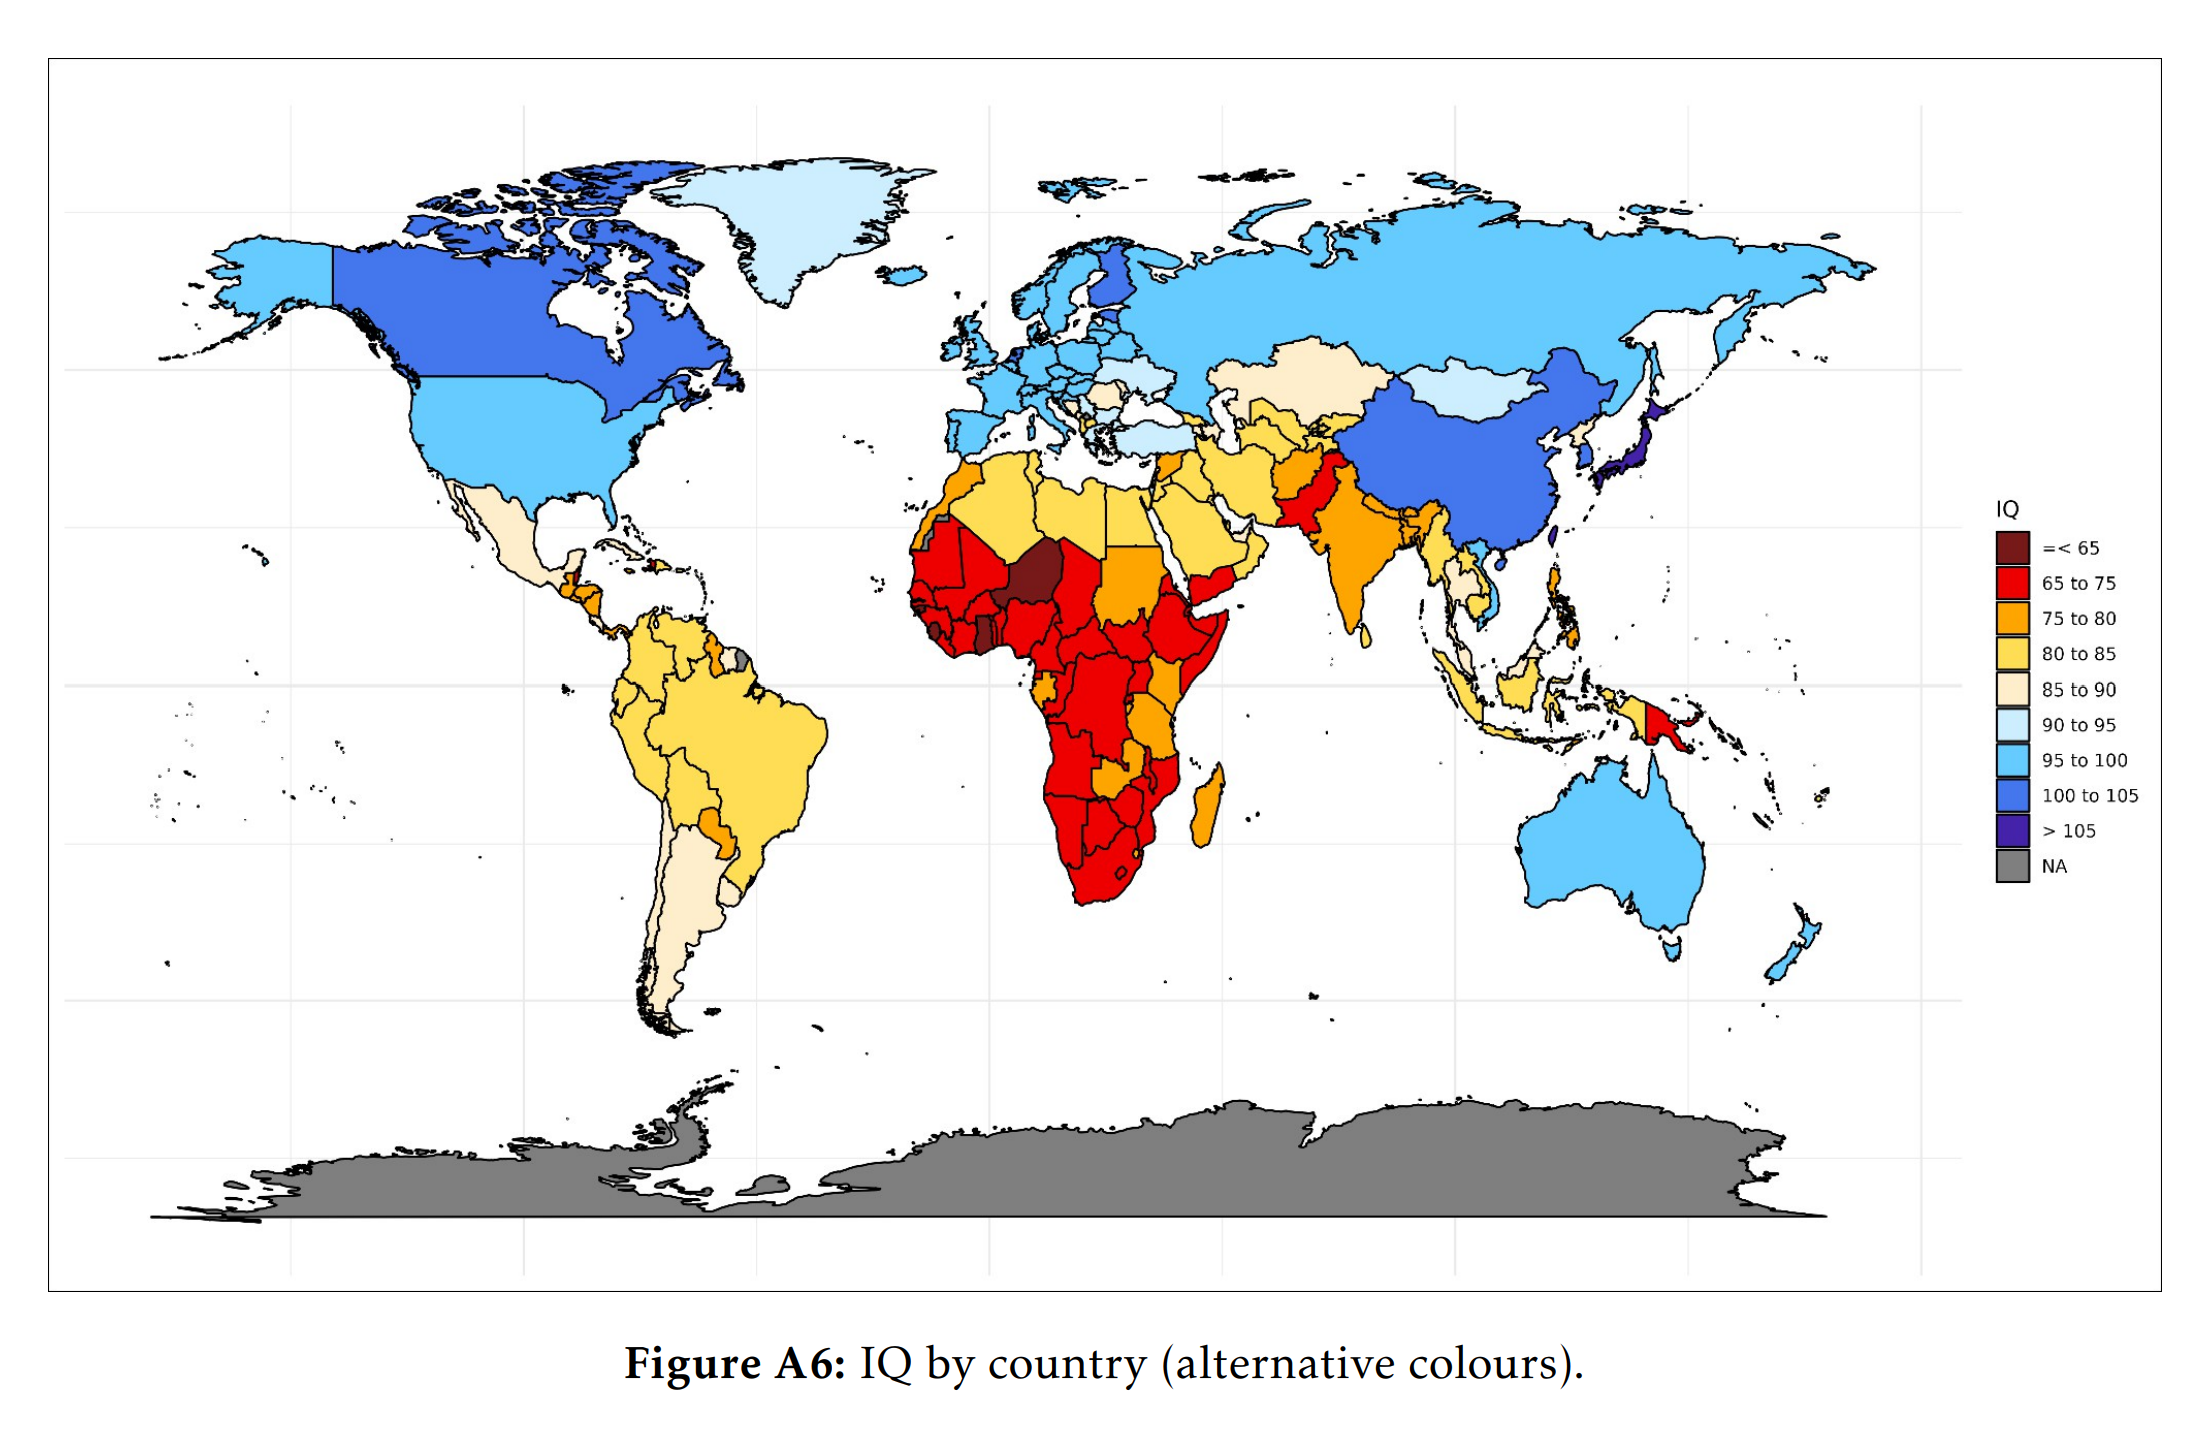
Using various sources of performance on cognitive tests, we constructed a set of national IQs for 197 nations that did not rely on geographic imputations. East Asian countries scored at an average of 100, Europeans at 95, Arabs at 85, Latin Americans at 80, South Asians at 75, and Sub-Saharan Africans at 70. The observation of a low IQ of Sub-Saharan Africa and a relatively high IQ of African Americans (~85) is incompatible with a view that national differences in intelligence are completely environmental or genetic. Combining the various datasets reduced the estimated standard error of national IQs from 5.41 to 2.58, and a strong correlation between IQ and GDP per capita was observed (r = .82). Based on the prior that Flynn Effect gains do not satisfy measurement invariance, IQ scores should exhibit some non negligible bias between countries. Empirical assessments of measurement invariance across nations find that measurement invariance violations are uncommon, and are more prevalent in verbal than nonverbal tests. In most countries, national IQs show high levels of validity and we encourage their use.
The national IQs I’ve been using in this post are in fact based on this new paper. The map looks more or less the same as always: